
I. Yunusa
Department of Biochemistry, Kano University of Science and Technology, Wudil, PMB 3244, Kano, Nigeria
L.U.S. Ezeanyika
Department of Biochemistry, University of Nigeria, Nsukka, Nigeria
Asian Journal of Scientific Research
Year: 2013 | Volume: 6 | Issue: 1 | Page No.: 16-26


ABSTRACT
Studies of dietary intake and status were collected from across Nigeria by literature search and personal contact with some country experts. Studies that satisfied a defined set of criteria; published, based on individual intakes and adequate information provided to enable its quality to be assessed were selected for further analysis. Twenty seven articles from four agroecological zones of the country were included and from them data on energy, protein, fats, carbohydrates, vitamins, minerals and trace elements were collected. Data on energy intakes were given in a large number of studies, but information was very limited for some micronutrients. Studies gave data on food patterns peculiar to their cultural and/or regional characteristics. A variety of collection methods were used, there was no consistency in the ages of adolescents studied or the age cut-off points, but some studies gave data for males and females separately at all ages. None of the study article was nationally representative and most of the remainders were regional. Apart from anthropometric measurements, status data were also collected from the four regions. Males had higher energy intakes than females. Variations in energy intakes and other nutrients related to energy intakes were not apparent across the regions within the country. In addition, most of the dietary studies did not rely on food composition tables for the conversion of food intake data to estimated nutrient intakes as there is no universally accepted food composition table across the country with a definite analytical methods, units and modes of expression. This can make comparisons between regions difficult and inaccurate. There are insufficient data on status to be able to be able to draw any conclusions about the nutritional quality of the diets of adolescents.
PDF Abstract XML References Citation
Received: April 20, 2012;
Accepted: May 21, 2012;
Published: October 06, 2012
How to cite this article
I. Yunusa and L.U.S. Ezeanyika, 2013. Dietary Intake, Anthropometry and Nutritional Status of Adolescents in Nigeria: A Review. Asian Journal of Scientific Research, 6: 16-26.
DOI: 10.3923/ajsr.2013.16.26
URL: https://scialert.net/abstract/?doi=ajsr.2013.16.26
DOI: 10.3923/ajsr.2013.16.26
URL: https://scialert.net/abstract/?doi=ajsr.2013.16.26
INTRODUCTION
Energy and nutrient intakes are important health variables particularly during adolescence (Cole et al., 1997); a period which involves growth and development that occur through a complex interaction of genetic and environmental factors (Lachance, 1998). The physical changes occur over a relatively short period of time, usually about 2 years for Europeans and Americans and 2-4 years in some cases for Africans (Barasi and Mottram, 1992). There are substantial gains in height and body weight which is greater for boys than for girls (Cole et al., 1997). There is little good, evidence-based information on the nutritional needs of healthy children and adolescents over the age of 2 years (Lambert et al., 2004). Although information on adolescents' energy and nutrient intakes abounds in the literature for the United States, UK, Germany and Australia, there is a paucity of corresponding information for any country in Africa (Cole et al., 1997).
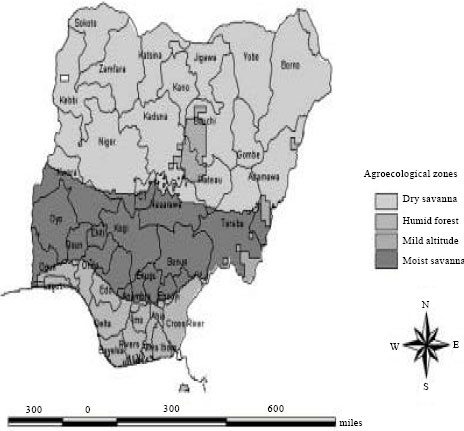 | |
| Fig. 1: | Map of Nigeria showing the different agroecological zones, Source: IITA, GIS Lab, 2000 |
No previous studies of the Energy Intake (EI), Energy Cost of Specific Activities (ECSA), Indirect Calorimetries (IC), Skin Fold Thickness (SFT) and Body Composition (BC) have been carried out on adolescents in Nigeria (Cole et al., 1997).
For this report, data available in Nigeria that could be used to help develop information on energy intake, anthropometry and nutrient status across the country was collected and evaluated to ascertain whether any trend could be identified. The aim of this review was to collect and evaluate data on nutrient intake and status across Nigeria and to ascertain whether any trend could be identified. Our particular interest was to have data from different regions of Nigeria to make some comparisons between the four agroecological zones (AEZ); dry savanna, humid savanna, mild altitude and moist savanna (Fig. 1) which are known to posses different eating patterns. Furthermore, with so much variation in nutrient intakes recorded for adolescents within the country, the use of regions will be a helpful tool for examining trends in nutrient consumption.
MATERIALS AND METHODS
Data collection: Data was collected through a pubmed search engine with alternative use of words that are relevant to the title of this work. Expert opinion was also used where necessary.
Data organization: Measurement tools used and biological parameters investigated for each data set individually was organized under the followings:
| • | Quality of the document and whether published |
| • | Year and type of the article, e.g., longitudinal or cross sectional |
| • | Geographical distribution: national, regional or local study; rural or urban |
| • | Dietary assessment method used |
| • | Range of intakes (mean values, standard deviations or other distribution characteristics) |
| • | Age ranges, sex and sample size |
| • | Assessment of status: biochemical parameters |
The available articles were collected and related information was incorporated into the template by geographical location (Table 1). For describing regional trends in dietary intake of adolescents, Nigeria was further divided into six regions: south-west, south-east, south-south, north-west, north-east and north-central.
RESULTS AND DISCUSSION
Twenty-seven articles from the AEZ were selected for inclusion in the review. These are listed by State in Table 1. Most studies gave data for males and females separately for all ages. None of the selected articles has a nationally representative data. Eleven (40.7%) articles provided data on adolescents living in south-west region, five (18.5%) provided data on those living in south-eastern part of the country, five (18.5%) on those in north-central, four (14.8%) on those living in north-west, one (3.7%) on those from north-east. on the other hand, one (3.7%) was from the south-south.
| Table 1: | Studies included in the dietary intake and status review |
 | |
| M, male; F, female | |
Many of the articles use a 24 h-dietary recalls and where energy intakes need to be measured it was carried out by direct weighing of the food items then followed by laboratory analysis. All anthropometric measurements were carried out according to standard procedure. Some research groups provided additional information on status but micronutrients data were more abundant in reports from the south-west and south-east.
Energy: Data obtained for both males and females do not provide information on energy intakes for a number of age categories. Adolescents (10-19 years) were not equally represented in terms of the number of the studies. When expressed in absolute terms, reported energy intakes (kJ/day) increased with increasing age in both males and females; when the data were expressed relative to body weight (kJ kg-1 per day), no clear trend was apparent. Within each age category there was a wide range in reported energy intake (kJ/day) and this variability increased in magnitude with increasing age. Energy intakes of males (10-18 years) were in the following ranges; 4996-6493 kJ day-1 (Oranusi et al., 2007) and the corresponding intakes for females (11.5-19 years) were: 4446-6510 kJ day-1 for females (Cole et al., 1997). Overall, energy intakes (kJ kg-1 per day) appeared to increase during adolescence in males more than their female counterparts in Nigeria (Cole and Ogungbe, 1987; Cole and Ogbe, 1987; Oguntona et al., 1998) irrespective of the geographical regions.
Carbohydrate and dietary fibre: Data for absolute intakes (g day-1) were collected for total carbohydrate. From a study of south-eastern urban adolescents; male consume more (absolute amounts) carbohydrate (518.92±27.67 g day-1) than female adolescents (425.50±26.68 g day-1) (Ogechi et al., 2007) but similar energy intake was observed for both groups. At present, there is no study to indicate total carbohydrate intakes in relation to age groups among the adolescents and to demonstrate a change in percentage energy from carbohydrate with age among adolescents from Nigeria. Moreover, data obtained for dietary fibre intakes and ash among female adolescents from south-western Nigeria (Ijarotimi, 2004) showed a mean intakes value of 2.93 and 12.05 g kg-1, respectively.
Fat: Data originated from the available articles revealed that fat and oils intakes by female adolescents was almost double than that of their male counterparts. Studies of south-western and south-eastern adolescents indicated that the mean total fat intakes for female were higher (47.05±9.99-78.3±8.50 g) than their male counterparts (40.10±2.81-43.69±3.84 g) (Ijarotimi, 2004; Ogechi et al., 2007) and urban study participants had higher fat intakes than their rural counterparts (Ijarotimi, 2004). There were fewer evidences for any age and geographical trend in terms of total fat intakes among Nigerian adolescents.
Protein: Most studies did not provide data on protein intakes per day for a number of age categories among adolescents. Pooled total protein intake ranged from 40 to 89 g with a mean value of 63 g in Nigerian adolescents (Oguntona et al., 1999). A study from south-eastern adolescents revealed higher value in males (54.43±7.94 g) than females (51.49±9.56 g) (Ogechi et al., 2007). On the other hand, another study of rural and urban adolescent females in Borno State in the north east geographic zone indicated that subjects obtained higher proportions of energy from protein and carbohydrate and a lower proportion of energy from fat than their female counterparts from the south-western part of the country (Oguntona et al., 1987).
Alcohol: No data on intakes for alcohol or status were available.
Water soluble vitamins
Folic acid: Data on folic acid intake for adolescents were obtained from the available articles. There were no data to indicate clear geographical trends in folic acid intake. However, an overall mean folic acid intakes of 9.80 μg kg-1 were recorded among female adolescents from the south-west with the urban female adolescents consuming twice dietary folic acid intakes (15.00 μg) than their rural counterparts (7.48 μg) (Ijarotimi, 2004). No available data to indicate whether folic acid intake is age or sex dependent. Furthermore, a report of south-eastern pregnant adolescents revealed that the folic acid intake of these adolescents was very low, ranging from 158 to 183 μg day-1, respectively for <17 years and >17 years rural adolescents (Oguntona and Akinyele, 2002). No available data on the folic acid intakes in adolescents from northern Nigeria.
Niacin: The only available report to indicate niacin intake for adolescents was from the south west. The overall niacin mean intakes of 3.27 mg kg-1 body weight were reported for female adolescents (Ijarotimi, 2004). Study participants from urban settlements had higher mean intakes (4.91 mg kg-1) than their rural counterparts (2.29 mg kg-1). So far, no research has ever been reported from the northern Nigeria on the assessment of niacin intakes in adolescents.
Riboflavin: Data obtained from the available articles revealed that riboflavin intakes were investigated in a study of female participants from the south-west. The study indicated mean riboflavin intakes (0.28 mg kg-1) with urban participants having higher values (0.42 mg kg-1) than their rural counterparts (0.19 mg kg-1) (Ijarotimi, 2004). Intakes of 1.05±0.79 mg kg-1 were reported from one study from the south-south (Ekpo and Jimmy, 2006). However, a study indicated that none among the study participants met the Recommended Dietary Allowances (RDA) (Ijarotimi, 2004). Also none among the studies indicated whether riboflavin intake increased with age and gender. There was no available research on riboflavin intake on adolescents from north-western part of the country. Status data were not reported.
Thiamin: Data obtained from the available articles indicated that there were no clear geographical trends in thiamin intakes between those geo-political regions of the country with reported intakes. The overall mean thiamin intakes were observed in adolescent female participants from the south-west (0.7 mg kg-1) (Ijarotimi, 2004). Participants from urban settings had higher values (1.10 mg kg-1) than their rural counterparts (0.58 mg kg-1) (Ijarotimi, 2004). Intakes as low as 0.06±0.17 mg kg-1 were reported in the south-south female study participants (Ekpo and Jimmy, 2006). On the other hand, ranges of intakes 0.38 to 1.6 mg were reported from studies of south-western participants and females had higher intakes than male subjects (Oguntona et al., 1999). In general, there was no reported study to indicate whether thiamin intake increased with age among Nigerian adolescents. There was also paucity of data on thiamin intakes for adolescents’ subject from north-western part the country. Status data were not reported.
Vitamin B12: Data for male and female adolescents on vitamin B12 intakes were not commonly reported, of three represented data for both genders combined, the highest vitamin B12 mean intakes were observed in south-west female study participants (1.20 μg kg-1) and urban participants had higher intakes (2.50 μg kg-1) than their rural counterparts (0.41 μg kg-1) (Ijarotimi, 2004). In general, there was no available study to indicate whether vitamin B12 intake increased with age among Nigerian adolescents. Also, there was no evidence for any geographical trend. Status data were not reported.
Vitamin C: Data for male and female adolescents on vitamin C intakes were not commonly reported, of four represented data for both genders combined, mean intakes (9.1 mg kg-1) were observed in south-west female study participants and urban participants had higher intakes (9.4 mg kg-1) than their rural counterparts (8.7 mg kg-1) (Ijarotimi, 2004). Intakes as higher as 23.5 mg kg-1 and 148.29±80.29 mg kg-1 were reported in the south-western and south-southern part of the country, respectively (Oguntona et al., 1999; Ekpo and Jimmy, 2006). In general, there was no available study to indicate whether vitamin C intake increased with age among Nigerian adolescents. Also, there was no evidence for any geographical trend. Status data were not reported.
Fat soluble vitamins
Vitamin A: Data for male and female adolescents on vitamin A intakes were not commonly reported, of four represented data for both genders combined, the overall vitamin A mean intakes were observed in south-west female study participants (860.0 μg kg-1) and urban participants had higher intakes (950.8 μg kg-1) than their rural counterparts (815.0 μg kg-1) (Ijarotimi, 2004). In general, there was no study to indicate whether vitamin A intake increased with age among Nigerian adolescents. Also, there was no evidence for any geographical trend. Status data were not widely reported.
Vitamin D: Data for male and female adolescents on vitamin D intakes were not commonly reported, of three represented data for both genders combined, the overall vitamin D mean intakes were observed in south-west female study participants (2.14 μg kg-1) and urban participants had higher intakes (4.60 μg kg-1) than their rural counterparts (0.68 μg kg-1) (Ijarotimi, 2004). In general, there was no study to indicate whether vitamin D intake increased with age among Nigerian adolescents. Also, there was no evidence for any geographical trend. Status data were not reported.
Minerals
Calcium: Data for male and female adolescents on calcium intakes were not widely reported. Overall mean calcium intakes (567.0±67.2 mg kg-1) were observed in south-west female study participants and urban participants had lower intakes (522.2 mg kg-1) than their rural counterparts (610.0 mg kg-1) (Ijarotimi, 2004). Intakes as higher as 664.0 mg kg-1 and as low as 340.47±34.17 mg kg-1 was reported in a study from the south-west and south-southern part of the country (Oguntona et al., 1999). In general, there was no study to indicate whether calcium intake increased with age among Nigerian adolescents. Also, no obvious geographical trends were reported across the country.
Status data available from north-western part of the country for adolescents (10-19 years) were in the range of 9.4±0.69-9.9±0.76 mg dL-1 and did not indicate a clear trend of increase with age and gender (Yunusa and Atiku, 2010).
Potassium: Data for male and female adolescents on potassium intakes were not commonly reported. The overall mean potassium intakes were observed in south-west female study participants (14169±309.3 mg kg-1) and urban participants had lower intakes (9213 mg kg-1) than their rural counterparts (25884 mg kg-1) (Ijarotimi, 2004). In general, there was no study to indicate whether potassium intake increased with age among Nigerian adolescents. Also, no obvious geographical trends were reported across the country.
Sodium: Data for male and female adolescents on sodium intakes were not commonly reported. A study from available articles indicated that mean sodium intakes in south-west female study participants was 2363±418.6 mg kg-1 and urban participants had higher intakes (2579 mg kg-1) than their rural counterparts (2147 mg kg-1) (Ijarotimi, 2004). In general, there was no study to indicate whether sodium intake increased with age and gender among Nigerian adolescents. Also, no obvious geographical trends were reported across the country.
Magnesium: Data for male and female adolescents on magnesium intakes were not commonly reported. The average magnesium intakes (261.3±45.5 mg kg-1) were observed in south-west female study participants and urban participants had lower intakes (233.0 mg kg-1) than their rural counterparts (289.5 mg kg-1) (Ijarotimi, 2004). In general, there was no study to indicate whether magnesium intake increased with age and gender among Nigerian adolescents. Also, no obvious geographical trends were reported across the country. Status data were not reported.
Iron: Data for male and female adolescents on iron intakes were commonly reported. The overall mean iron intakes were observed in south-west female study participants (19.8±2.9 mg kg-1) and urban participants had higher intakes (21.8 mg kg-1) than their rural counterparts (17.9 mg kg-1) (Ijarotimi, 2004). Intakes of iron showed very wide variation with male and female cohorts ranging from 3.7-15.1 mg and females had higher intakes of iron than males (Oguntona et al., 1999). In general, there was no study to indicate whether iron intake increased with age and gender among Nigerian adolescents. Also, no obvious geographical trends were reported across the country.
Zinc: Data for male and female adolescents on zinc intakes were not commonly reported. The overall mean zinc intakes of 7.58±0.90 mg kg-1 were observed in south-west female study participants and urban participants had higher intakes (8.0 mg kg-1) than their rural counterparts (7.14 mg kg-1) (Ijarotimi, 2004). In general, there was no study to indicate whether zinc intake increased with age and gender among Nigerian adolescents. Also, no obvious geographical trends were reported across the country.
Phosphorus: Data for male and female adolescents on phosphorus intakes were not widely reported. The overall mean phosphorus intakes were observed in south-west female study participants (136.8±35.5 mg kg-1) and urban participants had lower intakes (58.2 mg kg-1) than their rural counterparts (215.3 mg kg-1) (Ijarotimi, 2004). In general, there was no study to indicate whether phosphorus intake increased with age and gender among Nigerian adolescents. Also, no obvious geographical trends were reported across the country.
Status data available from north-west part of the country for adolescents (10-19 years) were in the range of 3.6±1.11- 3.9±1.74 mg dL-1 did not indicate a clear trend of increase with age and gender (Yunusa and Atiku, 2010).
Anthropometry: Data on adolescence anthropometry were widely reported across the country more than any other nutritional status indices. Skinfold thickness, Body Mass Index (BMI) and circumferences (especially mid-upper arm circumference, MUAC) are the most frequently reported variables. Studies from the south-eastern study participants indicated that at mean age of 16.27±1.08 years for both males and female adolescents the corresponding values for weight (56.47±8.64 and 53.48±6.94 kg), height (167.35±6.29 and 161.92±5.30 cm) , MUAC (23.5±1.95 and 23.82±2.07 cm), BMI (19.99±2.56 and 20.50±2.38 kg m-2), tricep (6.36±1.30 and 11.19±3.70 mm), bicep (4.89±0.93 and 7.01±2.65 mm), subscapular (8.38±1.36 and 10.91±2.75 mm), suprailiac (7.67±1.59 and 10.41±2.88 mm), body fat (9.43±2.39 and 12.54±3.34 kg) and percent body fat (16.56±1.88 and 23.02±3.87 %), respectively (Ogechi et al., 2007). Similarly, Akinyemi and Ibraheem (2009) reported a mean weight (kg) of 59.7, a mean height (cm) of 170 and a BMI (kg m-2) of 21.6 for the adolescent subjects within 13-15 years age range.
Also, studies from a north-central parts of the country reported the corresponding values for males and females at mean age of 16 years; weight (48.44 ± 2.15 and 51.66±3.18 kg), height (155.12 ± 2.47 and 161.15 ± 4.19 cm) (Nwokoro et al., 2006; Amuta and Houmsou, 2009). On the other hand, a BMI (19.22 ± 3.18 and 19.92 ±3.46 kg m-2), MUAC (22.44±2.61 and 23.8.±2.44) and BMI (18.6±3.75 and 19.6±2.93 kg m-2), MUAC (20.1±3.20 and 22.1±3.70) were reported from the north-west for the same subjects of 16 year age groups respectively (Atiku and Yunusa, 2009). These anthropometrics values give a clear trend of higher nutritional status of the southern-eastern subjects over their north-central and north-western counterparts within the same age bracket.
Quality of data: As demonstrated in Table 1, there is large diversity in the methodologies used to assess the individual dietary intakes of adolescents. Overall these fall into four main classes: 24 h recalls (retrospective); food frequency questionnaires (retrospective); dietary history (retrospective); and dietary records of 1, 2, 3, 4 and 7 days (prospective). Because the different methods apply to different time frames, this inevitably resulted in variance in both the quality and the quantity of available data and hampered comparisons within and between geo-political regions and states of the country. Moreover, evaluation of the data sets could not be possible in all the studies; because food composition tables were not used (in some of the studies) for the conversion of food intake data to the estimated nutrient intakes. However, in studying the comparability of food composition tables, Deharveng et al. (1999) distinguished three groups of nutrients. The first group is those that can legitimately be compared even though the definition and analytical method may be slightly different. This group includes nitrogen, lactose, alcohol, water, cholesterol, fat, fatty acids, retinol, vitamin D, tocopherols, tocotrienols, thiamin, riboflavin, vitamin B6, vitamin B12, Ca, Fe and K. The second group is those that are not readily comparable due to discrepancies in the calculation or mode of expression, and comprise protein, carbohydrates, starch, sugars, energy, carotenes, vitamin A and vitamin E. Finally, there are nutrients that are not comparable at all due to the analytical method or definition used namely folate and fibre.
In addition, dietary studies tend to overestimate true intakes of Na, primarily due to the inability to account precisely for added salt and the fact that much salt is discarded with the cooking water. Salt may also be lost when manufactured foods are cooked. Therefore, to assess the intake of Na, it is recommended that measurements of Na excretion are made (Ovesen et al., 2002). However, none of the studies reporting Na intake included Na excretion as a status parameter.
However, despite these precautions, differences such as the conversion factors used to assess the intakes of protein, carbohydrates and energy and the analytical quality of the data (possible use of outdated analytical methods) cannot be excluded, and prudence is called for in the interpretation of the figures given. In general, the present findings are in line with earlier observations that there is a lack of internationally comparable food consumption data (Lowik and Brussaard, 2002). Lambert et al. (2004) further acknowledged that; apart from the inherent problems found in even the most carefully conducted dietary surveys; there were several other reasons why surveys could not easily be compared. These included: different methods for measuring intake; different age cut-off points; use of a variety of food composition tables based on different analytical techniques for measuring food composition; failure to exclude under-reporters; and few truly nationally representative samples. Prentice et al. (2004) recommended the establishment of a National Nutrient Database that would be a useful first step towards being able to compare food intake data. This would also help in defining analytical methodology and in the harmonization of units for specific nutrients such as dietary fibre, folic acid and vitamins A and E. Daily amounts are of little value since the methods used to establish many of these have been called into question.
Most dietary intake studies of children and adolescents have, at least until recently, tacitly assumed that the data are representative and valid measures of habitual food consumption (Lambert et al., 2004). Unfortunately, epidemiological studies of food habits and dietary intake in children and adolescents face a number of difficulties that are more-or-less specific to these age groups and which are highly likely to bias the outcome measurements (Livingstone and Robson, 2000; Livingstone and Black, 2003; Livingstone, 2004). On the basis of recent validation studies, it is now widely accepted that misreporting is a major problem in dietary surveys of children and adolescents. Consequently, the dietary data presented in this review need to be interpreted and evaluated with caution.
Nutritional status: The literature has shown that many studies do not make correlations between blood analytes and dietary intakes. In addition, the number of investigations and articles published is too small to be able to describe and/or compare the nutritional status of adolescents within the country. The differences in information on measured status may have an impact on the precision of nutrient estimations and make comparisons imprecise. In the case of vitamin D, not only diet, but also endogenous synthesis under the influence of sunlight can influence status (Lehtonen-Veromaa et al., 1999). Moreover, it is also important to take into account that different technical equipment and statistical software packages were used to run the data analyses (status and intake); not all data were expressed as mean±SD. In some cases simple range values were used, making it difficult to compare status data.
CONCLUSION AND RECOMMENDATIONS
Some studies of food and nutrient intake in Nigerian adolescents have been undertaken over the past ten to twenty years. The studies included in this review provide some useful information on energy and nutrient intakes of adolescents in the country and did not indicate any trend except for anthropometry data which clearly indicated increase in values with an increase in age and a higher nutritional status of the south-eastern and south-western adolescents compared to their north-central and north-western counterparts. However, their value for discovering average intakes of Nigerian adolescents, or making comparisons between regions, is severely limited because not all studies utilized national food composition data base. The routine collection of status data at the same time as food intake is assessed would help in comparisons of the status situation in different AEZ of the federation. Aligned methodologies for nutrient status would make a comparison both at national and international levels more precise.
REFERENCES
- Adu, O.B., A.M. Falade, E.J. Nwalutu, B.O. Elemo and O.A. Magbagbeola, 2009. Nutritional status of undergraduates in a Nigerian university in south-west Nigeria. Int. J. Med. Med. Sci., 1: 318-324.
Direct Link - Akinyemi, O. and A.G. Ibraheem, 2009. Assessment of nutritional status of queens college students of Lagos State, Nigeria. Pak. J. Nutr., 8: 937-939.
CrossRefDirect Link - Anyika, J.U., A.C. Uwaegbute, A.O. Olojede and J.U. Nwamarah, 2009. Nutrient intakes of adolescent girls in secondary schools and Universities in Abia State of Nigeria. Pak. J. Nutr., 8: 1596-1602.
CrossRefDirect Link - Cole, A.H. and J.O. Ogbe, 1987. Energy intake, expenditure and pattern of daily activity of Nigerian male students. Br. J. Nutr., 58: 357-367.
PubMed - Cole, A.H. and R.F. Ogungbe, 1987. Food intake and energy expenditure of Nigerian female students. Br. J. Nutr., 57: 309-318.
PubMed - Cole, A.H., O.O. Taiwo, N.I. Nwagbara and E.C. Cole, 1997. Energy intakes, anthropometry and body composition of Nigerian adolescent girls: A case study of an institutionalized secondary school in Ibadan. Br. J. Nutr., 77: 497-509.
PubMed - Deharveng, G., U.R. Charrondiere, N. Slimani, D.A.T. Southgate and E. Riboli, 1999. Comparison of nutrients in the food composition tables available in the nine European countries participating in EPIC. Eur. J. Clin. Nutr., 53: 60-79.
Direct Link - Ejike, E.C.C.C., E.C. Ugwu and U.S.L. Ezeanyika, 2010. Physical growth and nutritional status of a cohort of semi-urban Nigerian adolescents. Pak. J. Nutr., 9: 392-397.
CrossRefDirect Link - Ekpo, A.J. and E.O. Jimmy, 2006. Dietary and haematological evaluation of adolescent females in Nigeria. Pak. J. Nutr., 5: 278-281.
CrossRefDirect Link - Ene-Obong, H.N., 1993. Adolescents living in boarding houses in Nsukka, Enugu State, Nigeria ll: Quality of school meals and snacks and their contribution to nutrient intake. Ecol. Food Nutr., 30: 195-205.
Direct Link - Fawole, A.O., K.A. Obisesan, O.A. Ojengbede, I.A. Babarinsa, A.H. Cole, O.I. Fawole and A.O. Arowojolu, 2005. Parameters of nutrition in school girls in southwestern Nigeria. East Afr. Med. J., 82: 198-202.
PubMed - Goon, D.T., A.L.Toriola, J. Uever, S. Wuam and O.M. Toriola, 2010. Growth status and menarcheal age among adolescent school girls in Wannune, Benue State, Nigeria. BMC Pediatrics, Vol. 10.
CrossRef - Ijarotimi, O.S., 2004. Evaluation of energy and micronutrients intake of Nigerian adolescent females: A case study of institutionalized secondary schools in akure south local government area, ondo state, Nigeria. Pak. J. Nutr., 3: 250-253.
CrossRefDirect Link - Ijarotimi, O.S. and K.T. Ijadunola, 2007. Nutritional status and intelligence quotient of primary schoolchildren in Akure community of Ondo State, Nigeria. Tanzania Health Res. Bull., 9: 69-76.
PubMedDirect Link - Lachance, P.A., 1998. Overview of key nutrients: Micronutrient aspects. Nutr. Rev., 56: 34-39.
CrossRef - Lambert, J., C. Agostoni, I. Elmadfa, K. Hulshof and E. Krause et al., 2004. Dietary intake and nutritional status of children and adolescents in Europe. Br. J. Nutr., 92: S147-S211.
PubMed - Lehtonen-Veromaa, M., T. Mottonen, K. Irjala, M. Karkkainen, C. Lamberg-Allardt, P. Hakola and J. Viikari, 1999. Vitamin D intake is low and hypovitaminosis D common in healthy 9- to 15-year-old Finnish girls. Eur. J. Clin. Nutr., 53: 746-751.
Direct Link - Livingstone, M.B.E., 2004. Issues in dietary assessment in children and adolescents. Br. J. Nutr., 92: S213-S222.
PubMed - Livingstone, M.B.E. and A.E. Black, 2003. Markers of the validity of reported energy intake. J. Nutr., 133: 895S-920S.
Direct Link - Livingstone, M.B. and P.J. Robson, 2000. Measurement of dietary intake in children. Proc. Nutr. Soc., 59: 279-293.
PubMedDirect Link - Nwokoro, S.O., K., Ifada, O. Onochie and J.M. Olomu, 2006. Anthropometric assessment of nutritional status and growth of 10 - 20 years old individuals in Benin City (Nigeria) metropolis. Pak. J. Nutr., 5: 117-121.
CrossRefDirect Link - Ogechi, U.P., O.I. Akhakhia and U.A. Ugwunna, 2007. Nutritional status and energy intake of adolescents in umuahia urban, Nigeria. Pak. J. Nutr., 6: 641-646.
CrossRefDirect Link - Oguntona, C.R. and I.O. Akinyele, 2002. Food and nutrient intakes by pregnant Nigerian adolescents during the third trimester. Nutrition, 18: 673-679.
CrossRefPubMedDirect Link - Oguntona, C.R.B., M. Apoyin and A.M. Olateju, 1999. Sources of nutrients in the diets of adolescent Nigerians. Nutr. Food Sci., 99: 72-77.
Direct Link - Onimawo, I.A., 1998. Activity pattern and energy expenditure of male students in a Nigerian college of agriculture. Nutr. Res., 18: 963-973.
CrossRef - Oranusi, S., M. Galadima, V.J. Umoh and P.I. Nwanze, 2007. Energy intake and anthropometry: A case study of families in Zaria, Nigeria. Afr. J. Biotech., 6: 459-464.
Direct Link - Ovesen, L., H. Boeing and EFCOSUM Group, 2002. The use of biomarkers in multicentric studies with particular consideration of iodine, sodium, iron, folate and vitamin D. Eur. J. Clin. Nutr., 56: S12-S17.
PubMedDirect Link - Prentice, A., F. Branca, T. Decsi, K. M. Michaelsen and R.J. Fletcher et al., 2004. Energy and nutrient dietary reference values for children in Europe: Methodological approaches and current nutritional recommendations. Br. J. Nutr., 2: S83-S145.
PubMed - Amuta, E.U. and R.S. Houmsou, 2009. Assessment of nutritional status of school children in makurdi, Benue State. Pak. J. Nutr., 8: 691-694.
CrossRefDirect Link