
H. Onder
Department of Animal Science, Faculty of Agriculture, Ondokuz May1s University, 55139, Samsun, Turkey
M. Akif Cam
Department of Animal Science, Faculty of Agriculture, Ondokuz May1s University, 55139, Samsun, Turkey
E. Soydan
Department of Animal Science, Faculty of Agriculture, Ondokuz May1s University, 55139, Samsun, Turkey
Asian Journal of Animal and Veterinary Advances
Year: 2009 | Volume: 4 | Issue: 6 | Page No.: 314-319


ABSTRACT
This study is carried out to automate the small ruminant (sheep and goat) records and to use these records more effectively for animal breeding. It was aimed to calculate breeding values for animals by using this software. Additionally, it was aimed to calculate breeding values in terms of milk yield for male animals by using progeny testing (average offspring yield) which otherwise could not be measured by direct methods. Decision support systems, which help to decision making for flock owners and animal breeding persons, have been enhanced by using this software. Decision support systems such as determining of animals to be sold because of old age, determining of offspring that they have unknown father, accurately determining of yields of animals, health managements, determining of culling animals from flock were put into service of user as a tool. Appropriate software SURPRO V1.0 was written by use of Visual basic 6.0 and MsAccess was used as database with this objective in mind.
PDF Abstract XML References Citation
How to cite this article
H. Onder, M. Akif Cam and E. Soydan, 2009. Automation of Flock Management and Establishment of Decision Support Systems for Small Ruminant Production. Asian Journal of Animal and Veterinary Advances, 4: 314-319.
DOI: 10.3923/ajava.2009.314.319
URL: https://scialert.net/abstract/?doi=ajava.2009.314.319
DOI: 10.3923/ajava.2009.314.319
URL: https://scialert.net/abstract/?doi=ajava.2009.314.319
INTRODUCTION
Farmers and animal breeding persons require information on animal resources for further studies and evolving realistic strategies for improvement and rearing of livestock (Rai et al., 2008; Takma et al., 2009). Breeding goals identify the animal traits that farmers would like to improve and comprise many aspects other than high productivity with regard to cash products such as meat and milk. The definition of breeding goals constitutes the first decisive step in the development of genetic improvement strategies (Dossa et al., 2007). Record collection is the most important tool to improve of economic traits for all animal genotypes (Duzgunes et al., 1996; Unalan and Cebeci, 2007; Cole, 2007). For this aim, collection of completely and correct pedigree and yield records requires the experienced persons and labor-intensive works (Flint and Woolliams, 2008). There is an increased interest on dairy goat and sheep breeding in TURKIYE and its neighbor countries. These dairy enterprises collect the records for flock management and animal selection, however they do not gain adequately benefit from these data because of insufficiency of their record collection methods such as notebook and inflexible software (Onder and Torun, 2003).
As in other animal species, some software are used to record collection of sheep and goat breeding (Enns and Nicoll, 2002). However, these software could not meet the requests of farmers and animal breeding persons (Gootwine and Zenou, 1997; Dossa et al., 2007). Some software were prepared for these purposes but they not adequately enough for small or average farmers or they highly expensive to use (Onder and Torun, 2003).
This study aimed to prepare appropriate software which is capable of especially calculating the breeding values, evaluating the data for animal breeding, determining the reformed animals and younglings with unknown father, calculating correct animal yields for dairy goat and sheep breeders. To achieve this aim, requirements of the dairy goat and sheep breeders were determined by bilateral discussions.
MATERIAL AND METHODS
This project conducted at Ondokuz Mayss University, Agricultural Faculty, Department of Animal Science between 15 August 2007 and 15 August 2008. To programme the aimed software, Visual Basic 6.0 was used and Microsoft Access database which can perform with the support of Microsoft Jet 4.0 OLE DB Provider was used to record the data.
To test the software, data obtained from 352 Karayaka sheep (from 50 ewes and 5 rams) during 2005-2007 years at University of Tokat Gaziosmanpa°a was used. Some of the data was produced artificially to test the extreme situations. Same data was used to test the modules about the goats.
To check the results of breeding value estimations, Multiple Trait Derivative Free REML (MTDFREML), which is a well accepted software (Hulya Atil and Adel Salah Khattab, 2005), written by Boldman et al. (1995) was used.
Spearman’s rank correlation (Gauthier, 2001) was used to compare the breeding value estimations calculated with SURPRO V0.1 and MTDFREML.
A public survey with random sampling methods was carried out in 48 individuals to determine the user friendliness of this software. Users graded the software in terms of usability from 1 (very bad) to 5 (very good).
Appropriate database was designed only in Turkish with 42 tables and totally 699 fields belonging to these tables. Each table contains 16.64±2.13 fields as an average.
After the design of database, interfaces were designed with Visual basic 6.0 software. With this aim, 40 form and 28 data report were designed and coded. Totally 1228 objects were used on the forms and about 15000 code lines were written to bring into force the objects. Furthermore, 30 icons were drawn with the demo version of PrettyIconMaker (URL1) software. The opening form (MDI-Form) of the software was given in Fig. 1.
Accessing to the forms can be possible by menus or toolbar. Toolbar contains the buttons to access the forms which can be frequently used. Forms which can be rarely used can be accessible from the menu bar. An example view of ewe form was given in Fig. 2.
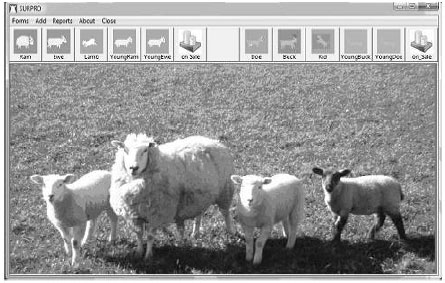 | |
| Fig. 1: | Opening form of the software |
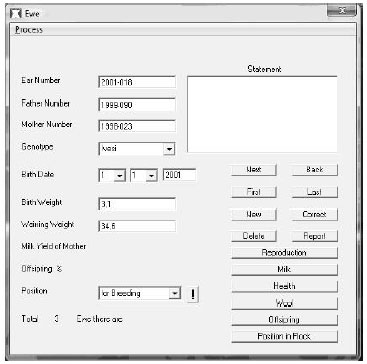 | |
| Fig. 2: | A view of Ewe form |
Connections to the database from interfaces obtained by using SQL scripts instead of objects offered by Visual Basic gallery because these connections have several disadvantages such as misreading of the data just after recording it. Although, operations with SQL script cause to write more code lines, it does not produce mentioned run time errors. The SQL script mostly used in this software development.
To record milk yields it is essential that animal should have a birth regardless of the younglings are alive or dead. At the end of the lactation period, it is easy to calculate lactation milk yield depends on control values of daily milk yields. Lactation milk yields are calculated with the formula given below (Anonymous, 1990);
where, a: time between give birth and first control date, X1 is value of the first control milk yield, Xi is ith milk yield value, Δt is number of the days between two control dates and Xn: milk yield obtained from of the last control.
Other yield records such as daily weight gain, greasy fleece weight and wool traits can be recorded and related parameters can be calculated. A decision support module for a goat was given in Fig. 3 as an example.
The horizontal yellow lines seen in Fig. 3 indicate the case situation of 100%. Blue vertical lines (dark lines in the printed material) indicate the flock means for the trait. Green vertical lines (light lines in the printed material) indicate the location of the selected animal in the flock. Accordingly, average lactation milk yield of this animal is close to the flock mean, but lactation duration of this animal is too short. However, daily weight gain of this animal is over the flock mean. This view can be used to support the decision of farmers about the individual animal.
The most important goal of this software was to calculate the breeding value of each animal. Breeding value can be described as double the amount of average phenotypic deviation of offspring from population mean. ![]() formula was used to calculate breeding value because number of offspring wont be equal for all male animals (Simm, 1998).
formula was used to calculate breeding value because number of offspring wont be equal for all male animals (Simm, 1998).
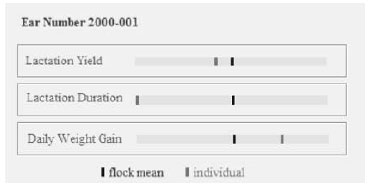 | |
| Fig. 3: | A sample view of goat decision support module |
| Table 1: | Heritability values for interested traits |
 | |
Here; ![]() : Population mean and
: Population mean and ![]() : phenotypic value of ith offspring. Breeding values of female animals can be calculated with formula given below because enough number of offspring can not be observed to calculate breeding value for female animals.
: phenotypic value of ith offspring. Breeding values of female animals can be calculated with formula given below because enough number of offspring can not be observed to calculate breeding value for female animals.
where, h02 is heritability value of the trait for calculating season. P is average phonotypical value of offspring for calculating season.
For this calculation it is essential to know heritability values for the traits. For this purpose, constant heritability values (Kaymakcı, 2006; Matika et al., 2003; Shaat et al., 2004) were used taking into the consideration of possibility to calculate negative heritability values when the variances of males are too small depending on flock size. Used heritability values were given in Table 1.
RESULTS
This software was presented to 48 users for examination who did not use it before. Users graded the software viewpoint of usability from 1 (very bad) to 5 (very good). Mean, SD, minimum grade, maximum grade and median values were found as 4.48, 0.37, 3, 5 and 5, respectively for this grade. Results showed that this software can be used easily and guidelines on the objects are useful.
The main goal of this software which is the calculation of breeding values was checked with the results of the breeding values obtained from MTDFREML. First ten of the breeding values and arrange in order of the animals was given in Table 2. Results were analyzed with the method of Spearman’s rank correlation to determine whether there is a difference in ranking of animals with respect to their breeding values between two software. Obtained correlation coefficient is 0.984 (p<0.01). Results showed that there is a significant positive correlation between the breeding values calculated with developed software and MTDFREML.
| Table 2: | First ten of the breeding values and arrange in order for weaning weight of the ewes |
 | |
But this relation is not complete. In this case, rankings were checked to introduce the origin of the differences. This difference caused by the alteration of rankings of two animals with same breeding values. This software was named as SURPRO V0.1. It was understood that the other software (URL2; URL3; URL4; URL5) focused on only some traits such as fleece yield and meat yield while ignoring the other traits. Also, SURPRO V0.1. was given to the farmers in August 2008 to take responses from fieldworks.
DISCUSSION
The results showed that aimed goals which are especially calculating the breeding values, evaluating the data for animal breeding, determining the reformed animals and younglings with unknown father, calculating correct animal yields were achieved. Examined software such as URL2, URL3, URL4 and URL5 showed that they do not have modules both sheep and goat while SURPRO V0.1 has. Responses of the users showed that usability of this software was high. Examination of user’s grade was not seen in obtained references. It was another difference from previous studies.
However, this software has some contradictions that heritability value can not be calculated from the recorded data. Because, flock sizes are small (Sahin and Yıldırım, 2002) and inbreeding is frequent in this country and its neighbours (Duzgunes et al., 1996), this software uses constant values to avoid negative heritability values. Another deficiency of it is that deleted data can not be undeleted because of being database application. Also inbreeding rate can not be calculated, while SelAction calculate (Rutten et al., 2002). Also, SURPRO V0.1 need Windows platform so, it does not work on other operating systems.
SURPRO V0.1 software was shown to meet the requirements of farmers and animal breeding persons. The major advantage of the software produced in this study is its ability to calculate the reliable breeding value when comparing the MTDFREML with other superiorities mentioned above. The other software had not these properties together. Since, farmers begin to work with SURPRO V0.1., negative feedback has not taken. With these properties, it can be said that this software achieved the aimed objectives.
For the future studies it can be suggested to use microchips to data collection if infrastructure is compatible.
ACKNOWLEDGMENT
This study was supported by The Scientific and Technological Research Council of Turkey (TÜBİTAK) with project number of 107 O 335.
REFERENCES
- Hulya Atil and Adel Salah Khattab 2005. Use of Multiple Traits Animal Model for Genetic Evaluation of Milk Yield and Age at First Calving of Holstein Friesian Cattle in Turkey Pak. J. Biol. Sci., 8: 114-117.
CrossRefDirect Link - Cole, J.B., 2007. PyPedal: A computer program for pedigree analysis. Comput. Electronics Agric., 57: 107-113.
CrossRef - Dossa, L.H., C. Wollny and M. Gauly, 2007. Smallholders perceptions of goat farming in Southern Benin and opportunities for improvement. Trop. Anim. Health Prod., 39: 49-57.
CrossRef - Enns, R.M. and G.B. Nicoll, 2002. Incidence and heritability of black wool spots in Romney sheep. New Zealand J. Agric. Res., 45: 67-70.
Direct Link - Flint, A.P.F. and J.A. Woolliams, 2008. Precision animal breeding. Phil. Trans. R. Soc., 363: 573-590.
CrossRef - Gauthier, T.D., 2001. Detecting trends using spearman's rank correlation coefficient. Environ. Forensics, 2: 359-362.
CrossRef - Matika, O., J.B. van Wyk, G.J. Erasmus and L.R. Baker, 2003. Genetic parameter estimates in Sabi sheep. Livest. Prod. Sci., 79: 17-28.
Direct Link - Rai, A., V. Dubey, K.K. Chaturvedi and P.K. Malhotra, 2008. Design and development of data mart for animal resources. Comput. Electron. Agric., 64: 111-119.
CrossRef - Rutten, M.J.M., P. Bijma, J.A. Woolliams and J.A.M. van Arendonk, 2002. SelAction: Software to predict selection response and rate of inbreeding in livestock breeding programs. J. Heredity, 93: 456-458.
PubMedDirect Link - Sahin, A. and I. Yildirim, 2002. Economic analysis of sheep farms in center district of Van Province. J. Agric. Sci., 12: 47-52.
Direct Link - Takma, C., Y. Akbas and T. Taskin, 2009. Modelling lactation curves of Turkish saanen and bornova goats. Asian J. Anim. Vet. Adv., 4: 122-129.
CrossRef - Shaat, I., S. Galal and H. Mansour, 2004. Genetic trends for lamb weights in flocks of Egyptian Rahmani and Ossimi sheep. Small Ruminant Res., 51: 23-28.
CrossRefDirect Link