
Y. Bozkurt
Department of Animal Science, Faculty of Agriculture, Suleyman Demirel University, 32260, Isparta, Turkey
S. Aktan
Department of Animal Science, Faculty of Agriculture, Suleyman Demirel University, 32260, Isparta, Turkey
S. Ozkaya
Department of Animal Science, Faculty of Agriculture, Suleyman Demirel University, 32260, Isparta, Turkey
Asian Journal of Animal and Veterinary Advances
Year: 2008 | Volume: 3 | Issue: 3 | Page No.: 129-137


ABSTRACT
This study was aimed at predicting carcass weight and some carcass characteristics of slaughtered beef cattle by using digital image analysis system. A total of 55 digital images and carcass measurements were taken, such as Hot Carcass Weight (HCW), Carcass Area (CA), Carcass Length (CL), Carcass Depth (CD) and 29 digital images of Longissimus Muscle Area (LMA) from slaughtered beef cattle. Carcass area was calculated from hot carcass images by digital camera for prediction of carcass weight and CA was found to be the best predictor compared to CL and CD. Linear, quadratic and cubic effects of predictors were also examined and R2 values of CA were 85.9, 86.0 and 91.3%, respectively. Correlation coefficient between HCW and CA gave the highest value of 0.93 among other measurements and found to be statistically significant. At the same time, there were no significant differences between mean values of LMA obtained by digital images and calculated by acetate planimeter. Correlation coefficient was also high (r = 0.93) and significant for these values, R2 value for LMA obtained by digital images was 85.6%. The results showed that the prediction ability of digital image analysis system was very promising to predict HCW. It was also concluded that HCW and LMA can be predicted by digital image analysis system with confidence and flexibility. However, there is a need for further studies under better controlled experimental conditions in order to develop better techniques to use for prediction, taking into account of different breeds of cattle and their size as well.
PDF Abstract XML References Citation
How to cite this article
Y. Bozkurt, S. Aktan and S. Ozkaya, 2008. Digital Image Analysis to Predict Carcass Weight and Some Carcass Characteristics of Beef Cattle. Asian Journal of Animal and Veterinary Advances, 3: 129-137.
DOI: 10.3923/ajava.2008.129.137
URL: https://scialert.net/abstract/?doi=ajava.2008.129.137
DOI: 10.3923/ajava.2008.129.137
URL: https://scialert.net/abstract/?doi=ajava.2008.129.137
INTRODUCTION
Digital image processing has become a familiar, almost routine expression recognised by a large percentage of the general public. Some people have sent it in their work in industrial settings, others in the laboratory and some just through consumer use of personal computer paint and document-processing programs (Baxes, 1994).
Several studies have described different methods that have great potential for industrial applications: ultrasound, video-image analysis, nuclear magnetic resonance, optical probes and bioelectrical impedance. These technologies have been used successfully in laboratories. However, their utilisation in the beef industry is restricted. Only fast, consistent, accurate, non-destructive and reasonable priced methods are of interest to the industry (Swatland, 1995). In fact, video-image analysis has become an useful tool for both yield grade application to beef carcass and accuracy and repeatability of beef carcass longissimus muscle area measurements (Steiner et al., 2003a, b).
Prediction of meat yield has been the major focus of many studies in the developed countries. The value of beef cuts obtained from carcasses of different breeds of cattle is very essential for both consumers and marketing standards which emphasise quality, uniformity and consistency of the meat. Therefore, an evaluation procedure for predicting weights and yields of carcasses and beef retail cuts becomes of great importance for the beef industry (Cross and Belk, 1994).
Digital image analysis has been considered to be one of the most promising methods for objective carcass evaluation (Gardner et al., 1995; Teira et al., 2004). It has also been utilised for determination of colour and fat thickness (Monin, 1998), marbling scores in beef (Albrecht et al., 1996) and water retention capacity in beef (Irie et al., 1996). The use of this technique has been reported to develop an objective system for carcass classification which has been used as a standard of payment to European Union beef producers based mainly on determination of confirmation and slaughtering characteristics (Borggaard et al., 1996). Other studies have reported that image analysis could be used by the beef industry in combination with tenderness classification to accurately characterize beef carcasses for cutability and tenderness (Teira et al., 2004; Steiner et al., 2003a,b).
However, there is no information available about the use of this system on prediction of traits of carcasses and cuts from beef cattle. Therefore, the objective of this study was to predict carcass weight and some carcass characteristics of slaughtered beef cattle by using digital image analysis system.
MATERIALS AND METHODS
Selection and Measurements of Carcasses and Carcass Traits
The carcasses used in this study were from a group of Holstein, Brown Swiss and their crosses slaughtered at a commercial beef packing plant (Burdur Province, Turkey). A total of 55 digital images and carcass measurements were taken such as Hot Carcass Weight (HCW), Carcass Area (CA), Carcass Length (CL), Carcass Depth (CD) and Longissimus Muscle Area (LMA) from different breeds of beef cattle. HCW was taken as carcasses hanging on the rail by a weighing scale with a digital display (kg). Rib eye area or Longissimus Muscle Area (LMA) images were taken twenty-four hours following slaughter after being cut between 11 and 12th ribs over the cross section of the ribbed surface with a camera. Each independent determination of a total of 29 LMA via plastic grid (clear plastic sheet with small dots arranged at the centre of a square 1.56 cm2 in area) was recorded. In addition, independent tracings of each exposed LMA were obtained using acetate paper according to the procedures of Naumann (1951). After completion of data collection, three acetate paper tracings for each LMA were measured using a compensating polar planimeter to determine acetate/planimeter-traced LMA.
Digital Images and Image Analysis
Images were captured using a Canon digital camera MV850i. The camera was set on a standard quality (640x512 pixel resolution). Illumination conditions, location of camera and camera settings were tried to be the same and constant for all samples. Whole carcass images were taken by placing the reference card over each carcass (Fig. 1) and obtaining two sequential but separate images without moving the camera head unit in a fixed position perpendicular to the long axis of the carcass. Images collected by the instrument were obtained while carcasses were in a stationary position on the rail. In digital carcass images, CA was measured from the left side as the area around the whole carcass in cm2; CL was the distance from the point of the shoulders to the ischium (cm); in other words, from the sternum (manubrium) to the aitchbone (tuber ischiadicum); CD, from sternum area immediately caudal to the forelimbs to the top of the thoracic vertebra (cm). In digital LMA images (Fig. 2), LMA was measured as the area around the lean meat excluding the fat cover (cm). Digital images were downloaded from the camera to a computer file and processed using Image Pro Plus 5 software to obtain carcass and LMA measurements from the images. In order to calibrate the software a reference card with a known ruler (20 cm) was positioned next to the object such that the same distance and focus were kept when images were captured.
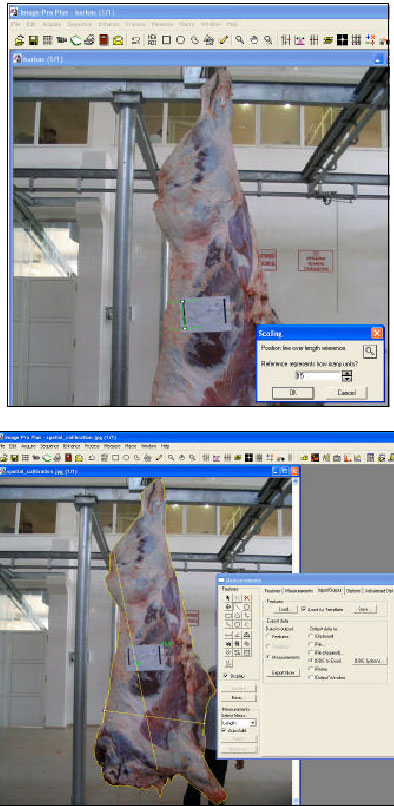 | |
| Fig. 1: | Digital Image of hot carcass together with reference card and processed by Image pro software |
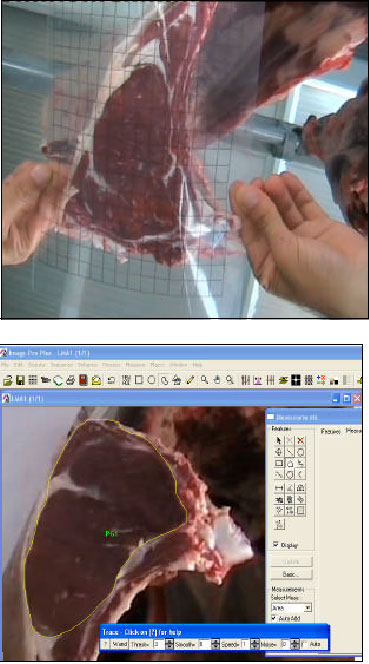 | |
| Fig. 2: | LMA measurements using acetate paper grid and processed by Image pro software |
Statistical Analysis
Regression models were developed and assessed for prediction of Hot Carcass Weight (HCW) and some carcass traits using some carcass measurements as predictors. Descriptive statistics and regression analysis of HCW and LMA on each of the independent variables were performed using the GLM (General Linear Model) procedure of MINITAB, v.13 Inc. (2001). Pearson`s correlation coefficients were calculated between actual and predicted values obtained by image analysis. Linear, quadratic and cubic effects of independent variables on HCW were included in the following model:
| Yi = b0+b1xi+b2xi2+b3xi3+ei |
| where: | ||
| Yi | = | HCW observation of an ith animal |
| b0 | = | intercept |
| b1,b2, b3 | = | corresponding linear, quadratic and cubic regression coefficients |
| xi | = | carcass measurements (CA, CL, CD) |
| ei | = | residual error term. |
The difference between actual and predicted LMAs was examined by Students`t test using the statistical package program MINITAB v.13 for windows. The observed and predicted LMAs were also compared using the Mean-Square Prediction Error (MSPE):
where, n is the number of pairs of observed and predicted values being compared.
I = (1, 2, 3,......, n) |
Oi is the observed LMAs with ith variable.
Pi is the predicted LMAs with ith variable.
The MSPE can be considered as the sum of three components described by Rook et al. (1990).
Where, SO2 and SP2 are the variances of the observed and predicted LMAs, respectively. and are the means of the observed and predicted LMAs, b is the slope of the regression of observed values on predicted and r is the correlation coefficient between O and P.
Apart from common regression analysis, MSPE has been used to determine the prediction ability of regression models and sources of error components in many studies by Smoler et al. (1998), Bozkurt and Ap Dewi, (2001), Yan et al. (2003) and Bozkurt (2006).
RESULTS AND DISCUSSION
The hot carcass and Longismuss muscle area digital images processed by Image Pro Plus 5 software (Fig. 1 and 2).
Descriptive statistics of HCW, CA, CL and CD obtained by image analysis used for prediction of hot carcass weight (Table 1), together with their means, standard errors and coefficient of variations.
The great variability shown by the HCW and CA values were expected on the account of variation of animal`s breed type, weight and size.
Results of multiple regression of hot carcass weight on digital measurements of CA, CL and CD used as predictors for prediction of HCW (Table 2), together with coefficient of determination (R2%).
The highest R2 values (Table 2) were observed from the equation that contained all carcass traits (R2 = 86.4%), the equation that included CA and CL measurements except CD (R2 = 86.3%) and those equations that included CA and CD (R2 = 86.3%), but the equation that included CL and CD gave R2=63.9%. Among the equations that included only one predictor; CA gave the highest R2 = 85.9%, followed by CL and CD, respectively. The lowest R2 value was obtained by CL (R2 = 56.9%). Regression coefficients of CD in all equations were found non-significant except when CD used as single predictor, but still gave a very low R2 value (Table 2).
| Table 1: | Descriptive statistics for hot carcass weight and other carcass measurements obtained by digital images |
 | |
| SE: Standard errors; CV: Coefficient of variation | |
| Table 2: | Multiple Linear regression equations to predict hot carcass weight using CA, CL and CD as predictors# |
 | |
| ns: statistically non-significant (p>0.05); # Only non significant regression coefficients had superscripts (ns), the rest were significant at p<0.05 | |
| Table 3: | Correlation coefficients of variables between HCW and other carcass measurements |
 | |
| Table 4: | Regressions of hot carcass weight on the linear, quadratic and cubic effects of each carcass measurements obtained by digital image analysis# |
 | |
| ns = statistically non-significant (p>0.05); # Only non significant regression coefficients had superscripts (ns), the rest were significant at p<0.05 | |
In contrast to these findings, Cannell et al. (2002) reported that the VIA (video-image analysis) scan system predicted 72% of the variation in adjusted preliminary yield grade. Steiner et al. (2003b) reported that the CVS and VIA scan systems predicted 44 and 76% of the variation in adjusted preliminary yield grade, respectively.
Pearson`s correlation coefficients of variables between HCW and other carcass measurements, CA, CL and CD, obtained by the digital image analysis (Table 3).
All correlation coefficient values were found statistically significant. The highest correlation coefficient value (r = 0.93) was obtained between HCW and CA, followed by CL and CD (r = 0.78 and 0.75), respectively in relation to HCW (Table 3). Therefore, HCW was highly correlated with CA measurements. Results of regressions of hot carcass weight on the linear, quadratic and cubic effects of other carcass measurements obtained by the digital image analysis (Table 4).
The R2 values from the regressions indicate that carcass area was the most highly related to hot carcass weight considering all linear, quadratic and cubic coefficient terms, 85.9, 86 and 91.3%, respectively (Table 4). Quadratic coefficients of all measurements were not significant and although for all measurements addition of cubic terms increased R2 values considerably cubic coefficients of the measurements were very low, almost zero. Therefore, there was a highly linear relation between HCW and other measurements, CA, CL and CD.
| Table 5: | Comparison between actual and predicted LMA values |
| SD: Standard Deviation | |
| Table 6: | Mean Square Prediction Error and Proportions of MSPE (%) |
 | |
| ns = statistically non-significant (p>0.05) | |
In respect to linear equations, it was observed that 1 cm2 change in CA resulted in 0.029 kg change in HCW. Similarly, 1 cm change in CL and CD resulted in 3.38 and approximately 6.5 kg respectively. It was obvious that a 1 cm2 change in CA resulted in lesser hot carcass weight change compared to the rest of carcass measurements.
The acetate/planimeter measurements of LMA of a carcass side obtained by experts and the average of three independent tracings with a compensating polar planimeter were defined as "Aactual" measures of LMA and image-based LMA as "predicted" LMA. Image-based predicted LMA (99.3 cm2) was 0.2% lower than the actual LMA (99.5 cm2).
Coefficient of determination (R2), r and MPE were obtained as 85.6, 0.925 and 77%, respectively (Table 5). Mean bias (predicted minus actual) was negative (0.15 ± 3.28) and the difference between actual and predicted LMA was not statistically significant. There was a highly significant correlation between two values (r= 0.93). In this study, coefficient of determination value (R2 = 85.6) found for LMA prediction is slightly lower than that of values found in some studies as Shackelford et al. (1998) found (R2 = 88). This indicated that LMA of a carcass can be predicted with a high accuracy by digital image analysis.
The accuracy of the equations can be evaluated according to components of Mean Square Prediction Error (MSPE) as a proportion of the mean actual LMA. MSPE and its proportions (Table 6).
The MSPE of the predictions was 74.2 cm2 in this study. In terms of contribution of components to MSPE; the values of bias, line and random error were 0.00, 0.2 and 99.7%, respectively (Table 6). The prediction model had a greater proportion of error derived from random than other components. A small proportion of bias as a component of MSPE showed that the error derived from bias was substantially low and there was a minimal variation between predicted and actual LMAs. The MSPE can be divided into three components due to mean bias (or mean deviation (-) of the prediction), Line bias (or deviation of the slope (b) of the regression of O on P from unity) and the random variation about this regression line. A positive mean bias indicates that the equations are generally overestimating relative to observed values while negative mean bias indicating underestimation. Therefore, there was a minimal underestimation of LMA values obtained by digital image analysis.
In regression equation to predict HCW using image based predicted LMA (HCW = 197+1.33LMA) R2 value was obtained as 19.9% which was similar to the value (R2 = 19%) obtained by Lu and Tan (2004). The correlation between predicted and actual LMA (r = 0.92) was similar to Schutte et al. (1998) r = 0.90; Cannell et al. (2002) r = 0.93; Gardner et al. (1995) r = 0.95 but higher than those of Steiner et al. (2003b) r = 0.83; Lu and Tan (2004) r = 0.60. Determination coefficient obtained in this study (R2 = 85.6%) (Table 5) was slightly lower than those obtained by Shackelford et al. (2003) R2 = 87%; Shackelford et al. (1998) R2 = 88% and Steiner et al. (2003a) R2 = 91%. However, it was higher than those obtained by ultrasound method by Perkins et al. (1992a) r = 0.60; Perkins et al. (1992b) r = 0.82; Greiner et al. (2003) r = 0.86, Suguisawa et al. (2003) r = 0.68; Waldner et al. (1992) r = 0.73; Jorge et al. (2004) r = 0.78. Therefore, LMA can be predicted by using digital image analysis with high accuracy and confidence.
CONCLUSIONS
It can be concluded that CA obtained by digital image analysis as only one parameter can provide a considerably reliable prediction of hot carcass weight. It is unavoidable that some images may not be clear enough for processing due to the lighting conditions inside the plant and improper position of reference cards placed on carcasses can make it difficult to measure correctly especially carcass areas on digital images. Prediction ability of the equations may also be affected by the variation of the slaughtered animal`s breed type and size.
Therefore, hot carcass weights and rib eye area (LMA) can be predicted by the digital analysis system with confidence and flexibility because the acceptable agreement and the close relationship between actual and predicted LMA gives general support to provide predictions of hot carcass weights of the slaughtered animals. However, there is still a need for further investigations for different breeds of cattle, taking in to account of their size as well under better controlled experimental conditions.
REFERENCES
- Borggaard, C., N.T. Madsen and H.H. Thodberg, 1996. In-Line image analysis in the slaughter industry, illustrated by beef carcass classification. Meat Sci., 43: 151-163.
CrossRef - Bozkurt, Y. and I. Ap Dewi, 2001. An evaluation of equations based on metabolizable energy and ARC protein schemes to predict liveweight gain of housed beef cattle. Suranaree J. Sci. Technol., 8: 15-30.
Direct Link - Cannell, R.C., K.E. Belk, J.D. Tatum, J.W. Wise, P.L. Chapman, J.A. Scanga and G.C. Smith, 2002. Online evaluation of a commercial video image analysis system to predict beef carcass red meat yield and for augmenting the assignment of USDA yield grades. J. Anim. Sci., 80: 1195-1201.
Direct Link - Cross, H.R. and K.E. Belk, 1994. Objective measurements of carcass and meat quality. Meat Sci., 36: 191-202.
CrossRef - Greiner, S.P., G.H. Rouse, D.E. Wilson, L.V. Cundiff and T.L. Wheeler, 2003. The relationship between ultrasound measurements and carcass fat thickness and longissimus muscle area in beef cattle. J. Anim. Sci., 81: 676-682.
Direct Link - Irie, M., A. Izumo and S. Mohri, 1996. Rapid method of determining water holding capacity in meat using video image analysis and simple formulae. Meat Sci., 42: 95-102.
CrossRef - Lu, W. and J. Tan, 2004. Analysis of image-based measurements and USDA characteristics as predictors of beef lean yield. Meat Sci., 66: 483-491.
CrossRef - Monin, G., 1998. Recent methods for predicting quality of whole meat. Meat Sci., 49: 231-243.
CrossRef - Perkins, T.L., R.D. Green, K.E. Hamlin, H.H. Shepard and M.F. Miller, 1992. Ultrasonic prediction of carcass merit in beef cattle: Evaluation of technician effects on ultrasonic estimates of carcass fat thickness and Longissimus muscle area. J. Anim. Sci., 70: 2758-2765.
PubMed - Perkins, T.L., R.D. Green and K.E. Hamlin, 1992. Evaluation of ultrasonic estimates of carcass fat thickness and Longissimus muscle area in beef cattle. J. Anim. Sci., 70: 1002-1010.
Direct Link - Rook, A.J., M.S. Dhanoa and M. Gill, 1990. Prediction of the voluntary intake of grass silages by beef cattle. 3. Precision of alternative prediction models. J. Anim. Prod., 50: 455-466.
CrossRef - Smoler, E., A.J. Rook, J.D. Sutton and D.E. Beever, 1998. Prediction of milk protein concentration from elements of the metabolizable protein system. J. Dairy Sci., 81: 1619-1623.
CrossRefPubMedDirect Link - Teira, G.A., E. Tinois, R.A. Lotufo and P.E. Felicio, 2004. Digital image analysis to predict weight and yields of boneless subprimal beef cuts. Scientia Agricola, 60: 403-408.
Direct Link - Waldner, D.N., M.E. Dikeman, R.R. Schalles, W.G. Olson, P.L. Houghton, J.A. Unruh and L.R. Corah, 1992. Validation of real-time ultrasound technology for predicting fat thicknesses, Longissimus muscle areas and composition of Brangus bulls from 4 months to 2 years of age. J. Anim. Sci., 70: 3044-3054.
PubMed