
Abdulrahman G. Alshammari
Department of Chemistry, Al-Imam Muhammad Bin Saud Islamic University, P.O. Box 90950, Riyadh, 11623, Kingdom of Saudi Arabia
Research Journal of Environmental Toxicology
Year: 2015 | Volume: 9 | Issue: 1 | Page No.: 17-33


ABSTRACT
The aim of this study is to investigate the adsorption of cobalt ions on three types of natural Saudi clays. These three natural clays were Tabbuk clay, Khiber clay and Bahaah clay. The effect of pH on the adsorption of cobalt ions was studied. The maximum adsorption capacities of cobalt ions on the three natural Saudi clays increased with increasing the temperature of cobalt solution. The maximum adsorption capacity at 20°C was 4.66 mg g-1 for Khiber clay, 3.94 mg g-1 for Tabbuk clay and 3.44 mg g-1 for Bahhah clay. Whereas, the maximum adsorption capacity of cobalt ions on the three types of natural Saudi clay at 80°C was 5.42 mg g-1 for Khiber clay, 4.22 mg g-1 for Tabbuk clay and 3.82 mg g-1 for Bahhah clay. The enthalpy, Gibbs free energy and entropy for the adsorption of cobalt ions on the three types of natural clays were calculated. It was observed that the adsorption process of cobalt ions on three types of natural Saudi clays was an endothermic process, thus increasing the temperature increased cobalt ions adsorption on all types of natural clays. This indicated that the adsorption process is preferred at high temperatures. The equilibrium adsorption data were correlated using Langmuir, Freundlich and Redlich-Peterson equilibrium models. The experimental data of cobalt ions adsorption on the three types of natural Saudi clays correlated well with Freundlich model.
PDF Abstract XML References Citation
How to cite this article
Abdulrahman G. Alshammari, 2015. Equilibrium Study of Cobalt Ions Adsorption on Three Types of Natural Saudi Clays. Research Journal of Environmental Toxicology, 9: 17-33.
DOI: 10.3923/rjet.2015.17.33
URL: https://scialert.net/abstract/?doi=rjet.2015.17.33
DOI: 10.3923/rjet.2015.17.33
URL: https://scialert.net/abstract/?doi=rjet.2015.17.33
INTRODUCTION
Wastewaters are contaminated with cobalt ions from various sources such as mining operations, electroplating, catalytic processes, ceramic and alloys industries (Brezonik, 1974; Patterson and Passino, 1987; Emsley, 1992). Since cobalt metal is carcinogenic and causes different diseases such as allergies, destroyed liver and inconstancy in living cells (Emsley, 1992; Rengaraj and Moon, 2002). Therefore, many techniques namely chemical precipitation, extraction, reverse osmosis and adsorption are being applied for removing heavy metals such as cobalt from wastewaters.
Adsorption technique is an economical process especially uses low cost adsorbents. Previously, natural clay as a low-cost adsorbent was evaluated for their adsorption properties for heavy metals such as cobalt, lead, cadmium, zinc and chromium ions on different types of clay (Orumwense, 1996; Yadava et al., 1991; Pradas et al., 1994; Singh et al., 1992; Ceylan et al., 2005).
The adsorption of cobalt ions by clays such as Kaolin from Ukraine was carried by Ceylan et al. (2005). The adsorption process depends on the pH of the solution. As pH increases, the amount of adsorption increases from 3 mg g-1 at pH 3 to 8 mg g-1 at pH 9 (Ceylan et al., 2005). Therefore, the effect of pH should be determined before performing the equilibrium experiments because some adsorbents such as clays have a maximum capacity at a specific value of pH (Ceylan et al., 2005; Unuabonah et al., 2007; Potgieter et al., 2006).
In Saudi Arabia, clay is available and is very cheap. Also, no research has been accomplished on Saudi clay with respect to cobalt ion adsorption as a heavy metal. Therefore, the aim of this study is to investigate the feasibility of using three types of local natural Saudi clays for cobalt ions adsorption in a batch adsorber.
MATERIALS AND METHODS
Materials
Characterization of local natural clays as adsorbents: Three types of Saudi natural clays were used as adsorbents. These were collected from different locations. Khiber clay from Khiber city (located in the north-west of Saudi Arabia), Bahhah clay from Bahhah city (located at Asser region in the south of Saudi Arabia) and Tabbuk clay with quartz as major and illite and chlorite as minor from Tabbuk city (north of Saudi Arabia). The chemical analysis of the three Saudi natural clays was carried out by XRF and XRD. The chemical analysis of different clays is presented in Table 1 and Fig. 1a-c.
The surface area and pore characteristics of the three Saudi natural clays were carried out by surface area analyzer as shown in Table 2.
Adsorbate: The adsorbate is the cobalt ion solution prepared from cobalt (II) nitrate purified LR [Co(NO3)2] and supplied by VWR International SAS 201, Rue Camot- F- 94126, Sous bois.
| Table 1: | Chemical analysis of three types of natural clay by XRF (wt%) |
 | |
| Table 2: | Surface area and pore characteristics of three types of natural clay |
 | |
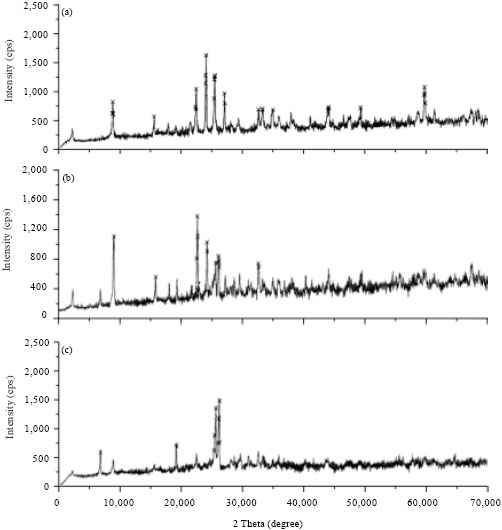 | |
| Fig. 1(a-c): | XRD analysis for (a) Tabbuk, (b) Bahhah and (c) Khiber clay |
Equilibrium experiments: Equilibrium isotherms were determined for the three natural clays (Tabbuk clay, Bahhah clay and Khiber clay). A constant mass of clay (1 g) was placed into 50 mL cobalt ions solution in glass bottles in a constant agitation shaker. In each isotherm run, the cobalt ions solution concentrations ranged from 50-1300 mg L-1. Clay particle size of 0.25 mm was used to determine the isotherms with temperature ranging from 20 to 80°C.
The adsorption process reached to a state of equilibrium after 40 min, therefore, the equilibrium process was run for 3 h to ensure that the adsorption process is in equilibrium. After that, the samples were filtered using filter papers then diluted and absorbance were measured using atomic absorption spectroscopy. Then, the absorbance samples were converted to concentrations immediately using the calibration curve for cobalt ions that were already stored in the atomic absorption spectroscopy. The amount of cobalt ions adsorption on the clay was calculated from the mass balance equation on the batch reactor as follows:
| (1) |
where, m is the clay mass (g), V is the volume of the solution (L), qe is the amount of adsorption (mg g-1), Co is the initial solution concentration of cobalt ions (mg L-1) and Ce is concentration of the cobalt ions at equilibrium (mg L-1). The amount of cobalt ions adsorption on clay versus the cobalt ions concentration was plotted to obtain the equilibrium adsorption isotherm curves.
RESULTS AND DISCUSSION
Equilibrium-time experiments: Equilibrium time was determined by placing a constant mass of clay (1 g) with 50 mL cobalt ions solution in glass bottles in a constant agitation shaker. The Ct/Co versus time was plotted to obtain the equilibrium time of the adsorption process as shown in Fig. 2. Where Ct is the remaining concentration of cobalt ions in the solution and Co is the initial concentration of the cobalt ions in the solution. It was found that a time period of 40 min is sufficient for the cobalt ions/clay solution to reach the state of equilibrium as shown in Fig. 2.
Effect of pH on adsorption of cobalt ions on natural clays: The effect of changing pH from 1.4 to 7.1 by NaOH (0.5 M) which increased the pH value while the HCl (0.5 M) decreased the pH. The adsorption of cobalt ions on three types of natural clay at pH ranging from 1.4 to 7.1 was studied. Because the precipitation of cobalt ions starts at pH between 7.5 and 8 as observed from the experimental preparations. The maximum adsorption of Co ions on three types of natural clay is around pH = 4.51 as shown in Fig. 3.
 | |
| Fig. 2: | Time equilibrium for adsorption of cobalt ions on different types of natural clays |
 | |
| Fig. 3: | Adsorption of cobalt ions on three types of natural clay (pH vs. qe) |
This is according to the electrostatic attraction force between the negative charges on the natural clay and the positive charges on the cobalt ions. Because at low pH, the positive charges increases (Elliott and Huang, 1981) and the adsorption capacity decreases due to the increasing positive charge sites on the clay as shown in Fig. 3.
Cobalt ions adsorption on natural clays: The amount of cobalt ions adsorbed on natural clay versus the cobalt ions equilibrium concentration in the solution was plotted to obtain the equilibrium adsorption isotherm curves for the three types of natural clays (Tabbuk clay, Bahhah clay and Khiber clay) as shown in Fig. 4a-c. Out of the three clays, the maximum capacity of the cobalt ions adsorption was obtained Khiber clay at room temperature (20°C).
It was evident from the results that the cobalt ion adsorption capacity was less on Tabbuk clay and Bahhah clay as compared to Khiber clay. This may be clear from the XRF analysis, where the contents of SiO2 were higher than Tabbuk clay and Bahhah clay. Hence, the number of negative sites formed on the clay is more due to the presence of SiO2 (Elliott and Huang, 1981). Therefore, the adsorption of cobalt ions on the negative sites of clay is the result of the electrostatic attraction between these negative sites and the cobalt ions.
Effect of temperature on adsorption of cobalt ions on natural clays: The effect of temperature on cobalt ions adsorption on three types of natural clays was investigated at different temperatures ranging from 20 to 80°C. Figure 4a-c show that the adsorption capacities of clays increased with increasing the temperature. Therefore, the adsorption process of cobalt ions on three types of natural clays was an endothermic process based on the thermodynamic parameters discussed below. Therefore, increasing the temperature of the system for the adsorption of cobalt ions on three types of natural clays was favorable. Similar findings were reported by Ceylan et al. (2005) who observed increases in adsorption capacity of the adsorbate with increasing the temperature of the system.
Analysis of equilibrium experimental results: Three types of equilibrium isotherm models namely Langmuir, Freundlich and Redlich-Peterson were used in the study. The equilibrium constant parameters were obtained by fitting the equilibrium isotherm models with the equilibrium experimental data by using nonlinear regression method (fminsearch function from MATLAB). Hence, the equilibrium parameters can be used to model the adsorption of cobalt ions by these types of natural clays in a batch and fixed bed adsorbers.
Langmuir isotherm model: The Langmuir isotherm model assumes that a monolayer of cobalt ions is adsorbed on the clay particle and is also used to estimate maximum capacity (Mckay, 1996). The Langmuir isotherm equation is written as follows:
| (2) |
The equilibrium parameters K and b were determined by using the non-linear regression method with Eq. 2.
Figure 5a-d, 6a-d and 7a-d show the non-linear relationship between Ce and qe at a temperature (t) equal to 20, 40, 60 and 80°C.
 | |
| Fig. 4(a-c): | Adsorption of cobalt ions on (a) Khiber, (b) Tabbuk and (c) Bahhah clay at different temperatures |
The equilibrium constants K and b were estimated by non-linear regression method and presented in Table 3. As shown in Fig. 4c, 5a-d, 6a-d and 7a-d, the Langmuir model fits the experimental data apparently well.
| Table 3: | Langmuir equilibrium parameters for the cobalt ions adsorption on three types of natural clay at different temperatures |
 | |
  | |
| Fig. 5(a-d): | Comparison of experimental data and calculated data from isotherm models for Khiber clay at temperature (a) 20°C, (b) 40°C, (c) 60°C and (d) 80°C |
  | |
| Fig. 6(a-d): | Comparison of experimental data and calculated data from isotherm models for Bahhah clay at temperature (a) 20°C, (b) 40°C, (c) 60°C and (d) 80°C |
The dimensionless equilibrium parameter values ![]() were calculated to determine whether the adsorption process of cobalt ions on three types of clay is favorable or unfavorable by using the following equation according to El-Geundi et al. (2005):
were calculated to determine whether the adsorption process of cobalt ions on three types of clay is favorable or unfavorable by using the following equation according to El-Geundi et al. (2005):
| (3) |
where, b is the Langmuir constant and Co is the cobalt ions initial concentration. The dimensionless equilibrium parameter values for cobalt ions adsorbed on the three types of clay were determinedand listed in Table 3.
  | |
| Fig. 7(a-d): | Comparison of experimental data and calculated data from isotherm models for Tabbuk clay at temperature (a) 20°C, (b) 40°C, (c) 60°C and 80°C |
The values of the dimensionless equilibrium parameter were between ![]() .This range indicates that the adsorption process is favorable (El-Geundi et al., 2005). Hence, the adsorption process of cobalt ions on three types of clays is favorable.
.This range indicates that the adsorption process is favorable (El-Geundi et al., 2005). Hence, the adsorption process of cobalt ions on three types of clays is favorable.
Freundlich isotherm model: The Freundlich isotherm model was applied to describe the data from equilibrium adsorption experiments for heterogeneous surface. The Freundlich model is written as follows:
| (4) |
The equilibrium parameters KF and n is calculated by the non-linear regression method with Eq. 4. The value of n is greater than one. Therefore, the adsorption of cobalt ions on the three types of clays is favorable (El-Geundi, 1990).
Figure 5a-d, 6a-d and 7a-d show a non-linear relationship between Ce and qe at different temperatures (t) as 20, 40, 60 and 80°C. The equilibrium constants were estimated by non-linear regression method and are tabulated in Table 4. As shown in Fig.5a-d, 6a-d and 7a-d, the Freundlich model also correlates the experimental data well.
Redlich-Peterson isotherm model: The Redlich-Peterson model overcomes one of the disadvantages of Freundlich model that means that Redlich-Peterson model fits at low concentrations. The Redlich-Peterson model produced identical results when compared to Langmuir equation when β = 1. Also, the Redlich-Peterson model has a heterogeneity parameter (β), hence, it is used to describe the equilibrium data on heterogeneous surface (Mckay, 1996). The Redlich-Peterson model is written in the following form:
| (5) |
where, 0≤β≤1.0.
| Table 4: | Freundlich equilibrium parameters for the cobalt ions adsorption of three types of natural clay at different temperature levels |
 | |
| Table 5: | Redlich-Peterson equilibrium parameters for the cobalt ions adsorption of three types of natural clay at different temperature levels |
 | |
Using the non-linear regression method with Eq. 5, the equilibrium constants KR, aR and β were determined.
Figure 5a-d, 6a-d and 7a-d show the relationship between qe and Ce at different temperatures (t) ranging from 20, 40, 60 and 80°C.
The equilibrium constants were estimated by non-linear regression method and are tabulated in Table 5. The consistency of the experimental data with the non-linear form shows that the Redlich-Peterson isotherm model is applicable to fit the experimental data.
Adsorption process thermodynamics: The increase of the cobalt ions adsorption on three types of natural clay with increasing the temperature from 20 to 80°C can be interpreted from the thermodynamic parameters such as the enthalpy change (ΔH) and standard Gibbs free energy change (ΔG) and entropy change (ΔS).
 | |
| Fig. 8: | Relationship between ln K vs., 1/T |
| Table 6: | Thermodynamic parameters for the cobalt ions adsorption on three types of natural clay at different temperature levels |
 | |
The enthalpy change (ΔH) is calculated using the following equation (Ruixia et al., 2004):
| (6) |
Hence, a plot of ln K versus [1/T] provides the enthalpy change (ΔH) for the adsorption process as shown in Fig. 8. The enthalpy change (ΔH) was determined from the slope of the linear form shown in Fig. 8 and listed in Table 6 for each type of natural clays.
The standard Gibbs free energy change (ΔG) is calculated using Gibbs equation as follows (Ruixia et al., 2004):
| (7) |
where, R is the gas constant, K is the equilibrium constant, T is the absolute temperature and K0 is a constant. The K value is dimensionless and can be calculated according to Namasivayam and Ranganathan (1994) as follows:
| (8) |
Csm is the amount of cobalt ions adsorbed by clay per liter of cobalt ions solution at equilibrium (mg L-1), Cem is the cobalt ions concentration in the solution at equilibrium (mg L-1). The reference states were defined based on amount of cobalt ions adsorption on clay by (mg g-1) and cobalt ions concentration in the solution by (mg L-1).
The entropy change (ΔS) is calculated using Gibbs-Helmholtz equation (Ruixia et al., 2004) as follows:
| (9) |
The positive values of ΔH indicate that the adsorption of cobalt ions on three types of natural clay was an endothermic process. Hence, increasing the temperature increased the cobalt ions adsorption on three types of natural clays.
The values of ΔS and ΔG were calculated by using Eq. 7 and 9, respectively and the results are tabulated in Table 6.
The negative values of ΔS, as shown in Table 6, show that the clay-cobalt ions adsorption process seems to be favorable (Banat et al., 2002).
The positive values of ΔG confirmed that the adsorption of cobalt ions on three types of natural clays was non-spontaneous.
Evaluation of the goodness of the fitting: The theoretical results from different isotherm models (Langmuir, Freundlich and Redlich-Peterson) and experimental results were compared and plotted in Fig.5a-d, 6a-d and 7a-d.
The average absolute relative percentage deviation (AARD%) was calculated to evaluate the goodness of the fitting between the theoretical results from the isotherm models and the experimental results as follows:
 | (10) |
where, N is the number of data points, qicalc the calculated amount of cobalt ions adsorption on the clay and qiexp the experimental amount of cobalt ions adsorption on the clay for a given data point i. In addition, Chi-square method (x2) is applied to evaluate the agreements between the data from the model and the data from equilibrium experiments. The Chi-square (x2) equation is written as follows:
 | (11) |
where, N is the number of data points, qiexp the experimental amount of cobalt ions adsorption on the clay and qicalc the calculated amount of cobalt ions adsorption on the clay for a given data point i. In the case of Chi-square method (x2), the x2 has a small value, the result from the model is close to the result of the equilibrium experiment and vice versa.
| Table 7: | Comparison of (x2) and (AARD%) for Langmuir, Freundlich and Redlich-Peterson models |
 | |
The average absolute relative percentage deviation (AARD%) and the values from Chi-square method (x2) are listed in Table 7 for each type of natural clay.
The average absolute relative percentage deviation (AARD%) and the Chi-square method (x2) along with the Fig. 5a-d, 6a-d and 7a-d showed the best model to correlate the experimental results. However, significant differences between these isotherms were demonstrated. The Freundlich proved the best correlating with the equilibrium data except the experimental data at temperatures 20 and 80°C for Bahhah clay but they were slightly better with Langmuir and Redlich-Peterson models.
CONCLUSION
The adsorption of cobalt ions on three types of Saudi natural clays was investigated. The influence of temperature on the adsorption capacity of the three types of natural clays indicated that the adsorption capacity increased with an increase in the solution temperature. This suggested that the adsorption process is an endothermic process. The Freundlich isotherm agreed most favorably with the experimental data because the average absolute relative percentage deviation (AARD%) and the Chi-square (x2) values for Freundlich were less than Langmuir and Redlich-Peterson models except the experimental data at temperatures 20 and 80°C for Bahhah clay but they were slightly better with the Langmuir and Redlich-Peterson models. Also, the thermodynamic parameters were estimated for the adsorption process of cobalt ions on three types of natural clays. The positive values of ΔH demonstrated that the adsorption process of cobalt ions on three types of natural clay was an endothermic process. Therefore, increasing the temperature enhanced the amount of adsorption of cobalt ions on three types of natural clay. The values of ΔG were positive values for the cobalt ions adsorbed on three types of natural clay. Therefore, the adsorption of cobalt ions on three types of natural clay was non-spontaneous.
NOMENCLATURE
| m | : | Clay mass (g) |
| v | : | Volume of the solution (L) |
| qe | : | Amount of adsorption (mg g-1) |
| Co | : | Initial solution concentration of cobalt ions (mg L-1) |
| Ce | : | Concentration of the cobalt ions at equilibrium (mg L-1) |
| K | : | Equilibrium parameter of Langmuir model (L g-1) |
| b | : | Equilibrium parameter of Langmuir model (L mg-1) |
| : | Dimensionless equilibrium parameter (-) | |
| KF | : | Equilibrium parameter of Freundlich model (L g-1) |
| n | : | Equilibrium parameter of Freundlich model (-) |
| KR | : | Equilibrium parameter of Redlich-Peterson model (L g-1) |
| aR | : | Equilibrium parameter of Redlich-Peterson model (L g-1) |
| R | : | Gas constant (8.314 J/mol K) |
| T | : | Absolute temperature (K) |
GREEK SYMBOLS
β is heterogeneity parameter of Redlich-Peterson model (-)
REFERENCES
- Banat, F., S. Al-Asheh and D. Al-Rousan, 2002. A comparative study of copper and zinc ion adsorption on to activated and non-activated date-pits. Adsorp. Sci. Technol., 20: 319-335.
CrossRefDirect Link - Ceylan, H., T. Sahan, R. Gurkan and S. Kubilay, 2005. Removal of some heavy metal cations from aqueous solution by adsorption onto natural kaolin. Adsorp. Sci. Technol., 23: 519-534.
CrossRefDirect Link - El-Geundi, M.S., T.E. Farrag and H.M. Abd El-Ghany, 2005. Adsorption equilibrium of a herbicide (pendimethalin) onto natural clay. Adsorp. Sci. Technol., 23: 437-453.
Direct Link - Elliott, H.A. and C.P. Huang, 1981. Adsorption characteristics of some Cu (II) complexes on aluminosilicates. Water Res., 15:: 849-855.
CrossRefDirect Link - Namasivayam, C. and K. Ranganathan, 1994. Recycling of waste FE(III)/CR(III) hydroxide for the removal of nickel from wastewater: Adsorption and equilibrium studies. Waste Manage., 14: 709-716.
CrossRefDirect Link - Orumwense, F.F.O., 1996. Removal of lead from water by adsorption on a kaolinitic Clay. J. Chem. Technol. Biotechnol., 65: 363-369.
CrossRefDirect Link - Potgieter, J.H., S.S. Potgieter-Vermaak and P.D. Kalibantong, 2006. Heavy metals removal from solution by palygorskite clay. Miner. Eng., 19: 463-470.
CrossRefDirect Link - Pradas, E.G., M.V. Sanchez and M.S. Viciana, 1994. Adsorption of cadmium and zinc from aqueous solution on natural and activated bentonite. J. Chem. Technol. Biotechnol., 59: 289-295.
CrossRefDirect Link - Rengaraj, S. and S.H. Moon, 2002. Kinetics of adsorption of Co(II) removal from water and wastewater by ion exchange resins. Water Res., 36: 1783-1793.
CrossRefPubMedDirect Link - Ruixia, W., C. Jinlong, C. Lianlong, F. Zheng-Hao, L. Ai-Min and Z. Quanxing, 2004. Study of the adsorption thermodynamics and kinetics of lipoic acid onto three types of resin. Adsorption Sci. Technol., 22: 523-534.
Direct Link - Singh, D.B., D.C. Rupaiward and G. Prasad, 1992. Studies on the removal of Cr(VI) from waste-water by feldspar. J. Chem. Technol. Biotechnol., 53: 127-131.
Direct Link - Unuabonah, E.I., B.I. Olu-Owolabi, K.O. Adebowale and A.E. Ofomaja, 2007. Adsorption of lead and cadmium ions from aqueous solutions by tripolyphosphate-impregnated Kaolinite clay. Colloids Surf. A: Physicochem. Eng. Aspects, 292: 202-211.
CrossRefDirect Link - Yadava, K.P., B.S. Tyagi and V.N. Singh, 1991. Effect of temperature on the removal of lead(II) by adsorption on China clay and wollastonite. J. Chem. Technol. Biotechnol., 51: 47-60.
Direct Link