
Frederick Ato Armah
Department of Environmental Science, School of Biological Sciences, University of Cape Coast, Ghana
Research Journal of Environmental Sciences
Year: 2011 | Volume: 5 | Issue: 7 | Page No.: 643-654


ABSTRACT
This study set out to identify factors that contribute to erosion-induced shoreline changes and determine the rate of shoreline change for Accra, Ghana. Shoreline changes were compared between 1990 and 2010 using aerial photographs and Landsat satellite imagery within Geographic Information System (GIS) environment. The Transect approach was used to delineate the entire shoreline and the length was divided into 435 transects. A spacing of 100 m and a transect length of 3800 m were applied to detect all the changes that have occurred along the shoreline. The Digital Shoreline Analysis System (DSAS) was used to analyze the shoreline in order to determine the End Point Rate and the Linear Regression of Rate of Change. The results revealed that 21847.978 m of the coastal areas were altered during the period with a rate of erosion of 3.0500 m year-1 with Accra Central, Osu and James Town recording the highest level of shoreline erosion. The activities that contribute to the shoreline change aside the challenging natural factors are sand mining, hard and engineered structures on the shore and other commercial and social activities. The occurrences of shoreline erosion have contributed to the degradation of these coastal ecosystems, loss of human settlements and livelihood. From the results, it was estimated that by 2015, the rate of erosion would be about -6.1 m year-1 and by 2020, the rate of erosion would be -30.2 m year-1. It is therefore essential to implement precautionary measures to mitigate the risk of shoreline erosion within this sensitive zone.
PDF Abstract XML References Citation
Received: June 09, 2011;
Accepted: July 02, 2011;
Published: October 27, 2011
How to cite this article
Frederick Ato Armah, 2011. GIS-based Assessment of Short Term Shoreline Changes in the Coastal Erosion-Sensitive Zone of Accra, Ghana. Research Journal of Environmental Sciences, 5: 643-654.
DOI: 10.3923/rjes.2011.643.654
URL: https://scialert.net/abstract/?doi=rjes.2011.643.654
DOI: 10.3923/rjes.2011.643.654
URL: https://scialert.net/abstract/?doi=rjes.2011.643.654
INTRODUCTION
Shoreline changes induced by erosion and accretion are natural processes that take place over a range of time scales. Sometimes, they may occur in response to smaller-scale (short-term) events, such as storms, regular wave action, tides and winds (Fenster et al., 2001; Curran, 2002). They may also arise in response to large-scale (long-term) events such as glaciation or orogenic cycles (Zviely et al., 2009). Over variable time scales, these short and long term events may significantly alter sea levels (rise/fall) and tectonic activities that cause coastal land subsidence or emergence (Frihy and Lotfy, 1994; Lee, 2005; Kovacs, 2000). Hence, most coastlines are naturally dynamic and cycles of erosion are often an important feature of their ecological character (Arekhi, 2008; Daidu et al., 2006; Coopsa et al., 1996). Wind, waves and currents are natural forces that easily move the unconsolidated sand and soils in the coastal area, resulting in rapid changes in the position of the shoreline (Morton et al., 2005; Mazda et al., 2002). Apart from the impact of anthropogenic activity, these processes are simply natural evolutionary phenomena (Moore, 2000; Nouri et al., 2005). Anthropogenic activities along the coast within river catchments and watersheds and offshore contribute to shoreline erosion (Ordu and Demir, 2009; Nouri et al., 2005). Specifically, these include land reclamation, port development, settlement, river damming and diversion, dredging and sand mining. In combination with natural forces the aforementioned human activities often exacerbate coastal erosion in many places (Malini and Rao, 2004; Moller, 2006; Thieler et al., 2009). Eventually, they collectively put at risk opportunities for coasts to fulfil their socio-economic and ecological roles in the long term at a realistic societal cost (Thampanya et al., 2006). Development within coastal areas has stimulated interest in erosion problems (Reddy et al., 2008). Furthermore, it has led to core efforts to deal with coastal erosion problems and to re-establish coastal capacity (Nouri and Jozi, 2002). These efforts are necessary to implement strategies to withstand short and long-term changes induced by anthropogenic activities, extreme events and sea level rise. The erosion problem is exacerbated whenever the remedial actions (i.e., hard or soft structural alternatives) applied, are inappropriate, improperly designed, built, or maintained and if the effects on adjacent shores are not critically evaluated (Kovacs, 2000; Genz et al., 2007). Often erosion is addressed locally at specific places or at regional or jurisdictional boundaries instead of at system boundaries that reflect natural processes (Gopinath and Seralathan, 2005; Appeaning et al., 2008; Xia et al., 1993).
The approach to coastal erosion management in countries such as the Ivory Coast, Ghana, Togo, Benin and Nigeria which are part of the Gulf of Guinea, epitomizes this situation (Dodman et al., 2006). This anomaly could mostly be attributed to insufficient knowledge of coastal processes and the protective function of coastal systems (Armah et al., 2010). The Gulf of Guinea falls in the tropical zone of West and Central Africa, stretching from Guinea to Angola (Dodman et al., 2006). The coastal area is variable, comprising tropical forest, sandy beaches, mangroves, estuaries and coastal lagoons (Dodman et al., 2006). It includes the extensive Niger Delta which holds the largest tract of mangroves in Africa. The area has altered much in the last 100 years, witnessing significant economic development and the growth of major cities including Accra (Dodman et al., 2006).
Coastal erosion in the Gulf of Guinea has been linked to climate change and in turn to rising sea levels and flooding (Appeaning et al., 2008). This study focuses on the Ghana segment of the Gulf of Guinea which is very sensitive to erosion. The body of literature on comprehensively quantified shoreline changes across spatial-temporal scales within the Ghana segment is rather limited (Appeaning et al., 2008). There are myriad techniques for characterising and quantifying shoreline changes (Monprapussorn et al., 2009; El-Nahry and Khashaba, 2006; Dogan, 2007; Ordu and Demir, 2009). However, GIS technology has been recognised as one of the most dominant tools for quantifying shoreline changes over varying temporal and spatial scales (Moore, 2000; Zuzek et al., 2002; Thieler et al., 2009). According Zuzek et al. (2002), Bonyad (2005) and Dhaimat and Dhaisat (2006) prior to the extensive acceptance of GIS technology by coastal scientists, it was difficult to estimate dependable and justifiable shoreline change rates. They further assert that this was partly due to the poor understanding of spatial and temporal influences on shoreline evolution.
The selected area has most of the beaches being sandy with a few patches of rocks along the shoreline and constructed groins in the early years to protect the Forts that are near the shore during the colonial era (pre1957) (Dodman et al., 2006). The selected beaches serve the fishing industry in the capital city of Ghana; the surrounding communities also regularly fetch the beach sand for building and other activities (Dodman et al., 2006).
The aim of this study was to determine the extent to which the Accra shoreline had moved inland due to erosion. Specifically, the study set out to identify the anthropogenic activities that contribute to shoreline erosion at the selected sea shores; determine the rate of shoreline change due to erosion at the selected areas using GIS and determine the severity and impact of the shoreline change on the surrounding communities
MATERIALS AND METHODS
The shoreline of Accra lies from 7°25’0”N 7°13’01”E to 7°28’20”N 7°23’10”E in the Accra Metropolitan Assembly located in the Greater Accra Region of Ghana, West Africa (Appeaning et al., 2008). Some important national infrastructure such as the Kwame Nkrumah Memorial Park, James Fort, The Independence Square, The Baiden Powell Hall and Christianborg (Osu) Castle are located within this zone which is characterized by high erosion rate. The Christianborg (Osu) Castle is the seat of the Ghana Government. The selected area is also very close to the core of urbanisation of the Capital City of Ghana where there is little or no land for resettlement or expansion. These settlements house the indigenous Ga population. A map of the study area is shown in Fig. 1.
Data collection: The coordinates of the selected beaches was taken along the coastline using a Global Positioning System Device. The various activities occurring at these selected areas were observed and informal interviews of residents were conducted.
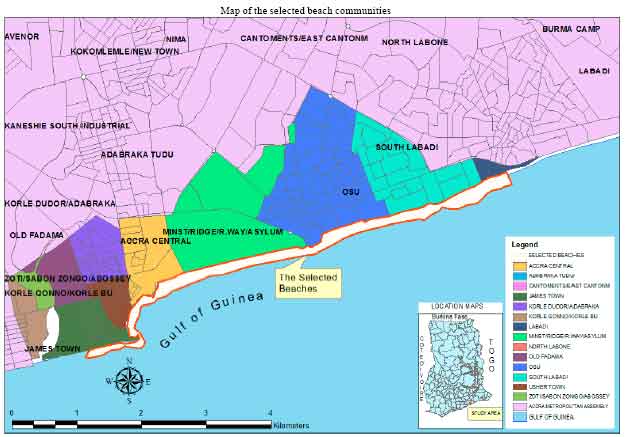 | |
| Fig. 1: | Map of Ghana showing selected communities in the study area |
Some part of the selected areas proximal to the Osu Castle (seat of Government) are restricted areas due to security reasons so data for those areas were generated from other sources. Satellite image analysis is becoming the commonly used method to calculate shoreline change due to the advancing nature of Geographic Information Systems (Liao and Chu, 2009). Satellite images were obtained for March 1990, August 2004 and May 2007. The March 1990 image is an aerial photograph with an uncertainty of 7 m, the entire image was edited to select only the area of interest. The August 2004 image is also an aerial photograph with an uncertainty of 5 m. The May 2007 image is a panchromatic satellite image of Landsat with 2 m uncertainty. All the images selected had a Ghana Metre Grid spatial reference. ERDAS IMAGINE 9.0 was used to rectify the errors that existed on the image such as band correction and selection of the area of interest from the images as they were fairly large images. A satellite image of the selected beaches was obtained for 2010 from Google Earth which served as the current position of the shoreline (Base Map); the image was verified and corrected with the aid of GPS coordinates recorded from the selected beaches with a handheld Global Positioning System (Garmin Etrex).
Data handling, storage and analysis: Microsoft Excel and Statistical Package for the Social Sciences (SPSS version 16) were used to analyse data. The Digital Shoreline Analysis System (DSAS), an extension that enhances the normal functionality of ESRI ArcGIS version 9.3 software was used to calculate shoreline rate-of-change statistics from a time series of multiple shoreline positions. The extension was designed to aid in historical shoreline change analysis. DSAS works by generating orthogonal transects at a user-defined separation and then calculates rates-of-change and associated statistics that are reported in an attribute table. The DSAS tool requires user data to meet specific field requirements:
| • | Sequential time series of vector shoreline positions. The digitized shorelines for respective years stored in a geo-database |
| • | User-created reference baseline. The shoreline uncertainty is incorporated into the calculations for the standard error, correlation coefficient and confidence intervals which are provided for the simple and weighted linear regression methods |
The DSAS Application was used within ArcMap to establish transect locations and calculate change statistics using the workflow (Fig. 3).
Calculations: Shoreline change envelope which refers to the distances between the shoreline farthest from and closest to the baseline at each transect was calculated. The Net Shoreline Movement (NSM) which reports the distance between the oldest and youngest shorelines for each transect was also calculated. This represents the total distance between the oldest and youngest shorelines. If this distance is divided by the number of years elapsed between the two shoreline positions, the result is the End Point Rate. The linear regression rate which is the slope of the line was also calculated. In conjunction with the linear regression rate, the standard error of the Estimate (LSE), the standard error of the slope with user-selected Confidence Interval (LCI) and the R-squared value (LR2) are reported. The total number of shoreline points (n) along the DSAS transect is subtracted by 2 because two of the parameters in the regression line are being estimated (the slope and the intercept). The predicted y-values are subtracted from the known y-values to compute the residuals (y-y').
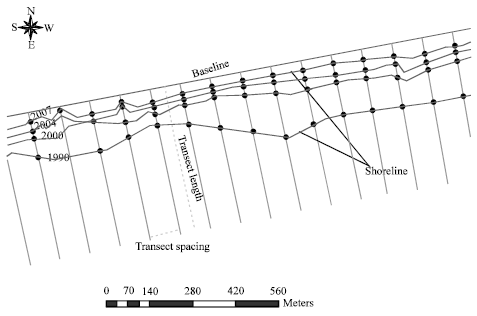 | |
| Fig. 2: | Map showing transects and shorelines for various years |
The residual is squared and then the squared residuals (for each shoreline point) are added (along the DSAS transect) to get the sum of the squares of the residuals (which is the numerator in the equation above). This sum is divided by the number of degrees of freedom and then the square root of the quotient is taken to compute the standard error of the estimate. The standard error of the estimate assesses the accuracy of the best-fit regression line in predicting the position of a shoreline for a given point in time.
RESULTS
Observed anthropogenic activities that contribute to shoreline erosion at the selected sea shores: Commercial sand mining delivery services are available at a fee for people who wish to construct houses near the beaches. There is limited recorded data on the scope and intensity of these sand mining activities. This information gap notwithstanding, it can be seen that most of the people living by the shoreline do not buy sand and gravels for building. This observation was confirmed by residents in the study area. During informal interviews, many respondents posed the rhetorical question “what is the utility of the sea sand if we can’t benefit financially from it?” Occasionally, the beaches take much larger crowds particularly during festive seasons as these areas serve as the venue for holiday making and there is no specific statutory limit on the number of people the beach authorities can allow during these festive seasons. This occasional but high population load contributes to the erosion of the shores during and after the festive season. The beach also serves as a physical training ground for some service men such as the Ghana National Fire Service for physical training. These anthropogenic pressures on the beach contribute to erosion of the shorelines as the beach has a limit regarding the number and scope of human activities it can support without any adverse ecological effect (e.g., loss of ecosystem services and loss of natural functions). The fishermen indicated that their catch has greatly reduced and they currently need to go deeper to make a catch unlike in the past when the shoreline was not as eroded as now. The fishing industry is expected to have a dip in its productivity due to the causes of erosion which is usually due to sand mining and rocky and engineered structures on the shore and the nature of the shoreline (Atta-Mills et al., 2004). The sandy part of the Osu beach is used as a football field by the youth in the area and there is commercial sand mining to build houses and other structures.
The rate of shoreline change due to shore erosion at the selected areas: The results of statistical analysis obtained from the Digital Shoreline Analysis System are shown in Table 1-3. The Least Mean Square, the Linear Regression Rate and the End Point Rate were found to be almost the same that is -12.2987, -12.346805 and -12.2003 m, respectively via erosion. This implies an approximately equal rate of shoreline change for the images used for the study. Table 1 specifically refers to the Least Mean Square, the Linear Regression Rate and the End Point Rate for 435 transects.
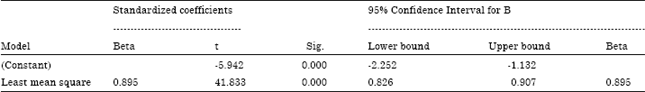
From Table 2, it implies that there are significant differences between the predictors and dependent variable (p<0.05). Table 3 refers to the coefficient of regression. Significant differences were obtained for the constant and the least mean square (p<0.05).
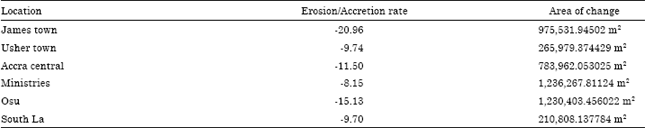
The calculated rate of erosion and the total area that has undergone changes per location are given in Table 4. There were no positive values (accretion) for rate of change indicating that generally for each location there was erosion. The lowest and highest rates of erosion were obtained at the Ministries area (-8.15) and James Town (-20.96), respectively.
| Table 1: | Statistics of shoreline change |
 | |
| A negative (-) sign signifies landward movement or erosion | |
| Table 2: | Analysis of variance (ANOVA) of regression |
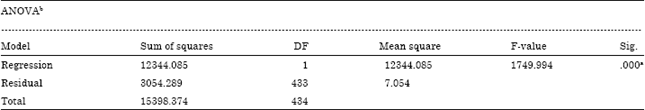 | |
| aPredictors: (Constant), Least mean square. bDependent Variable: Linear regression rate | |
| Table 3: | Coefficients of Regression |
 | |
| Table 4: | Erosion rate and net change for sampling locations |
 | |
| A negative (-) sign signifies landward movement or erosion | |
DISCUSSION
Shoreline changes: A negative (-) sign signifies landward movement or erosion and a positive (+) sign signifies a seaward movement. A Transect-based approach was used to determine the rate and magnitude of shoreline change, the shorelines for a range of 20 years (1990-2010) was divided into 436 transects with a transect length of 3800 m and a transect spacing of 100 m (Fig. 3). The transect approach has been used by several researchers to estimate shoreline change including Appeaning et al. (2008), Frihy and Khafagy (1991), Ghanavati et al. (2008) and Zviely et al. (2009). The End point rate (Fig. 4) was used to determine the mean rates as it places more emphasis on the variation between the shoreline of the various years used and it requires only at least two separate years to be accurate. James Town’s shoreline had end point range of -43.14000 to -18.78000 m with an average erosion rate of -20.96 m per year covering an area of 975531.94502 m2 from 1990-2010 (Table 4). Generally, long-term shoreline change studies present more accurate estimates than short-term analyses.
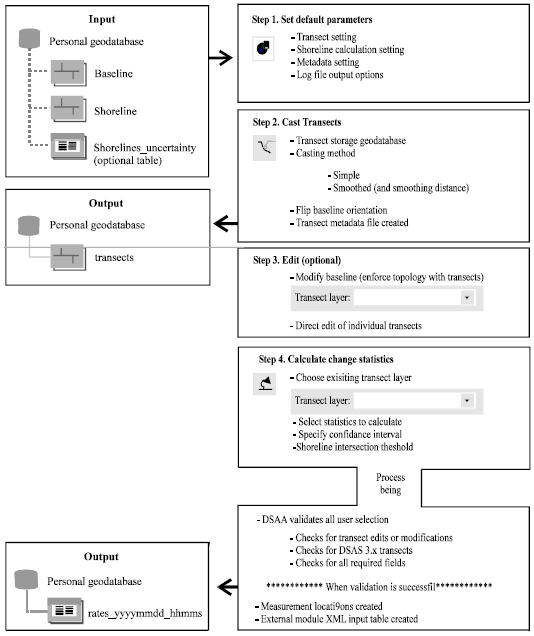 | |
| Fig. 3: | DSAS workflow |
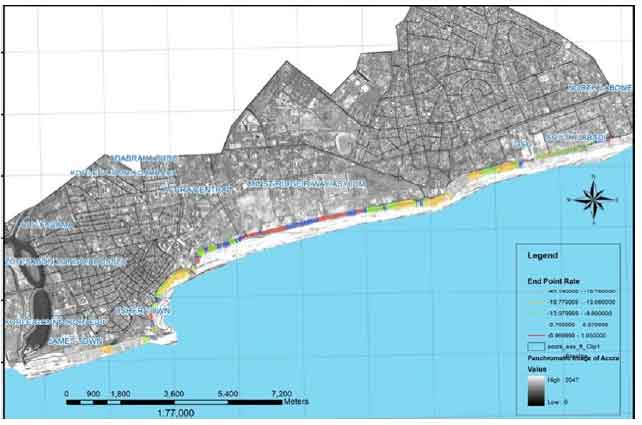 | |
| Fig. 4: | Map of study area showing end point rates for sampling locations |
The findings of Appeaning et al. (2008), Zviely et al. (2009), Ghanavati et al. (2008) and Frihy and Khafagy (1991) were derived from long-term analyses (data spanning several decades to centuries) unlike this study which is short-term (up to two decades). The estimated shoreline change in this work (-3.0500 m year-1) contradicts the estimates (-1.30 m year-1) obtained by Appeaning et al. (2008). The difference in the results could be attributed to the methodology and the duration of the dataset (Genz et al., 2007). The methodology used by Appeaning et al. (2008) is similar to the method used in this work. Consequently, the variability in the results obtained by Appeaning et al. (2008) and this study, could be attributed to the reliance on long term data in the case of the former. However, as in this case, estimations based on short-term data are vital when data is scarce.
The James Town fishing harbour close to the Korle Lagoon serves as the fishing centre for most fishermen in the Accra Metropolis. The shoreline in these areas is a mixture of sand and rocks. There are some sections in the shoreline that are not stable due to the overlap between the sand and rocks. Usher Town which is the closest to James Town had an end point range of -6.96999 to -13.07999 m with an average erosion rate of -9.74 m per year covering an area of 265979.374429 m2 (Table 4). The erosion rate of Usher Town though very close to James Town is very low compared to that of James Town (-20.96 m per year). These results are comparable to the work of Frihy and Khafagy, (1991) who obtained end point ranges between -5 and -28 m for the Nile delta in Egypt. However, the erosion rate is lower than the results obtained by Fenster et al. (2001) who worked on the Hatteras Island, North Carolina, USA. James Town’s shoreline covers an area which is about three times that of Usher Town. This vast change can be associated with the difference in the nature of the two beaches, James Town is purely a sandy beach with no rocky or engineered structures but the beach at Usher Town is partly sandy and partly rocky with large rocks bordering the two beaches. These large rocks cannot be eroded away easily by the waves so the presence of these rocks speed up erosion on the James Town beach as the rocks withstand the waves sending more wave energy towards the direction of the James Town Beach enhancing erosion due to their proximity to each other. According to Appeaning et al. (2008) engineered structures along Ghana’s coastline largely account for the accretion at various locations along the beaches.
The Accra Central Beach is located next to the Usher Town beach and it had an end point range of -6.9699 to -18.77999 m with an average erosion rate of -11.50 m per year covering an area of 783962.053025 m2 (Table 4) for the duration of 20 years (1990-2010). This average erosion is very high compared to the results of Fenster et al. (2001). Comparing the erosion rate and the end point range of Usher Town Beach with Accra Central Beach it was recognized that the former had experienced a fair share of the effect of the rocky nature and structures of the Usher Town beach. The Accra Central beach like the James Town beach is a sandy beach but it has a high cliff after the beach making the effect of future erosion more dangerous. The Ministries Beach has an end point rate of +1.0500 to -9.7999 m. The Ministries beach recorded the least rate of erosion of -8.15 m per year but had the highest area of shoreline change of 1236267.81124 m2 for 1990 to 2010. This could be attributed to the fact that over the years the rate of erosion at the Ministries beach was controlled. Specifically, the beach area was extended by growing vegetation such as grass and coconut trees to reduce the rate of erosion. The purpose for the control may be largely due to its proximity to the Independence Square as there are no housing facilities in that area. The Ministries beach can be considered to have undergone some accretion though this is not significant as there is some degree of erosion occurring. This control method seems to have been successful and has reduced the erosion rate but the land lost to the sea was not reclaimed thus accounting for the lowest erosion rate but the highest area of shoreline change. The Osu Beach had an end point rate of -6.96999 to -43.14000 m with an erosion rate of -15.13 m per year covering an area of 1230403.456022 m2. This erosion rate is higher compared with the results obtained by Fenster et al. (2001) but lower compared to the results obtained by Frihy and Khafagy (1991). The Osu beach has a high erosion rate which can be associated with the old groins that are found close to the Christianborg Castle and partly because of the rocky nature of the beach. There is also a large drain which leads from the Osu Township to the sea through the Osu beach. The South La Beach has an end point rate of +1.0500 to -9.8000 m with an erosion rate of -9.70 m per year covering an area of 210808.137784 m2. Generally looking at the Shoreline Change envelope of the entire study area there are three distinct zones where erosion is rather high namely the beaches of James Town, Accra Central and Osu. These areas can be considered to be at high risk of being washed off if no remedial action is implemented with the next five to ten years considering the current rate of erosion and its contribution to shoreline change. Not much accretion should be expected in these areas due to the practice of sand mining so there is little possibility of nature reversing the trend of shoreline change as there is always a deficit of sediment supply so the sea waves wash away the normal soil and other structures on the beach to balance the sediment deficit. There is substantial evidence of erosion in these areas by way of gullies and the high water level during high tides during some months of the year. There is also the creation of refuse dumps at some parts of the shoreline like Osu and Usher Town where large amounts of refuse is dumped for the sea to transport.
Statistical analyses of shoreline change parameters: When a proportion-proportion plot (determination of whether the distribution of a variable matches a given distribution) was done for the least mean square and linear regression rate, it was found that most of the points were clustered around 0.2 to 0.9 of the observed cumulative probability axis of 0.4 to 0.65 on the expected cumulative probability axis. The values were seen to be approximately evenly distributed around the straight diagonal line making the distribution a normal one. The linear regression showed a constant of -15.011 with a standard deviation of 0.553. The linear line passes through this value and the rate of erosion is proven to be the value that is acquired from the linear regression rate graph. The linear regression rate puts the rate of erosion at -12.34879 m though this is higher than that of the end point rate (Fig. 4). The linear regression rate does not take into consideration the years of the shoreline used but the End point rate considers the change between the shorelines that were used for the analysis and not only the generated data from the Transect analysis.
CONCLUSION
The rate of shoreline erosion is variable along the coastline of the study area during a 20-year from 1990 to 2010. There was accretion at two locations and erosion at four locations. It was estimated that by 2015, the rate of erosion would be about -6.1 m year-1 and by 2020, the rate of erosion would be -30.2 m year-1. The major anthropogenic causes of erosion along this stretch of shoreline were found to be sand mining, the existence of hardened and rocky structures and the nature of the shoreline. These shorelines are critically influenced by climatic conditions and variability, waves, wind and tides.
ACKNOWLEDGMENTS
I wish to thank Elvis Kyere-Gyeabour very much for assisting in data collection and image processing.
REFERENCES
- Appeaning, A.K., M. Walkden and J.P. Mills, 2008. Detection, measurement and prediction of shoreline recession in Accra, Ghana. ISPRS J. Photogrammetry Remote Sensing, 63: 543-558.
Direct Link - Arekhi, S., 2008. Evaluating long-term annual sediment yield estimating potential of GIS interfaced MUSLE Model on two micro-watersheds. Pak. J. Biol. Sci., 11: 270-274.
CrossRefPubMedDirect Link - Armah, F.A., D.O. Yawson, A.N. Pappoe and E.K. Afrifa, 2010. Participation and sustainable management of coastal lagoon ecosystems: The case of the Fosu lagoon in Ghana. Sustainability, 2: 383-399.
CrossRefDirect Link - Atta-Mills, J., J. Adler and U.R. Sumaila, 2004. The decline of a regional fishing nation: the case of Ghana and West Africa. Nat. Resour. Forum, 28: 13-21.
Direct Link - Bonyad, A., 2005. Multitemporal satellite image database classification for land cover inventory and mapping. J. Applied Sci., 5: 834-837.
CrossRefDirect Link - Coopsa, H., N. Geilena, H.J. Verheijb, R. Boetersc and G. van der Velde, 1996. Interaction between waves, bank erosion and emergent vegetation: An experimental study in a wave tank. Aquatic Bot., 53: 187-198.
CrossRef - Dhaimat, O. and S. Dhaisat, 2006. Study of sharp-cut decrease of dead sea. J. Applied Sci., 6: 211-216.
CrossRefDirect Link - Dodman, T., M.D. Diop, J.M. Ikonga and A. Ndiaye, 2006. Priority conservation actions for coastal wetlands of the Gulf of Guinea: Results from an Ecoregional Workshop, Pointe-Noire, Congo, 19-22 April 2005. Wetlands International, Dakar, Senegal. http://www.wetlands.org/LinkClick.aspx?fileticket=wPtSzjZBSeM%3D&tabid=56
- Dogan, H.M., 2007. Climatic portrayal of Tokat province in Turkey: Developing climatic surfaces by using LOCCLIM and GIS. J. Boil. Sci., 7: 1060-1071.
CrossRefDirect Link - El-Nahry, A.H. and H.E. Khashaba, 2006. Land suitability modeling of natural vegetation using integrated remote sensing and GIS techniques: A case study. J. Applied Sci., 6: 51-56.
CrossRefDirect Link - Ghanavati, E., P.Z. Firouzabadi, A.A. Jangi and S. Khosravi, 2008. Monitoring geomorphologic changes using Landsat TM and ETM+ data in the Hendijan River delta, Southwest Iran. Int. J. Remote Sensing, 29: 945-959.
CrossRef - Gopinath, G. and P. Seralathan, 2005. Rapid erosion of the coast of Sagar island, West Bengal, India. Environmental Geol., 48: 1058-1067.
CrossRef - Liao, H.C. and P.T. Chu, 2009. A novel visual tracking approach incorporating global positioning system in a ubiquitous camera environment. Inform. Technol. J., 8: 465-475.
CrossRefDirect Link - Mazda, Y., M. Magi, H. Nanao, M. Kogo, T. Miyagi, N. Kanazawa and D. Kobashi, 2002. Coastal erosion due to long-term human impact on mangrove forests. Wetlands Ecol. Manag., 10: 1-9.
CrossRef - Malini, B.H. and K.N. Rao, 2004. Coastal erosion and habitat loss along the Godavari delta front a fallout of dam construction. Curr. Sci., 87: 1232-1236.
Direct Link - Moller, I., 2006. Quantifying salt marsh vegetation and its effect on wave height dissipation: Results from a UK east coast saltmarsh. Estuarine Coastal Shelf Sci., 69: 337-351.
CrossRef - Monprapussorn, S., D. Thaitakoo, D.J. Watts and R. Banomyong, 2009. Multi criteria decision analysis and geographic information system framework for hazardous waste transport sustainability. J. Applied Sci., 9: 268-277.
CrossRefDirect Link - Morton, R.A., T. Miller and L. Moore, 2005. Historical shoreline changes along the U.S. Gulf of Mexico: A summary of recent shoreline comparisons and analyses. J. Coastal Res., 21: 704-709.
CrossRef - Nouri, J., A. Gharagozlou, A. Nourifard and S.M. Tehrani, 2005. Environmental impact assessment of the largest man made lake of Iran. Pak. J. Biol. Sci., 8: 1672-1677.
CrossRefDirect Link - Nouri, J. and S.A. Jozi, 2002. Evaluation of ecological capability of west and north west of Tehran for ultimate urban development. Pak. J. Biol. Sci., 5: 988-993.
CrossRefDirect Link - Ordu, S. and A. Demir, 2009. Determination of land data of ergene basin (Turkey) by planning geographic information systems. J. Environ. Sci. Technol., 2: 80-87.
CrossRefDirect Link - Reddy, C.S., S. Babar, K. Sudha and V.S. Raju, 2008. Vegetation cover mapping and landscape level disturbance gradient analysis in warangal district, Andhra Pradesh, India using satellite remote sensing and GIS. Space Res. J., 1: 29-38.
CrossRefDirect Link - Thampanya, U., J.E. Vermaat, S. Sinsakul and N. Panapitukkul, 2006. Coastal erosion and mangrove progradation of Southern Thailand. Estuarine, Coastal Shelf Sci., 68: 75-85.
Direct Link - Zuzek, P.J., R.B. Nairn and S.J. Thieme, 2002. Spatial and temporal considerations for calculating shoreline change rates in the Great Lakes basin. J. Coastal Res., NS38: 125-146.
Direct Link - Zviely, D., E. Kit, B. Rosen, E. Galili and M. Klein, 2009. Shoreline migration and beach-near shore sand balance over the last 200 years in Haifa Bay (SE Mediterranean). Haifa Bay, Israel. Geo-Marine Lett., 29: 93-110.
CrossRef