
Lu Zhaogan
Henan University of Economics and Law, Zhengzhou, 450046, China
Wan Jinliang
Henan University of Economics and Law, Zhengzhou, 450046, China
Journal of Software Engineering
Year: 2014 | Volume: 8 | Issue: 3 | Page No.: 219-224


ABSTRACT
In this study, one echo signal simulation platform of radio detectors is constructed to obtain the echo data of the possible targets, which would be used as the test data in their design and test. Based on the MATLAB Simulink, the echo evaluation module is programmed by C++ language and the 3ds Max Model is as the scene model that could be updated according to the new positions of the possible targets, surroundings and radio detector themselves. Furthermore, the VRML display ActiveX control is also used as the dynamic display block. One space scene model is set up with 3ds MAX and used to verify the simulated echo signals which has the consistent characteristic as that with the received test data in fields.
PDF Abstract XML References Citation
Received: October 21, 2013;
Accepted: February 07, 2014;
Published: May 08, 2014
How to cite this article
Lu Zhaogan and Wan Jinliang, 2014. Design and Implementation of the Radio Detector Echo Simulator with Dynamic Scene. Journal of Software Engineering, 8: 219-224.
DOI: 10.3923/jse.2014.219.224
URL: https://scialert.net/abstract/?doi=jse.2014.219.224
DOI: 10.3923/jse.2014.219.224
URL: https://scialert.net/abstract/?doi=jse.2014.219.224
INTRODUCTION
During the design of proximity radio fuzes, a lot of test data must be provided so that the performance and evaluation could be verified. In fact, the working environments and scenarios are constructed and simple entries are used for the possible targets. Then, the radio generator transmits the radio that would be used by the designed radio fuzes and receiver equipment receives the echo radio signal returned back by the possible targets. Obviously, this approach would take a lot of time and money which is not economic in the current advanced computer era. At the same time, the designed fuze radio detector has to be tested or verified in different scenarios which is not all possible constructed by actual objects. Furthermore, the actual constructed scenarios could not be similar to the designed cases and these data from these scenarios could not be fit the designed fuze radio detector. So, how to construct the computer simulation platform of radio fuzes is one alternative approach to avoid these problems.
Here, this study was devoted to one possible simulation method and technology to set up the radio fuze simulation platform which would be very useful to improve the efficiency of radio fuze design teams. Up to now, there are few reports or studys that devoted to the radio fuze simulation platforms. What’s more, only several echo signal simulation methods (Ma, 2005; Tao et al., 2004) of radio fuzes and RADAR were presented by a few studys. The presented echo simulation methods are those based statistic characteristic and their simulated echo signals are not the data of one given targets. These simulation results don’t contain any information of fuze modulation modes and the Doppler frequencies. Aiming to the target model, many researchers (Ren et al., 2006; He, 2008; Chen and Mo, 2010) tried to use mathematics formula to describe the shapes, sizes and movements of the possible targets. However, this approach could not be successful for most actual targets with various complex shapes and movement traces. Therefore, one target is divided into large numbers of scatters and their echo signals are summed up to form its echo signal (Li and Wang, 2005; Xu et al., 2009). The problem is how to do it and it is not given in these reports.
DESIGN AND IMPLEMENTATION OF ECHO SIMULATION PLATFORM
The MATLAB Simulink is used as the simulation platform which function was expanded according to the requirement of echo signal simulation theories. Thus, it keeps the good expansibility, easy realization. In order to realize the cooperation simulation with other simulation tools or EDA software such as OrCAD, HFSS and so on, the echo evaluation module is constructed as one block that could be used as the common block in Simulink. This would make it possible to quickly set up one radio detector simulation system in the MATLAB Simulink environments by the usable blocks.
According to this principle, the echo simulation systems are designed as that shown by Fig. 1, where the time waveform evaluation module is the core in our implementation. The echo signal computation is modeled as one zero-intermediate equivalent signal with high frequncy carrier to be removed and is implemented by C++ Program into one standard block as that in MATLAB Simulink. The trace or movement parameters of active object and radio detectors are input into the block as the predefined formats. Meanwhile, the 3ds Max 2010 scene model data file would be provided to both the block and the VRML display. When the objects and radio detectors change their positions according to the setting of movement parameters and traces, their new position would also be updated in time in the VRML display. For one simulation time point, the echo signal is computed according to the transmission power, relative positions in the scenes and given as the output signal of the block.
Obviously, the time waveform simulation block is one with dynamic simulation information and it should make initial settings for the parameters of antenna, i.e., gain, input resistance, carrier frequency, sample frequency and so on. For the simulation time point, the positions of targets, surroundings and radio detectors, should be synchronously updated quickly in the scene data and the VRML display module. Furthermore, the transform matrix for the space coordinate systems would also be re-set accordingly. Thus, the new echo signal could be computed according to their new positions.
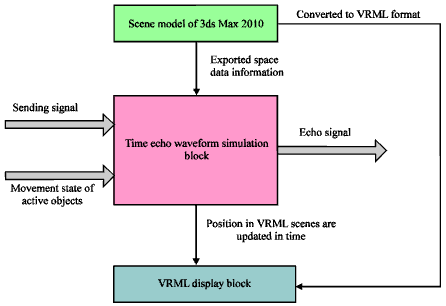 | |
| Fig. 1: | Implement of waveform simulation for radio detector |
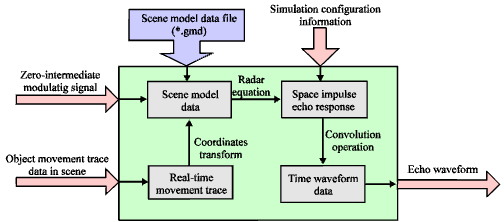 | |
| Fig. 2: | Simulation model with zero-intermediate equality signal model |
The implementation procedure would be also realized according to the scheme as shown by Fig. 2.
Assumed that the movement speed of one radio detector is vmax, the relative positions for all the objects in the scene could be considered as unchanged and the sample frequency fin of object sampling position is presented as Eq. 1:
| (1) |
Here, Δl is the change of relative distance between the radio detector and one possible target.
In order to separate the different objects according to the received echo signal by the detector, the sample frequency of the output echo signal, should also be given as the following description. If Δd is denoted as the detecting depth, the trip back time ![]() for the detecting depth is given by:
for the detecting depth is given by:
| (2) |
So, the sample frequency fout for the output of echo simulation module is presented as:
| (3) |
If one only wants to observe the differential signal without separating the objects in different depth, the sample frequency for the output echo signal is determined by the possible maximal Doppler frequency:
| (4) |
SIMULATION RESULTS
With the use of 3ds MAX 2010 as the professional scene model tools, we constructed one scene with two simple objects, i.e., F15e aircraft and one Missile with radio detector. The F15e aircraft model is the existing model that could be found in the Internet, while the Missile is set up by us in the 3ds Max 2010. As there are only two objects, the speeds of the F15 aircraft and Missile are set to 680 and 800 m sec-1, respectively. When they move in the face to face direction, the maximal possible movement speed is 1480 m sec-1. Furthermore, if the relative distance difference of 0.01 m, their position in the space scene would be considered static and the input sample frequency could be set to 148 kHz according to the Eq. 2. Meanwhile, if the distance distinguishing accuracy of radio detector is 1 m, the output sample frequency of the echo simulation block is given as 150 MHz. With the consideration of the missile working frequency 3.5 GHz, the output sample frequency is 170 kHz according to Eq. 4.
However, when the initial distance between the F15e and the missile is about 4667 m, they would meet each other after about 4 sec. Furthermore, there are about 9751 scatters in the space scene, i.e., triangle patches and this scale would lead to the long time to finish the total simulation progress.
Here, in order to observe the time waveform, the input sample frequency is given as about 1 kHz with shelter angle 0.00175. At the same time, the propagation speed of electromagnetic wave in atmosphere circumstance is given as the light speed, i.e., 3x10⁸ m sec-1, while the minimal detecting power is -50 dBm and the simulation time is 4 sec. The total simulation system was constructed according to the blocks in MATLAB Simulink.
The traces or movement parameters are provided to the echo simulation block by the F15e trace block and the Missile trace block, respectively. Furthermore, the modulating phase and frequency signals are set to zero, while the magnitude signal is set to constant. Thus, the zero-intermediate modulating signal that would modulate the carrier is constructed in the form of Dec_Signal Block and the Gain block is used to set the transmission power from the sending antenna.
The dynamic scene display window is disclosed by Fig. 3 which is actually one VRML display control and used in MATLAB Simulink as one common block. When the antenna gain of the radio detector is given as that with ellipse shape (Fig. 4), the final output signal with 1 kHz sample frequency is displayed in the form of waveform as Fig. 5 showed.
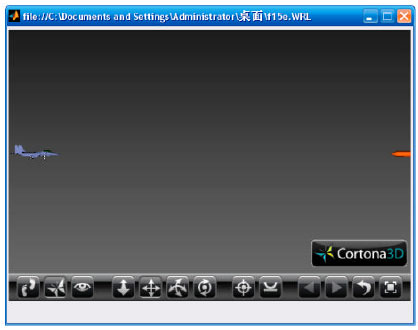 | |
| Fig. 3: | Display windows with dynamic scene |
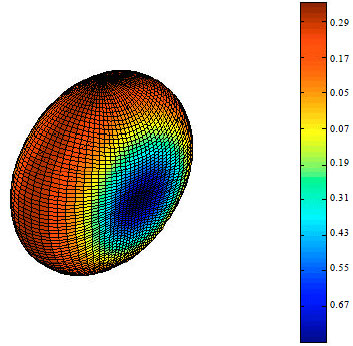 | |
| Fig. 4: | Antenna gain with ellipse shape used by radio detector |
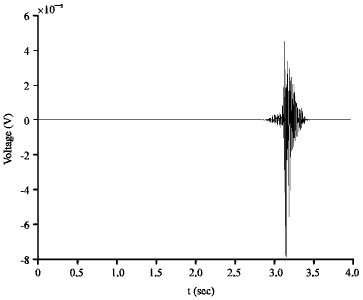 | |
| Fig. 5: | Waveform with output sample frequency 1 kHz |
As the output sample frequency is equal to that of input sample signal which is not high enough to obtain the waveform when they meet and depart. When we improved the output sample frequency as ten multiple that of input sample frequency, the corresponding waveform could disclose the process and the result is given by Fig. 6.
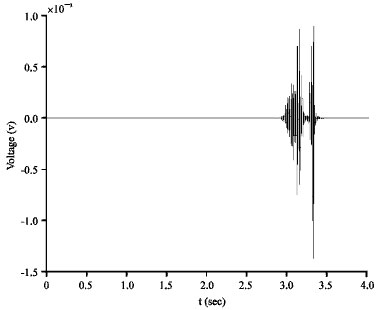 | |
| Fig. 6: | Waveform with output sample frequency 10 kHz |
CONCLUSION
In this report, one echo signal simulation platform with dynamic scenes was described for the radio detector. As one general simulation system, it could be configured according to the simulated radio detector and cooperation with the EDA tools such as OrCAD, HFSS and circuit design software. The simulated echo signal that simulated by the platform with one aircraft working scene, verified that it is useful to the design and test of radio detector.
ACKNOWLEDGMENTS
This study is supported by the Henan Basic and Advanced Technology Research Program (122300410380), the Key Research Project of Science and Technology by Henan Ministry of Education (12A510001).
REFERENCES
- Ma, A.Y., 2005. Echo simulator of frequency modulation radio fuze. Guidance Fuze, 26: 16-19.
Direct Link - Tao, H., M.H. Xue and J. Wang, 2004. The research of the radio fuze radio frequency simulation. Guidance Fuze, 25: 18-21.
CrossRef - Ren, H.M., Z.H. Xiao and X.F. Yuan, 2006. Simulation of the moving targets in the complex background. Syst. Eng. Electron., 28: 336-338, 398.
Direct Link - Chen, Q.J. and C.Q. Mo, 2010. The credibility analysis for recognition-oriented radar target echo simulation. Radar Sci. Technol., 8: 54-59.
CrossRef - Li, J. and Q.W. Wang, 2005. Research and technology for SAR echos simulation. Comput. Simul., 22: 268-270.
CrossRef - Xu, L., S. Yuan, K. Li and W. Jiang, 2009. Simulation of motion modeling and wideband radar echo of non-rigid target. Mod. Electron. Tech., 23: 8-10.
Direct Link