
A. G. Pillay
Department of Biomedical
Sciences,
Faculty of Medicine and
Health Sciences, University Putra Malaysia 43400 1-JPM, Serdang, Selangor, Malaysia
Journal of Medical Sciences
Year: 2001 | Volume: 1 | Issue: 4 | Page No.: 228-234


ABSTRACT
This investigation is an attempt to provide a chronological account of the ontogeny and significance of changing pattern of the neuronal elements in the vagal (nodose) and vestibular ganglia of the chick. Two types of morphologically different neuron-types (dark and light ones) are observed. The dark cells are considered to be active ones, while the light-cells are effete cells, i.e., inactive, dying, dead or degenerating ones which have failed to establish or lost their functional connections. Since the small and medium sized cells are the youngest stages in which the light cells make their first appearance, it is assumed that the establishment of functional connections might begin around the very-small and small cell stage during embryonic development. The appearance of light cells among the very-small ones just on the day of hatching possibly signifies their attempt to eliminate the growing cells since they are no longer needed to replace larger categories of cells which have already well-developed neuronal connections by the day of hatching. In the vagal ganglion is the occurrence of large number of light-cells on E6 from this behavior, it is assumed that the vagus nerve establishes the earliest functional connections (around E6 or even earlier) in view of its vital functions involved in maintaining the life of animal during development because of its connections with vital organs concerned with alimentary, respiratory and cardiac functions. In the vestibular ganglion, the appearance of a few light cells on E6 might indicate the beginning of an early establishment of functional connections in contrast to most other ganglia studied. It is possible that proper maintenance of vestibular function in order to keep the different organs (such as heart, lung, liver, intestine, brain etc) in their most suitable position during early stages of development in relation to the gravitational force, is possibly an important factor for proper development and growth of every organ and system of the body, and to the life of the individual at large.
PDF Abstract XML References Citation
How to cite this article
A. G. Pillay, 2001. Vagal and Vestibular Ganglia as Vital Neural-Centers During Development. Journal of Medical Sciences, 1: 228-234.
DOI: 10.3923/jms.2001.228.234
URL: https://scialert.net/abstract/?doi=jms.2001.228.234
DOI: 10.3923/jms.2001.228.234
URL: https://scialert.net/abstract/?doi=jms.2001.228.234
INTRODUCTION
Mechanisms involved in the neuro-degeneration form part of the structural framework for interpreting the functional consequences of age-related neuron-loss. However, this gives confusing and sometimes contradicting data (Dlugos and Pentney, 1994; West, 1993). Distinction of dark and light neurons, based on staining properties has been documented in vertebrates (Kozhura et al., 1994). The significance of these two populations of neurons has been the subject of considerable speculations. Dual embryonic origin of epidermal placode and of neural crest origin (Hamburger, 1961), as fixation artefacts (Cammermeyer, 1962), different sensory functions (Spassova, 1982; Shinder and Devor, 1994), different histogenetic characteristics (Meyer et al., 1973), difference in distribution of cytoplasmic organelles and relative density of cytoplasm (Carmel and Stein, 1969; Matsura et al., 1969), fluid-shift between cells and the surrounding extracellular spaces (Moses, 1967), difference in chemical constituents (Peach, 1972; Silbermann and Finkelbrand, 1978) etc have been offered as different hypotheses.
All these works have been performed either in adult animals or in certain stages of development or growth, and with broken scientific information. Therefore, it is thought useful to investigate this subject matter in the cranial nerve ganglia including the vagal and vestibular ganglia through the whole life of the chick so as to form a conclusive significance and comprehensive hypothesis concerning the occurrence of these two types of neurons. It is expected that this study would form a basis on which further clinically oriented investigations will follow. An investigation concerning the brain-stem nuclei of the vagal and vestibular nerves is also planned, as a part of a continuous research program.
MATERIALS AND METHODS
The chicks gallus domestics, White Leghorn breed were used. Fertilised eggs were incubated at 37.5°C, after every 24 hours, it was considered as Embryonic Day 1 (E1), Embryonic Day 2 (E2) etc. till hatching (H). Embryos till H were removed carefully under ether anaesthesia, aseptic conditions and fixed in 10% formaldehyde (HCHO) solution at least for two weeks. Larger (older) embryos were cut transversely into suitable smaller pieces and labelled serially for future orientation. The tissues of older embryos (i.e., E15 and onwards till adult) were usually decalcified after fixation. Serial sections of 8 - 10μ were taken and stained by Cresyl Fast Violet for Nissl granules. Only a few selected stages that showed some remarkable changes i.e. E6, E8, E10, E13, E15, E18, chicks on the day of H and adult (A) are included in this work. In all, three animals in each group, with a total of twenty-four animals were used. Ganglia of both sides were used for examination. Every section of the ganglion was examined, drawn and the cells were plotted in diagram with the help of a light microscope having a camera lucida attachment. Different categories of neurons were classified into Dark and Light neurons according to the difference in the intensity of cytoplasmic stain (Pillay, 1999a). Only those cells having a clear nucleus and a nucleolus were counted and measured with the help of an eyepiece graticule. The following categories of cells were classified:
Tiny (< 5μ), very small (6 - 10μ), small (11 - 15μ), medium sized (16 - 20μ), big (21 - 25μ), very big (26 - 30μ), large (31 - 35μ), very large (36 - 40μ), giant (41 - 45μ) (Pillay, 1999a). The categorization of cells on the basis of size with uniform difference of 5μ was initially maintained just for the sake of convenience. However, this proved to be very useful in that, the behaviour, especially that of the very-small cells, is very interesting on the day of H (uniformly) in all the ganglia studied. This explains that this particular stage of cellular-growth (very-small cell stage) is a critical period during development, indicating a stage of active cell-process-formation (axon-formation), beginning to establish functional connections with the target tissues.
Results
When the dark cells alone are present in the ganglion, they are represented just by their numbers; but, when they are mixed with light cells, D= dark cells, and L= light cells (Fig. 1). The most striking changes are as follows. Population density (P. D = in mm3) for certain types of cells is given in parenthesis.
Vagal Ganglion: The vagal (nodose) ganglion could be recognized on E6 while it had a rostro-caudal length of 0.496 mm, a volume of 0.0127 mm3 and contained 10740 cells. Among these cells, 9225 (85.89%) were dark type and 1515 (14.11%) were light ones. In all, 161 (1.5%) were tiny cells, 2488 (23.17%) were very small ones, 4545 (D= 3731+ L= 814) (42.32%) were small ones and 3546 (D= 2845 + L= 701) (33.02%) were medium sized ones. On E8, the ganglion had a length of 0.536 mm, a volume (v) of 0.0251 mm3 and had 17167 cells. Among these cells, 16958 (98.78%) were dark type and 209 (1.22%) were light ones. In all, 116 (0.68%) were tiny cells, 6425 (37.43%) were very small ones, 6729 (D= 6645 + L= 84) (39.2%) were small cells, 3735 (D= 3627 + L= 108) (21.76%) were medium sized ones and 162 (D= 145 + L= 17) (0.92%) were big ones. On E10, the ganglion had a length of 0.603 mm, a volume (V) of 0.0484 mm3 and had 16181 cells. Among these cells, 16014 (98.97%) were dark type and 167 (1.03%) were light ones. In all, 135 (0.83%) were tiny cells, 4774 (29.5 %) were very-small ones, 7626 (D= 7584 + L= 42) (47.13%) were small ones, 2370 (D= 2300 + L= 70) (14.65 %) were medium sized ones, 1226 (D= 1178 + L= 48) (7.58%) were big ones and 50 (D= 43 + L= 7) (0.31%) were very big ones. On E13, the ganglion had a length of 0.630 mm, a V of 0.0474 mm3 and contained 8972 cells. Among these cells, 6613 (73.71%) were dark type and 2359 (26.29%) were light ones. In all, 94 (1.05%) were tiny cells, 3812 (42.49%) were very-small ones, 2504 (D= 1645 + L= 859) (27.91%) were small ones, 1656 (D= 714 + L= 942) (18.46%) were medium sized, 587 (D= 229 + L= 358) (6.54%) were big ones, 271 (D= 99 + L= 172) (3.02 %) were very-big ones and 48 (D= 20 + L= 28) (0.53 %) were large ones. On E15, the ganglion had a length of 0.740 mm, a V of 0.0870 mm3 and had 46803 cells. Among these cells, 44857 (95.84%) cells were dark type and 1946 (4.16%) were light ones. In all, 979 (2.09%) were tiny cells, 35572 (76%) were very-small ones, 4964 (D= 4388 + L= 576) (10.39%) were small ones, 5027 (D= 3769 + L= 1258) (10.74%) were medium sized ones, 204 (D= 128 + L= 76) (0.44%) were big ones, 43 (D= 14 + L= 29) (0.09%) were very big ones and 14 (D= 7 + L= 7) (0.03%) were large ones. On E18, the ganglion had a length of 0.790 mm, a volume of 0.1071 mm3 and had 80720 cells. Among these cells, 79253 (98.18%) were dark type and 1467 (1.82%) were light ones. In all, 30278 (37.51%) were tiny cells, 25074 (31.06%) were very-small ones, 16309 (D= 15800 + L= 509) (20.2%) were small ones, 6921 (D= 6154 + L= 767) (8.57%) were medium-sized ones, 1778 (D= 1594 + L= 184) (2.2%) were big ones, 322 (D= 315 + L= 7) (0.4 %) were very-big ones and 38 (0.05%) were large ones. On the day of H, the ganglion had a length of 1.350 mm, a V of 0.1368 mm3 and had 11464 cells. Among these cells, 7808 (68.11%) were dark type and 3656 (31.89%) were light ones. In all, 66 (0.58%) were tiny cells, 351 (D= 259 + L= 92) (3.06%) were very-small ones, 1855 (D= 908 + L= 947) (16.18%) were small ones, 4253 (D= 2709 + L= 1544) (37.1%) were medium-sized ones, 2574 (D= 1654 + L= 920) (22.45%) were big ones, 2053 (D= 1903 + L= 150) (17.91%) were very-big ones and 312 (D= 309 + L= 3) (2.8 %) were large ones.
Vestibular Ganglion: The vestibular ganglion could be recognized on E6 while it had a rostro-caudal length of 0.304 mm and a V of 0.0094 mm3. The ganglion had 32924 cells (P. D= 3502553). Among these cells, 32916 (99.98 %) were dark type (P. D= 3501702) and 8 (0.02%) were light ones (P. D= 851). In all, there were 2220 (6.74%) tiny cells (P. D= 236170), 14803 (44.96%) very small ones (P. D= 1574787), 15197 (46.16%) small ones (greatest P. D= 1616702) and 704 (2.14%) medium sized ones (P. D= 74893). On E8, the ganglion had a length of 0.480 mm and a V of 0.0240 mm3, and contained 42695 cells (P. D= 1778958), and all of these cells were dark type. In all, there were 874 (2.05%) tiny cells (P. D= 36417), 30870 (72.3%) very small ones (greatest P. D= 1286250), 10750 (25.18%) small ones (P. D= 447917) and 201 (0.47%) medium sized ones (P. D= 8375). On E10, the ganglion had a length of 0.963 mm, a V of 0.0442 mm3 and 61936 cells (P. D= 1401267) and all of these cells were dark type. In all, there were 10268 (16.58%) tiny cells (P. D= 232308), 40467 (65.34%) very small ones (greatest P. D= 915543), 9418 (15.21%) small ones (P. D= 213077) and 1783 (2.88%) medium sized ones. On E13, the ganglion had a length of 1.020 mm, a V of 0.1232 mm3 and 43894 cells (P. D= 356282). Among these cells, 40267 (91.74%) were dark type (P. D= 326842) and 3627 (8.26%) were light ones (P. D= 29440). In all, there were 2674 (6.09%) tiny cells (P. D= 21705), 27480 (62.61%) very small ones (highest P. D= 223052), 9251 (D= 6818 + L= 2433) (21.08 %) small ones (P. D= 75089), 3655 (D= 2665 + L= 990) (8.33%) medium sized ones (P. D= 29667), 763 (D= 583 + L= 180) (1.74%) big ones (P. D= 6193) and 71 (D= 47 + L= 24) (0.16%) very big ones (P. D= 576). On E15, the ganglion had a length of 0.940 mm, a V of 0.0770 mm3 and 53439 cells (P. D= 694013). Among these cells, 47465 (88.82%) were dark type (P. D= 616429) and 5974 (11.18%) were light ones (P. D= 77584). In all, there were 3449 (6.45%) tiny cells (P. D= 44792), 31886 (59.67%) very small ones (highest P. D= 414104), 10090 (D= 7501 + L= 2589) (18.88%) small ones (P. D= 131039), 5654 (D= 3195 + L= 2459) (10.58%) medium sized ones (P. D= 73429), 1609 (D= 953 + L= 656) (3.01 %) big ones (P. D= 20896), and 751 (D= 481 + L= 270) (1.41%) very big ones (P. D= 9753).
| Table 1: | Illustrates the total number of dark and light cells in the vagal ganglion in different age groups of animals in the ontogeny of the chick |
 | |
| D = Dark cells, L = Light cells, E = Embryonic day, H = Day of hatching, A = Adult | |
| Table 2: | Illustrates the total number of dark and light cells in the vestibular ganglion in different age groups of animals in the ontogeny of the chick |
 | |
| D = Dark cells, L = Light cells, E = Embryonic age, H = Day of hatching, A = Adult | |
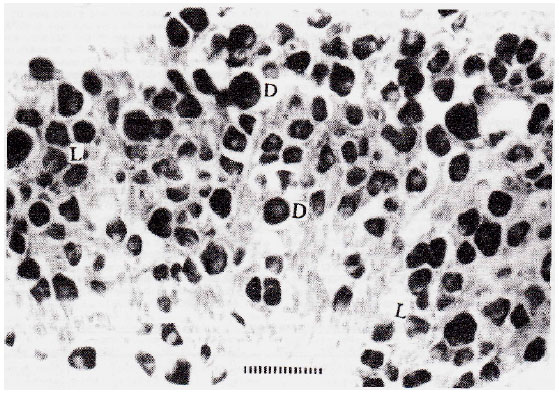 | |
| Fig. 1: | Shows Dark (D and Light (L) cells observed in Ganglion. Different size-categories of cells are also seen. Each division of the scale-bar is equal to 10μ. |
On E18, the ganglion had a length of 1.230 mm, a V of 0.3874 mm3 and 237191 cells (P. D= 612264). Among these cells, 234877 (99.02%) were dark type (P. D= 606291) and 2314 (0.98%) were light ones (P. D= 5973). In all, there were 91241 (38.47%) tiny cells (P. D= 235521), 100958 (42.56%) very small type (highest P. D= 260604), 32555 (D= 31988 + L= 567) (13.73%) small ones (P. D= 84035), 10248 (D= 8981 + L= 1267) (4.32%) medium sized ones (P. D= 26453), 1827 (D= 1491 + L= 336) (0.77%) big ones (P. D= 4716) and 362 (D= 218 + L= 144) (0.15 %) very big ones (P. D= 935).
On the day of H, the ganglion had a length of 1.200 mm, a V of 0.2079 mm3 and 18067 cells (P. D= 86902). Among these cells, 4871 (26.96%) were dark type (P. D= 23429) and 13196 (73.04%) were light ones (P. D= 63473). In all, there were 105 (0.58 %) tiny cells (P. D= 505), 4179 (D= 428 + L= 3751) (23.13%) very small type (P. D= 20101), 4987 (D= 924 + L= 4063) (27.6%) small ones (P. D= 23987), 6640 (D= 2178 + L= 4462) (36.75%) medium sized (highest P. D= 31938), 1531 (D = 693 + L= 838) (8.47%) big (P. D= 7364), 498 (D= 425 + L= 73) (2.76%) very big ones (P. D= 2395) and 127 (D= 118 +L= 9) (0.7%) large ones (P. D= 611) (Table 1, 2).
Discussion
Vagal Ganglion: In the vagal (nodose) ganglion, two types of cells, the dark and the light neurones are found dispersed at random throughout the ganglion as from E6 through the whole life till adult hood. Unlike the observation of other investigators (Finkelbrand and Silbermann, 1978; Noden, 1978) who found such random distribution only in mature ganglia (i.e., as from 18th day of incubation to A), i.e., from the stage shortly before H to A and not in the early stages of development where there is a definite segregation of small and large neurons. The tiny cells and very small cells are always found to be dark. The very-small cells are also dark through the whole embryonic period till E18. Later, the light cells have appeared among the very small cells on the day of hatching. However, the light cells in this category have disappeared in the A situation. This behaviour of very-small cells might imply that even though these cells appear to keep themselves to be an active group before the day of H and be ready to replace the unsuccessful neuronal elements, death and degeneration begin among these cells also as from the day of H. It is assumed that normally there cannot be any more necessity for the establishment of new (or additional) functional projection after the day of H because all of these connections might have been already complete by this time (while the animal is ready to lead an independent living). Therefore, cell-death begins even among these very-small type as from the day of H in order to prevent further growth and maturation of these cells that seem unnecessary. It has been observed that the important function of cell-death during development is to regulate the number of neurons to the requirements of the target-fields (Davies and Lumsden, 1990). Experimental manipulation of target-field size (Oppenheim, 1981) and disruption of target-field innervation (Yip and Johnston, 1984) have demonstrated this. This is in agreement with the concept that both peripheral and central target-fields of sensory neurons play a role in regulating neuronal number.
The nodose ganglion is peculiar to contain the light-cells as early as E6 that continue through the whole ontogeny. However, their number, proportion and density vary greatly within different parts of the ganglion and through different age groups of animals. It is assumed that the early appearance of light cells on E6 might indicate that the establishment of connections (development and growth of axonal processes) begins as early as E6 (or even before), as evidenced by the occurrence of light cells in the ganglion, unlike many other ganglia studied in this investigation. This is based on the suggestion (Hamburger and Narayanan, 1969) that by the 8th day of incubation at least some of the trigeminal ganglion cells have established peripheral and central connections as indicated by the presence of reflexogenic responses to tactile stimulus of the beak. It has also been found (Noden, 1980) that many trigeminal sensory cells have extensive peripheral projections by the end of the first week of incubation. Also it is during this period (E8) in the trigeminal ganglion that the light cells have made their first appearance as well (Pillay, 1999a). Thus the coincidence of physiological evidences given by the above workers, as well as the appearance of light cells (structural observation) (Pillay, 1999a) in the trigeminal ganglion during the same developmental stage (E8) might clearly suggest that these light cells have made their first appearance as a result of their failure in making functional connections. It is assumed that the cells which have failed to form a functional connections might become ultimately inactive, lose their function, die, degenerate and disappear and that these are the cells that take a lighter colour on staining and that this light-cell stage represents stages of inactivity and degeneration.
An important point to be stressed here in the vagal (nodose) ganglion is regarding the occurrence of large number of light-cells on E6, the earliest period ever observed in any one of the cranial nerve ganglia (Pillay, 1999, 1999a, 2000, 2001a, 2001). By this peculiar behaviour of the nodose ganglion, it is assumed that the vagus nerve establishes the earliest functional connections (around E6 or even earlier) in view of its vital functional importance involved in maintaining the life of the animal during development because of its connections with vital organs concerned with alimentary, respiratory and cardiac functions.
The number of cells on E10 has reduced to 16181 cells that include 16014 dark cells and 167 light ones. Even though the increased number of tiny cells is negligible (having 135 cells), this might imply to be the appearance of an increased number of phagocytic cells, the activity of which, in turn, results in the reduced number of total cells. However, the very-big type of cells have appeared on E10 which is suggestive of continued cellular growth and maturation process as a result of establishment of functional connections of these cells. Again, the cellular degeneration (or loss) takes place among almost all classes of cells except probably the small cells in which the number of cells has increased to 7626 on E10. This, might in turn, suggest that this period is a critical stage whereby the cells are attempting to establish functional connections, and if they fail, this results in their death, degeneration and loss, as evidenced by the reduced total number of cells on E13.
On E13, the great reductions in the total number of cells and an increased number of light-ones indicate an acceleration of cell-death, degeneration and loss. It is assumed that this period is a critical stage for the neurons where an active functional connection is being established. All classes of cells have reduced in number indicating cell-death, degeneration and loss when these cells fail to establish functional connections. However, a few large cells have made their first appearance that is suggestive of a continued cellular growth and maturation as a result of their establishment of functional connections. Thus, it is thought that the period of accelerated degeneration (E10 - E13) is the period of active establishment of proper functional connections. This is somewhat similar to the observation (Rubel et al., 1976) about cell-death that was observed among the cells in the brain-stem auditory nuclei where most cell-death occurs in the period between E11 and E13. It has been shown (Yip and Johnston, 1984) that survival of mature neurons of the dorsal root ganglion in newborn rats is partially dependent on the availability of nerve growth factor (NGF) transported from the CNS via the dorsal root fibres. This also supports the suggestion, that those cells that have established proper projections will receive sufficient NGF from the CNS and survive and that others will die. Recent studies (Lumsden and Davies, 1986; Lumsden, 1988) have demonstrated that agents other than NGF guide neurites of NGF-responsive neurons in their development. Co-culture studies on the effects of mouse embryonic maxillary process have shown that neurites grow exclusively towards their target-field under the influence of an attractant produced by the target epithelial tissue that ultimately produces the sensory receptor cells of that particular field. The factors involved is immunochemically distinct from that of NGF and laminin, and is produced during the period of normal out-growth, but declines after the normal growth-cone and target encounter, and is not produced by the adjoining cutaneous fields (Davies and Lumsden, 1990; Lumsden, 1988). However, it is possible to assume that even after establishment of projection fibres into proper innervation fields, if these fibers are unable to transport the NGF or if the NGF available for transport through the fibers is inadequate to keep its optimum amount, these cells might die as well.
This might imply that the cellular death occur at any stage of their growth, probably even after a connection is established. This is possible that when the peripheral projections obtained by these cells are not in the proper field or when there is a defect developed in the micro-environment, these connections might lose their proper function (i.e., they fail to establish functional connections). Therefore, these cells might be destined to die by an adverse stimulus (such as inadequate supply of NGF) coming from the CNS as it has been explained by Yip and Johnston (1984) as being responsible to promote nerve-growth in the dorsal root ganglion in the newborn rats. This is also in accordance with the observation (Korsching and Thoenen, 1985; Davies et al., 1987) that about 20 - 80 % of the neurons initially generated in the sensory ganglia die shortly after they innervate their target-fields. Therefore, as stated initially, both the peripheral and central target-fields play a role in regulating neuronal numbers (Davies and Lumsden, 1990).
It is noticed on E15 that the tiny cells and all other larger classes of cells are enormously increased in number. This is suggestive of a greater rate of proliferation, growth, maturation of cells and faster establishment of functional connections making these cells grow faster into larger classes. The largest class continues to be the large type only, similar to that observed on E13. However, during this period, there is a reduction in the number of big, very-big and large cells. Also at this stage, the larger classes of cells (viz, very-large type) have not made their appearance. It is possible that some of these cells might represent those which undergo degeneration after making functional connections, due to some adverse factors (in the macro-environment) present either within or around these cells. It is also possible that the cells that fail to establish functional connections begin to die as a result of inadequate supply of stimulus such as NGF that is responsible for further growth and survival (Yip and Johnston, 1984). Even though this view suits very well with the present results, it is noticed that the proliferation of new cells, their growth and maturation continue fast during this period, probably in order to replace such unsuccessful neuronal elements which fail to establish functional connections. However, in spite of such reduction in these categories of cells, the total cell-number has actually increased (to 46803 cells) in the ganglion on E15 that is due to mainly the increased number of tiny, very-small, small and medium-sized ones. It is possible that such increased number of cells might also include some proportion of phagocytic cells in addition to neuronal elements since the ganglion is preparing for phagocytic activity as evidenced by their occurrence on E18 (as explained below). On E18 again, the ganglion shows a greater increase in smaller classes of cells indicating an acceleration of proliferative activity or influx of new cells from other sources. The different larger classes of cells indicate cellular growth and maturation. A comparative analysis of the number of different types of cells observed on E18 and those observed on the day of H shows that there is a great cellular loss on the day of H.
This huge loss concerns mainly with the large number of tiny, very-small, small and medium-sized ones. This clearly indicates that the multiplicity of cells concerns mainly with phagocytes or cells that have gained the capacity to remove the unsuccessful neuronal elements that have failed to perform normal function. Similar findings of the presence of enormous number of phagocytic cells at similar developmental stages have been reported earlier (O’Connor and Wyttenbach, 1974; Wang-Chu and Oppenheim, 1978). However, larger classes of cells viz, the big, very big and large types, on the other hand, have increased in number on the day of H. This is suggestive of establishment of functional connections (further growth and maturation of neurons) around E15 - E18. This behaviour is almost similar to the report in the CNS (Rubel et al., 1976) that major changes in cell size, nuclear size (neuron-groups) cell number occur between E13 and the day of H and that the increase in ganglionic volume commences at the end of the period of cell death which begins around E13 - E17. The cellular death and degeneration could be one of the factors that regulate the size of cell population in the ganglion as has been suggested by other investigators (Saunders, 1966; Michaels et al., 1971). They also suggested that the degenerating neurons might produce hydrolytic enzyme for their own degeneration and digestion (autolysis). However, these results have no evidence for this suggestion because the phagocytic cells produced during this period (around E15 - E18) disappear on the day of hatching. However, this suggestion might be reasonable for the phagocytic cells themselves that appear around E15 - E18 and are responsible to remove the remnants of the degenerating neuronal elements. If the above suggestion is to be taken for the neurons themselves, then no explanation could be attributed for the tremendous production or flooding of the tiny cells that appear around E15 - E18 and disappear by the day of H.
On the day of hatching, there is a great cellular loss from that observed on E18. This indicates that the cellular death, degeneration, phagocytosis etc are at their highest peak during the period between E18 and the day of hatching, resulting in a greatly reduced number of cells on the day of hatching. The greatly reduced number of tiny cells implies that they are involved in the process of clearing-away of noxious substances (phagocytosis), and that they have disappeared after completing their function. The increased number of light cells (so-called inactive or dead cells) at this stage (on hatching) might suggest that cellular degeneration still continue. However, the increased number of large classes of cells is suggestive of neuronal maturation.
Vestibular Ganglion: The appearance of few light cells on E6 for the first time might indicate an active and early establishment of functional connections around this period. It has been found that in the trigeminal ganglion (Hamburger and Narayanan, 1969) by the 8th day of incubation at least some of its cells have established peripheral and central connections as indicated by the presence of reflexogenic responses to tactile stimulus of the beak. It is also found that many trigeminal sensory cells have extensive peripheral projections by the end of the first week of incubation (Noden, 1980) and that these cells might cease dividing very early in embryonic development. Such period coincides with the appearance of light cells in the trigeminal ganglion on E8 (Pillay, 1999a). Probably these light cells have formed as a result of their failure to establish a functional connection. It is possible to assume that those cells which fail to establish proper central and peripheral connections might become inactive and take a lighter cytoplasmic stain.
Thus the appearance of light cells on E6 for the first time during development in the vestibular ganglion is the earliest stage, where the light cells have ever observed in any one ganglion. This, in turn, would explain the earliest establishment of functional connections in the ganglion and also greatly emphasises the functional importance of the vestibular ganglion and vestibular organs during intra-uterine development, so as to keep a balanced and optimal position of the vital bodily organs in relation to gravitational force. Maintenance of proper position during development in relation to the gravitational force is probably an important factor for the normal development and growth of the embryo.
The size of cell-population on E6 is 13.87 % that shows an increase through E8 to reach 26.11% on E10. This drops down on E13 to 18.51% and increases on E15 to 22.53%. Later, there is a sharp increase in the cell-population on E18 with a great influx of smaller categories of cells especially tiny and very small types to gain its highest value of 100%. The first increase in the cell-population observed in the ganglion on E10 might be concerned mainly with neural elements (nerve cells and neuroglia), whereas the second increase observed on E18 concerns mainly with phagocytic cells that help to remove the unsuccessful neuronal elements. Later these phagocytic cells themselves disappear from the ganglion on the day of hatching. Therefore, the cell population suddenly drops down on the day of H while only 7.62 % cells remain, with a loss of 92.38 % cells during this short period. The presence of enormous number of phagocytic cells at similar stages has been reported by several investigators (O’Connor and Wyttenbach, 1974; Pilar and Landmesser, 1976). The cell death and degeneration could be one of the factors that regulate the size of the cell population and morphogenesis in the ganglion during development. Similar function has been suggested by several investigators earlier (Saunders, 1966). It is also suggested (Michaels et al., 1971) that the degenerating cells produce hydrolytic enzyme for their own degeneration and digestion. However, these results do not provide any evidence for this suggestion because the unsuccessful neuronal elements seem to be digested by phagocytic cells which are produced during the last stages (around E18) of embryonic development, most of which disappear before the day of hatching. However, their suggestion might be reasonable for the phagocytic cells themselves which appear around E15 - E18 and disappear on the day of hatching. However, if the above suggestion is to be taken for the neuronal elements themselves, as they have suggested, no meaning could be attributed for the tremendous production of the tiny and other smaller classes of cells which appear around E15 - E18 and disappear before the day of H.
It has been found that about 45% of cells that have been observed on E6 fail to survive on the day of H. This is similar to the earlier report (Landmesser and Pilar, 1974; Pillay, 1999a) that 40% or more of the neurons that are initially generated fail to survive to maturity.
It is evident that the results in the vagal and vestibular ganglia are strikingly different from that observed in all other ganglia investigated in this series of investigation (Pillay, 1999a, 1999, 2000, 2001a, 2001). All these factors discussed above strongly emphasize the importance of the early establishment of functional connections of the nodose and vestibular ganglionic neurons during development. Under these circumstances, further investigation is being carried out to clarify whether the changes in the ganglia could be compared with those in the brainstem nuclei of these nerves.
ACKNOWLEDGEMENT
The author wishes to acknowledge his sincere and unlimited gratitude to Professor Dr. Dubbeldam JL, University of Leiden, Netherlands for his continued generosity, guidance, co-operation and support throughout this study. His continued efforts and encouragement to make it as part of a thesis for the award of a DSc degree are greatly appreciated.
REFERENCES
- Cammermeyer, J., 1962. An evaluation of the significance of the dark neuron. Ergeb. Anat. Entwicklungsgesch., 36: 1-61.
PubMedDirect Link - Carmel, P.W. and B.M. Stein, 1969. Cell changes in sensory ganglia following proximal and disal nerve section in the monkey. J. Comp. Neurol., 135: 145-165.
CrossRefDirect Link - Davies, A.M., C. Bandtlow, R. Heumann, S. Korsching, H. Rohrer and H. Thoenen, 1987. Timing and site of nerve growth factor synthesis in developing skin in relation to innervation and expression of the receptor. Nature, 326: 353-358.
CrossRefPubMedDirect Link - Davies, A.M. and A. Lumsden, 1990. Ontogeny of the somatosensory system: Origins and early development of primary sensory neurons. Annu. Rev. Neurosci., 13: 61-73.
CrossRefPubMedDirect Link - Dlugos, C.A. and R.J. Pentney, 1994. Morphometric analyses of purkinje and granule cells in aging F344 rats. Neurobiol Aging., 15: 435-440.
CrossRefDirect Link - Finkelbrand, S. and M. Silberman, 1976. Effect of long-term hyperglucocorticoidism on the neuronal morphology of the trigeminal ganglion of the mouse. Acta Anatom., 96: 582-590.
CrossRefDirect Link - Hamburger, V., 1961. Experimental analysis of the dual origin of the trigeminal ganglion in the chick embryo. J. Exp. Zool., 148: 91-123.
CrossRefDirect Link - Hamburger, V. and C.H. Narayanan, 1969. Effects of the deafferentation of the trigeminal area on the motility of the chick embryo. J. Exp. Zool., 170: 411-426.
CrossRefDirect Link - Korsching, S. and H. Thoenen, 1985. Nerve growth factor supply for sensory neurons: Site of origin and competition with the sympathetic nervous system. Neurosci. Lett., 54: 201-205.
CrossRefPubMedDirect Link - Kozhura, V.L., Z.V. Soloveva, I.S. Novoderzhkina and N.V. Nosova, 1994. Molecular and cellular mechanisms of ischemic damage of the brain in hemorrhagic shock. Anesteziol. Reanimatol., 3: 24-28.
PubMedDirect Link - Landmesser, L. and G. Pilar, 1974. Synapse formation during embryogenesis on ganglion cells lacking a periphery. J. Physiol., 241: 715-736.
Direct Link - Lumsden, A.G. and A.M. Davies, 1986. Chemotropic effect of specific target epithelium in the developing mammalian nervous system. Nature, 323: 538-539.
CrossRefPubMedDirect Link - Matsura, H., M. Mori and K. Kawakatsu, 1969. A histochemical and electron-microscopic study of the trigeminal ganglion of the rat. Arch. Oral. Biol., 14: 1135-1146.
PubMedDirect Link - Michaels, J.E., J.T. Albright and D.I. Patt, 1971. Fine structural observations on cell death in the epidermis of the external gills of the larval frog, Rana pipiens. Am. J. Anat., 132: 301-317.
CrossRefDirect Link - Moses, H.L., 1967. Comparative fine structure of the Trigeminal ganglia, including human autopsy studies. J. Neurosurg., 26: 112-126.
CrossRefDirect Link - Noden, D.M., 1980. Somatotopic and functional organization of the avian trigeminal ganglion: An HRP analysis in the hatchling chick. J. Comp. Neurol., 190: 405-428.
CrossRefDirect Link - O'Connor, T.M. and C.R. Wyttenbach, 1974. Cell death in the embryonic chick spinal cord. J. Cell Biol., 60: 448-459.
CrossRefDirect Link - Peach, R., 1972. Fine structural features of light and dark cells in the trigeminal ganglion of the rat. J. Neurocytol., 1: 151-160.
CrossRefDirect Link - Pilar, G. and L. Landmesser, 1976. Ultrastructural differences during embryonic cell death in normal and peripherally deprived ciliary ganglia. J. Cell Biol., 68: 339-356.
CrossRefDirect Link - Pillay, A.G., 1999. Acoustic ganglion in the chick during development and ageing process. Pak. J. Biol. Sci., 2: 1219-1223.
CrossRefDirect Link - Pillay, A.G., 2000. Cell turnover in the Trigeminal ganglion during gangliogenesis and aging process and its significance. Pak. J. Biol. Sci., 3: 1736-1739.
CrossRefDirect Link - Pillay, A.G., 2001. Dual cytology, cellular death and their significance in the proximal ganglionic complex: An investigation through the ontogeny of the chick gallus gallus domesticus. J. Med. Sci., 1: 16-21.
CrossRefDirect Link - Pillay, A.G., 2001. Cellular death as a regulative mechanism in the control of orderly structure and function in the geniculate ganglion during development and aging: An investigation in the chick. J. Med. Sci., 1: 67-70.
CrossRefDirect Link - Rubel, E.W., D.J. Smith and L.C. Miller, 1976. Organization and development of brain stem auditory nuclei of the chicken: Ontogeny of N. magnocellularis and N. laminaris. J. Comp. Neurol., 166: 469-489.
CrossRefDirect Link - Shinder, V. and M. Devor, 1994. Structural basis of neuron-to-neuron cross-excitation in dorsal root ganglia. J. Neurocytol., 29: 515-531.
CrossRefDirect Link - Silbermann, M. and S. Finkelbrand, 1978. Activity of phosphatases and succinic dehydrogenase in the Trigeminal ganglion of the corticosteroid-treated mouse. Acta Anat., 100: 229-236.
CrossRefDirect Link - Spassova, I., 1982. Cat trigeminal ganglion. Neuron types. An experimental study. Z. Mikrosk. Anat. Forsch., 96: 235-244.
PubMedDirect Link - Chu-Wang, I.W. and R.W. Oppenheim, 1978. Cell death of motoneurons in the chick embryo spinal cord. I. A light and electron microscopic study of naturally occurring and induced cell loss during development. J. Comp. Neurol., 177: 33-57.
CrossRefPubMedDirect Link - West, M.J., 1993. Regionally specific loss of neurons in the aging human hippocampus. Neurobiol. Aging., 14: 287-293.
PubMedDirect Link - Yip, H.K. and E.M. Johnston Jr., 1984. Developing dorsal root ganglion neurons require trophic support from their central processes: Evidence for a role of retrogradely transported nerve growth factor from the central nervous system to the periphery. Proc. Nat. Acad. Sci. USA., 81: 6245-6249.
Direct Link