
O. Anomohanran
Department of Physics, Delta State University, Abraka, Nigeria
Journal of Applied Sciences
Year: 2013 | Volume: 13 | Issue: 1 | Page No.: 119-125


ABSTRACT
The aim of this study was to assess the groundwater potential in Ukelegbe, Nigeria. This was carried out by evaluating the geoelectrical and hydrogeological characteristics of the aquifer in the area. The Vertical Electrical Sounding (VES) technique using the Schlumberger array configuration was applied to investigate the geoelectrical characteristics. The data obtained were interpreted first by partial curve matching and by computer iteration techniques. Results obtained were correlated with lithologic log from a borehole drilled to provide control for the geoelectrical interpretation. The hydrogeological properties of the aquifer layer were obtained through laboratory measurement of the borehole soil samples using a constant head permeameter. The result of interpretation indicates the presence of three to four geoelectric layers which are composed of sandy/loamy top soil, sand, clay and fine sand formations. The result also revealed the presence of confined aquifer located in layer four. The various geoelectrical interpretations and hydrogeological results depict that the best sites for locating wells or boreholes in Ukelegbe are VES stations 3, 4, 7, 8 and 9. The study has also revealed that an estimated one hundred and twenty five thousand dollars is required to provide potable water to sustain livelihood in the area. Policy which will compel drillers to stick to the depths recommended in this study is suggested.
PDF Abstract XML References Citation
Received: November 14, 2012;
Accepted: December 26, 2012;
Published: February 01, 2013
How to cite this article
O. Anomohanran, 2013. Geophysical Investigation of Groundwater Potential in Ukelegbe, Nigeria. Journal of Applied Sciences, 13: 119-125.
DOI: 10.3923/jas.2013.119.125
URL: https://scialert.net/abstract/?doi=jas.2013.119.125
DOI: 10.3923/jas.2013.119.125
URL: https://scialert.net/abstract/?doi=jas.2013.119.125
INTRODUCTION
Water is considered an important necessity in the sustenance of life. This is why nature has bestowed the world with much of it. About two third of the total land space in the world is covered by it (Shiklomanov, 1993). However, the availability of good quality water for drinking has been characterised with problems ranging from pollution to inadequate information to exploit it for use. The exploration and exploitation for oil in the Niger Delta area of Nigeria has resulted in polluted water being bequeathed to the people for drinking and other uses (Kangrang et al., 2008; Nnabuenyi, 2012).
Water is available in many forms such as ice caps, glaciers, ocean water, surface water and groundwater. Groundwater happens to be a more reliable source of water for over half of the world population (Alabi et al., 2010; Anomohanran, 2011a). It is described by Otutu and Oviri (2010) as water found in the saturated layers of soils and rocks. In other to explore this natural resource for the benefit of sustaining life, various geophysical methods have been employed successfully. These methods include electrical resistivity, seismic refraction, electromagnetic, gravity, magnetic and magnetotelluric (Karami et al., 2009; Majumdar and Das, 2011; Todd, 2004). The choice of method depends largely on the depth of investigation and sometime cost (Todd, 2004; Majumdar and Das, 2011). Of all these methods used in exploring for groundwater, the electrical resistivity profiling has been the most widely used method (Molua and Emagbetere, 2005). This is because the operation of the field instrument is uncomplicated and the analysis of data is less unwieldy and economical (Iserhien-Emekeme et al., 2004; Ezeh and Ugwu, 2010; Anomohanran, 2011a, b; Atakpo and Ofomola, 2012). The electrical resistivity method is used in estimating the depths of bedrock surfaces and the soil or rock thicknesses (Al-Saigh, 2010; Nwankwo, 2011). The method is also used to investigate ground water contaminants and their movement pattern (Ehirim and Ofor, 2011).
The Vertical Electrical Sounding (VES) is a common geophysical technique in groundwater exploration (Ujuanbi and Asokhia, 2005; Alile et al., 2008; Sirhan et al., 2011). It is used to determine the vertical variation of electrical resistivity below the earth surface and the potential field generated by the current (Otobo and Ifedili, 2005; Anomohanran, 2011a). This is based on the fact that the electrical resistivity of most rocks depends on the amount of water in their pores. It also depends on the distribution of these pores and the salinity of the water (Todd, 2004). These are the most important factors that govern the occurrence, abundance and quality of groundwater.
Electrical resistivity of the earth can be studied by introducing a current (I) into the ground via a pair of electrodes (A and B) as shown in Fig. 1. This current in turn produces an electrical potential difference between another pair of electrodes (M and N) measured as V.
In a VES survey in which the Schlumberger electrode configuration is employed (Fig. 1), the apparent resistivity (ρa) of the subsurface is given by the relation:
| (1) |
where, V is the potential difference between the pair of electrodes (M and N), R is the transverse resistance, AB is the current electrode separation and MN the potential electrode separation.
In presenting VES data, apparent resistivity (ρa) values are plotted against half current electrode spacing (AB/2) on a double logarithmic paper (Anomohanran, 2011b). In such a plot, the effect of highly conductive layer at large depths is attenuated while those of layers close to the surface are enhanced. In order to carry out quantitative interpretations of the data, the earth is assumed to be horizontal with the last layer being of infinite thickness. It is also assumed that each layer is electrically homogeneous and isotopic. Geoelectric sections which correspond to layer of uniform hydrogeological properties are deduced from the interpreted data. Ground water situation varies from one geoelectric section to another (Kumar et al., 2007).
With the prevailing need for water in the study area coupled with lack of surface water sources, there has been greater interest in the use of groundwater. This is obtained either by hand dug wells or drilled boreholes without any scientific records thereby exposing the people to the risk of contaminated water. This study is therefore aimed at determining the groundwater potential of the area. This will be carried out by evaluating the geoelectrical and hydrogeological characteristics of the aquifer layer present in the study area. This study will therefore provide the needed information to the people in respect to depth and best locations for obtaining portable water.
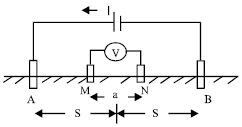 | |
| Fig. 1: | Sketch diagram of Schlumberger array configuration |
MATERIALS AND METHODS
Location and geology of the study area: The study area is Ukelegbe, located in Delta State Nigeria (Fig. 2). It is situated within longitude 6.04° and 6.16° E and latitude 5.52° and 5.64° N. The area has an annual mean temperature of 27°C, while the mean annual rainfall is 2.75 m (Ehirim and Ofor, 2011). The relief is generally undulating with the general slope of the land towards the northeast direction.
The area lies within the Northern Delta depobelt within the Benin formation. The Benin formation consists of poorly consolidated sandstone with shale intercalations. The shale ranges from impermeable to semi pervious while the sand which is highly porous could be as much as 80%. Texturally, the sand is fine to coarse grained, sub-angular to well rounded, poorly sorted, clean and whitish (Atakpo and Ofomola, 2012).
Analysis of study: A geophysical survey, comprising of nine stations (VES 1-VES 9) was undertaken in this study (Fig. 3). The vertical electrical sounding which involves injecting an artificially generated direct current into the ground through two current electrodes was carried out as described by Anomohanran (2011b). The resulting potential difference was measured by another pair of potential electrodes in the vicinity of the current flow. The VES was conducted by using the ABEM SAS 300 Terrameter. The Schlumberger array configuration was applied with the current electrode spacing extending from AB/2 equal 1 to 240 m. The data obtained were interpreted by partial curve matching which gave an estimate of the layer resistivity and thickness.
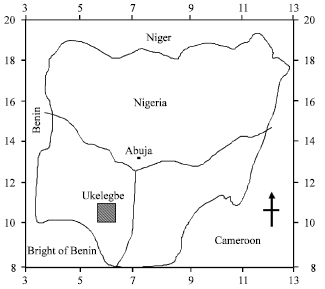 | |
| Fig. 2: | Map of Nigeria showing the study area (Ukelegbe) |
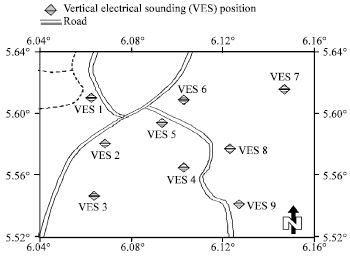 | |
| Fig. 3: | Location map showing the vertical electrical sounding positions |
These serves as the starting point for the computer assisted interpretation which was carried out using iteration software called Win Resist.
A borehole was drilled to obtain lithostratigraphic information on the subsurface geology as well as to provide control for the geophysical interpretation. The hydraulic conductivity of the aquifer layer was obtained through laboratory measurement of the borehole drill cuts samples. This was carried out using a constant head permeameter as described by Todd (2004). The permeameter is an instrument capable of measuring hydraulic conductivities of consolidated or unconsolidated formations. The hydraulic conductivity was determined using the Darcy’s law given as:
| (2) |
where, Q is the discharge rate, i is the hydraulic gradient and A is the cross-sectional area of the sample.
The transmissivity (T) which is the rate at which water is transmitted through a unit width of an aquifer under a unit hydraulic gradient was also determined using the relation:
| (3) |
where, σ is the aquifer conductivity, K is the hydraulic conductivity and R is the transverse resistance of the aquiferous layer (Ezeh and Ugwu, 2010).
RESULTS AND DISCUSSION
The resistivity field curves showing the variation of apparent resistivity and half the current electrode spacing were plotted using the log-log scale.
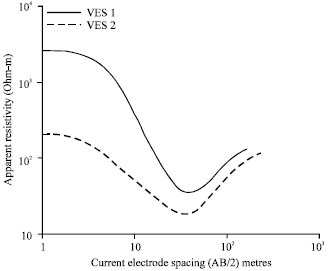 | |
| Fig. 4: | Vertical electrical sounding curves obtained at stations 1 and 2 |
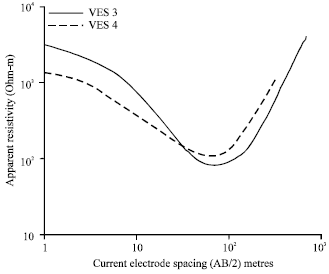 | |
| Fig. 5: | Vertical electrical sounding curves obtained at stations 3 and 4 |
The plots of these curves for the nine VES stations are presented as shown in Fig. 4-7. It is observed from the curves in Fig. 4-6 that the resistivity value of the first layer is higher than that of the second layer. This value reduces further in the third layer and then rises again. This pattern also plays out in VES 8 (Fig. 7). For VES 7, the resistivity of the first layer is less than that of the second layer which in turn is greater than that of layer 3. The resistivity value of layer 3 is observed to be less than that of layer 4. However, for VES 9, the resistivity of the first layer is greater than that of the second layer which in turn is less than that of the third layer. The curve pattern for all the VES stations as shown in Fig. 4-7 indicate an encouraging trend for viable groundwater prospects.
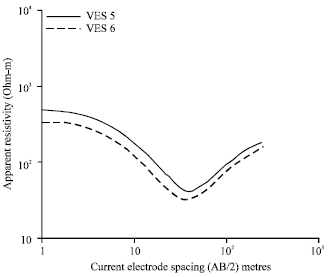 | |
| Fig. 6: | Vertical electrical sounding curves obtained at stations 5 and 6 |
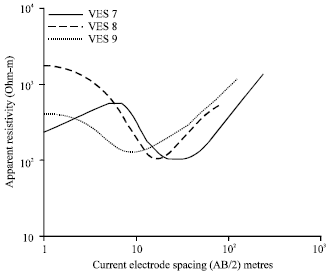 | |
| Fig. 7: | Vertical electrical sounding curves obtained at stations 7, 8 and 9 |
Using the field curves in Fig. 4-7, the geoelectric characteristics of the area were obtained and presented in Table 1. Table 1 shows that the geoelectric curve types identified in the area are QH, KH and H. Analysis of data in Table 1 further shows that seventy eight percent (78%) of all the curves is QH curve making the QH curve type the most dominate in the area. Also from Table 1, it is observed that VES 7 is a KH type curve while VES 9 is a three layer H type curve.
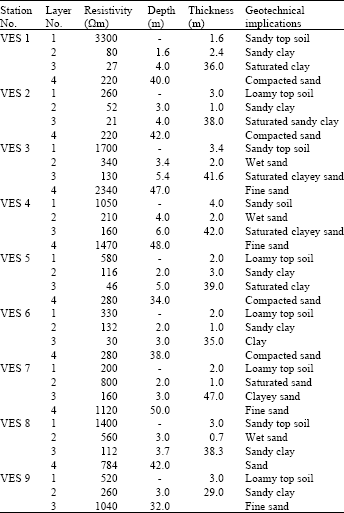
The field data were subjected to qualitative analyses using partial curve matching and computer iterations from which the various formation thicknesses, depths and their corresponding resistivity were obtained (Okwueze, 1996). The summary of this interpretation is presented in Table 2.
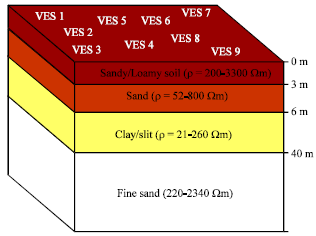 | |
| Fig. 8: | The geo-electrical model of subsurface layers |
| Table 1: | Geoelectric characteristics of the area |
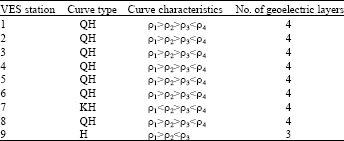 | |
| ρ: Resistivity of the layer | |
The interpretation of the data shown in Table 2 and the log information from the borehole has revealed the presences of three to four distinct layers as presented in Fig. 8.
Analysis of the data reveals that the first layer is comprised of sandy/loamy top soil of thickness ranging between 1.6 and 4.0 m. This layer is attributed to loamy soil when the resistivity is less than 600 Ωm and to sandy soil when the resistivity is higher than 600 Ωm. The second layer is made up of wet sand/sandy clay of light thickness ranging from 1 to 3 m while the resistivity ranged between 52 and 800 Ωm. This layer is absent at the location of VES 9. The area where this layer is sandy clay corresponds to swamp areas. Table 2 also shows the second layer resistivity of VES 4, 7 and 8 to be 210 Ωm, 800 and 560 Ωm, respectively. These resistivity values and the soil type indicate the presence of groundwater in this layer. This aquifer is of course unconfined and vulnerable to pollution from a wide range of sources (Oseji et al., 2006; Alslaibi et al., 2011). The tapping of water from this layer is therefore not recommended. The third layer is a saturated clay deposit which ranged between 29 and 47 m thick (Table 2). It is consisting of alternating clay and silt horizons. The resistivity range is between 21 and 260 Ωm. The fourth layer is composed of fine sand deposits and constitutes a deeper aquifer, confined by the overlying aquitard of layer 3.
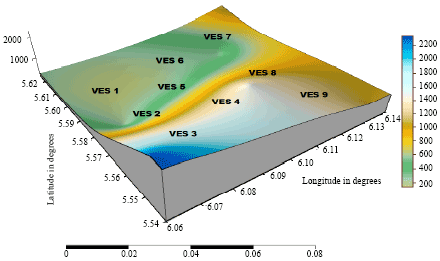 | |
| Fig. 9: | Isoresistivity map of the aquifer layer (Ωm) |
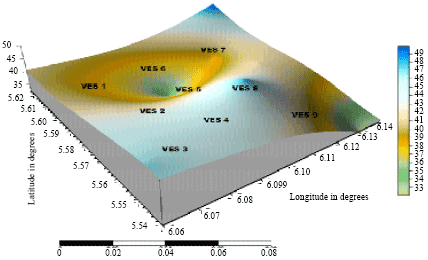 | |
| Fig. 10: | Isodepth map of the aquifer layer (m) |
The resistivity of this formation ranges from 220 to 2340 Ωm. Resistivity higher than 1000 Ωm was deduced in VES 3, 4, 7 and 9. Such high values of resistivity are accounted for by the freshness of the aquifer. This assertion is in agreement with the findings of Ezeh and Ugwu (2010) which shows that the higher the resistivity of the aquifer the fresher the water. Also, the low resistivity of the fourth layer at VES 1, 2, 5 and 6 indicate that the aquifer contain the presence of a thin lens of conducting body.
The resistivity distribution as shown in Fig. 9 reveals that the resistivity is highest in the south western part of the study area with a value of 2340 Ωm. This value reduces gradually toward the south east and north east part of the study area. It attains its lowest value of 220 Ωm toward the North West of the study area. The depth map for the confined aquifer layer is presented in Fig. 10. From this figure, the various depths to strike the top of the confined aquifer are shown ranging from 33 to 50 m. These maps (Fig. 9, 10) therefore acts as a guide for drillers interested in obtaining portable groundwater from this area.
From the hydrogeological properties investigated, the hydraulic conductivity was obtained as 3.2 x 10⁻⁴ m sec-1 while the aquifer transmissivity was obtained as 2.46x10⁻² m2 sec-1. These values suggest that the fourth layer aquifer in the vicinity of VES 3, 4, 7, 8 and 9 is a good quality reservoir.
| Table 2: | Geophysical survey interpretations |
 | |
This is in agreement with the assertion by Nejad (2009) that hydraulic conductivity and transmissivity measurement of this range imply good quality reservoir. This point is also supported by Ezeh and Ugwu (2010) and Majumdar and Das (2011).
This study has shown that the people who lived in this area can enjoy good quality water. This is only possible if the people adhere to drilling their boreholes to the specified depth as shown in Fig. 10. The available information shows that the average cost of drilling a water borehole having 1 hp pump inserted in the study area is $625. Therefore, with an average area of 200 m2, it is estimated that $125,000 will be required to provide good quality water in the area. The authority in charge of providing water for the area is called upon to extend assistance to the people living in this area. Also, there should be a policy enacted to compel drillers to conform to the confined aquifer deep recommended in this study. This will ensure that the people are provided with good quality water free from contamination.
CONCLUSIONS
The study has shown that three to four geo-electrical layers exist in the study area which is made up of a multi aquifer formation. While layer two is taught to be an unconfined aquifer, layer four is a confined aquifer sealed by an impermeable clay formation of about 40 m thick. The depth of the aquifer in layer four ranged between 32 and 50 m. The various geoelectric interpretations and hydrogeological results depict that the best sites for locating wells or boreholes in Ukelegbe are VES stations 3, 4, 7, 8 and 9. The study has also revealed that an estimated one hundred and twenty five thousand dollars is required to provide potable water to sustain livelihood in the area. It is recommended that policy which will compel drillers to stick to the depths recommended in this study and assistance from the authority in charge of providing water for the area is suggested.
REFERENCES
- Alabi, A.A., R. Bello, A.S. Ogungbe and H.O. Oyerinde, 2010. Determination of groundwater potential in Lagos State University, Ojo; Using geoelectric methods (Vertical electrical sounding and horizontal profiling). Rep. Opin., 24: 68-75.
Direct Link - Alile, M.O., S.I. Jegede and O.M. Ehigiator, 2008. Underground water exploration using electrical resistivity method in Edo State, Nigeria. Asian J. Earth Sci., 1: 38-42.
CrossRefDirect Link - Alslaibi, T.M., Y.K. Mogheir and S. Afifi, 2011. Assessment of groundwater quality due to municipal solid waste landfills leachate. J. Environ. Sci. Technol., 4: 419-436.
CrossRefDirect Link - Anomohanran, O., 2011. Underground water exploration of Oleh, Nigeria using the electrical resistivity method. Scientific Res. Essays, 6: 4295-4300.
Direct Link - Anomohanran, O., 2011. Determination of groundwater potential in Asaba, Nigeria using surface geoelectric sounding. Int. J. Physical Sci., 6: 7651-7656.
Direct Link - Ehirim, C.N. and W. Ofor, 2011. Assessing aquifer vulnerability to contaminants near solid waste landfill sites in a coastal environment, Port Harcourt, Nigeria. Trends Applied Sci. Res., 6: 165-173.
CrossRefDirect Link - Ezeh, C.C. and G.Z. Ugwu, 2010. Geoelectrical sounding for estimating groundwater potential in Nsukka L.G.A. Enugu State, Nigeria. Int. J. Phys. Sci., 5: 415-420.
Direct Link - Kangrang, A., S. Compliew, N. Phoomiphan, K. Jamrutnet and J. Khamsree, 2008. An observation of groundwater in rapid urbanization area. J. Applied Sci., 8: 3995-3998.
CrossRefDirect Link - Karami, B., K.N. Dhumal, M. Golabi and N. Jaafarzadeh, 2009. Optimization the relationship between water quality index and physical and chemical poarameters of water in Bamdezh Wetland, Iran. J. Applied Sci., 9: 3900-3905.
CrossRefDirect Link - Kumar, D., S. Ahmed, N.S. Krishnamurthy and B. Dewandel, 2007. Reducing ambiguities in vertical electrical sounding interpretations: A geostatistical application. J. Applied Geophys., 62: 16-32.
CrossRef - Majumdar, R.K. and D. Das, 2011. Hydrological characterization and estimation of aquifer properties from electrical sounding data in sagar island region, South 24 Parganas, West Bengal, India. Asian J. Earth Sci., 4: 60-74.
CrossRefDirect Link - Molua, O.C. and J.U. Emagbetere, 2005. Determination of water table using electrical sounding technique: A case study of Afuze, Edo State, Nigeria. J. Nig. Assoc. Math. Phys., 5: 457-464.
Direct Link - Nejad, H.T., 2009. Geoelectric investigation of the aquifer characteristics and groundwater potential in Behbahan Azad University Farm, Khuzestan Province, Iran. J. Applied Sci., 9: 3691-3698.
CrossRefDirect Link - Nwankwo, L.I., 2011. 2D resistivity survey for groundwater exploration in a hard rock terrain: A case study of MAGDAS observatory, UNILORIN, Nigeria. Asian J. Earth Sci., 4: 46-53.
CrossRefDirect Link - Oseji, J.O., M.B. Asokhia and E.C. Okolie, 2006. . Determination of roundwater potential in Obiaruku and environs using surface geoelectric sounding. The Environmentalist, 26: 301-308.
CrossRefDirect Link - Otutu, O.J. and O.M. Oviri, 2010. Determination of groundwater flow direction in Utagba-Ogbe Kingdom, Nokwa land area of Delta State, Nigeria. Online J. Earth Sci., 4: 32-34.
CrossRefDirect Link - Sirhan, A., M. Hamidi and P. Andrieux, 2011. Electrical resistivity tomography, an assessment tool for water resource: Case study of Al-Aroub Basin, West Bank, Palestine. Asian J. Earth Sci., 4: 38-45.
CrossRefDirect Link - Ujuanbi, O. and M.B. Asokhia, 2005. In search of clay deposit in a dual geological environment in the South-Southern part of Nigeria. J. Nig. Assoc. Mathe. Phys., 5: 443-457.
Direct Link