
M.H. Rezaei Moghaddam
Department of Physical Geography, University of Tabriz, Iran
M. Saghafi
Department of Geography, Payam Noor University of Birjand, Birjand, Iran
Journal of Applied Sciences
Year: 2008 | Volume: 8 | Issue: 6 | Page No.: 946-955


ABSTRACT
In many parts of Iran gullies can be found, but few studies have reported their genesis and characteristics. This study investigates gullies under semi arid climate in the small case-study area of Southern Khorasan Province, in Iran. The objectives are to determine the spatial distribution of gullies in the study area, to measure their morphological and topographical characteristics and to reconstruct the factors that led to their development. Large deep gullies are some of the most important sediment sources in the semi-arid environment of the Shaken Basin. So, this study regards gully development in SHAKHEN drainage basin, north of BIRJAND city, taking into account environmental and social characteristics, which affect gully occurrence and its evolution. Gully erosion clearly is a threshold phenomenon. This geomorphic process occurs only when a threshold in terms of flow hydraulics, rainfall, topography, pedology and land use has been exceeded. In this study with using simple methodology the gully erosion, initiation and development concerning with main factors are monitored. Furthermore, also the role of new tectonics activity in the study area on gully development was considered. Hence, different information resources are being undertaken such as: maps, aerial photos, satellite image and field observations to determine variables in order to understand where and why gullies occurred and developed.
PDF Abstract XML References Citation
How to cite this article
M.H. Rezaei Moghaddam and M. Saghafi, 2008. Gully Erosion Monitoring on Shakhen Drainage Basin, Southern Khorasan Province, Iran. Journal of Applied Sciences, 8: 946-955.
DOI: 10.3923/jas.2008.946.955
URL: https://scialert.net/abstract/?doi=jas.2008.946.955
DOI: 10.3923/jas.2008.946.955
URL: https://scialert.net/abstract/?doi=jas.2008.946.955
INTRODUCTION
Gully erosion is defined as the erosion process whereby runoff water accumulates and often recurs in narrow channels and over short periods, removes the soil from this narrow area to considerable depths (Poesen et al., 2002). Permanent gullies are often defined for agricultural land in terms of channels too deep to easily ameliorate with ordinary farm tillage equipment, typically ranging from 0.5 to as much as 25-30 m depth (Soil Science Society of America, 2001). The term ephemeral gully erosion was introduced to include concentrated flow erosion larger than rill erosion but less than classical gully erosion, as a consequence of the growing concern that this sediment source used to be overlooked in traditional soil erosion assessments (Grissinger, 1996; Foster, 1986). According to the Soil Science Society of America (2001), ephemeral gullies are small channels eroded by concentrated overland flow that can be easily filled by normal tillage, only to reform again in the same location by additional runoff events.
Poesen et al. (1984, 1996, 2001) observed ephemeral gullies to form in concentrated flow zones, located not only in natural drainage lines (thalwegs of zero order basins or hollows) but also along (or in) linear landscape elements (e.g., drill lines, dead furrows, headlands, parcel borders, access roads, etc.). Poesen et al. (1984, 1996, 2001) distinguishes rills from (ephemeral) gullies by a critical cross-sectional area of 929 cm2 (square foot criterion). Other criteria include a minimum width of 0.3 m and a minimum depth of about 0.6 m, or a minimum depth of 0.5 m (Imeson and Kwaad, 1980). Hydraulically any classification that related erosion forms into separate classes, such as micro rills, rills, mega rills, ephemeral gullies, gullies, is, to some extent, subjective (Grissinger, 1996). Therefore, to the upper limit of gullies, no clear-cut definition exists (Poesen et al., 2002).
Purpose of this research is the study and investigation of morphology, effective factors in the gully forming, developing and rate of gully erosion change in the study area. Overall, forming and developing of gully erosion is affected with factors such as physiography, geology, soil, climatologic and landuse (Mendonca and Marcelo, 2002). In this study, overall affecting factors in the producing and developing of gully erosion in the study area, are discussed. Tectonic factors (Soleimani, 1999) have been added to other factors.
STUDY AREA DESCRIPTION
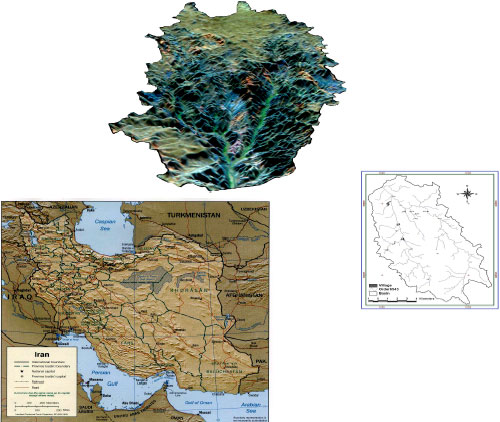
The study area is located about 100 km North of the Birjand city. The drainage basin (Fig. 1) has a total area of 117.63 km2, located in South Khorasan province, Iran. It is confined between the latitudes of approximately 32° 21´ to 33° 12´ N and longitudes 59° 32´ to 59° 40´ E. The Shakhen River and its tributaries flow from the mountain area to the outlet point. The highest point in the catchment is a hilltop at 2500-m above sea level. The maximum difference in elevation from the outlet to the highest point of the watershed is about 450 m.
About 2 km from outlet point in the catchment, the main valley splits into two subvalleys. The basin has two main streams. One is in the east of basin has 24.88 km length and the second in west of basin has 17 km length, which are jointed the first stream about 2 km from outlet point in the catchment. The two famous villages located in the area, VASHAN and SERGHAN each house about 12 farmer. The mean annual rainfall is 256.9 mm and mean annual temperature is 14.2°C. The rainfall season runs from December to April, when several precipitation events occur. Most of these events are of frontal type, moving eastwards across the watershed. According to Emberger Climate classification, the climate of this region is cold semiarid.
The slope in the basin averages out to be 13%. Soils are generally shallow. According to the Soil Taxonomy classification major soil orders in the region are aridisols and entisols. One of the main characteristics of the area is the dissection of the landscape by a deep network of gullies. Large gullies are characterised by vertical sidewalls and are 10 or more meters deep in many places. Geomorphologically, the area can be divided into three parts (Fig. 1); (1) the southern part is covered by an undulating plateau, this upland area mainly used for agriculture. (2) Valley mountainous in the central part. (3) The Northern part (near the outlet of basin) consists of aggraded clay narrow flood plain. The natural vegetation is mainly pasture land with sparse bushes in the semi-arid zone.
Structural and geological setting: Three major tectonic units (Turanian, Iranian and Arabian plates) recognized by Lensch et al. (1984) in Iran, are separated from each other by ophiolitic complexes (Stocklin, 1977). These are subdivided into smaller elements, such as Central Iran. The Central Iran comprises Sanandaj-Sirjan Belt, Orumiyeh-Dokhtar Belt, Central-East-Iran microplate (Davoudzadeh and Schmidt, 1981); the latter is subdivided into Yazd, Tabas and Lut blocks. The studied area is situated in eastern Iran within the Sistan Ocean that is between two blocks: the Lut in the west and Afghan in the east.
The structure of the mapped area (Fig. 2) broadly consists of an assemblage of different blocks which are separated by major faults, frequently of the transcurrent type. There are several phases of faulting, resulting in a network of fault systems with different trends. In addition to (or in combination with) the strike slip faults, thrust and overthrust are present in some areas. Polyphased folding is also apparent. The juxtaposition of blocks which may have been displaced over significant distances accounts for the existence of sharp contacts between formations of strikingly different facies, from typical shelf or playa facies, to flysch-like or ophiolitic facies. A detailed and reliable analysis of the relative block movements would not be possible, at this stage of the study within the limit of the area.
 | |
| Fig. 1: | Situation of the study area |
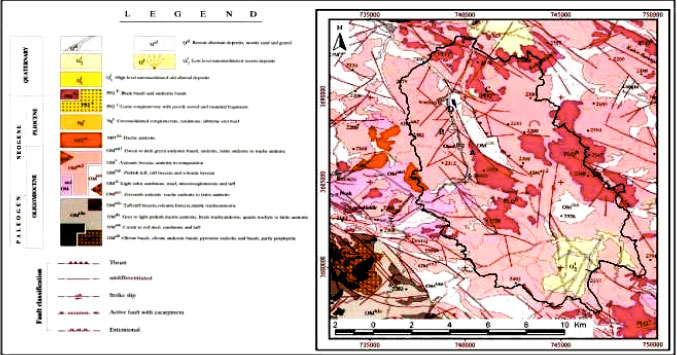 | |
| Fig. 2: | Geological characteristics of the study area |
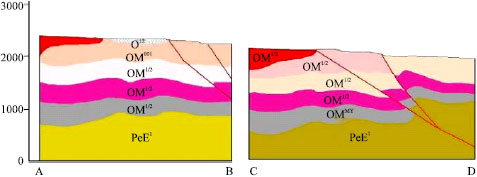 | |
| Fig. 3: | Geological cross-section through the middle part of the Basin. Location in Fig. 2. Showing: (1) the relationship between the stratigraphic units identified in the succession and (2) the relationship with the fault bordering the basin |
The geological and geochemical observations in the region indicate the presence of igneous rocks of varying lithologies, intrusions and volcanic rocks (Fig. 2). Rocks of several groups belonging to the Oligo-Miocene constitute the mountain systems in the study area.
In the study area, volcanic rocks directly overlie the Paleocene-lower Eocene flysch and the ophiolites. They are sharply interrupted to the northwest, together with the ophiolites, but they are extensively exposed in the neighboring region to the southeast. Absolute age measurements made on two samples collected in these regions, using the K-Ar method on whole rock, gave respective ages of 26.6±1.1 and 11.6±0.4 M.Y., indicating the upper Oligocene to Miocene. The base of the volcanic sequence is composed of flows and pyroclastics, mostly of acidic composition (Fig. 3). The flows consist of light-colored andesites and dasites, interlayered with tuff breccia and ignimbritic tuffs. They are overlain by volcanic of more basic composition, consisting of andesite-basalt flows with hornblende and pyroxene (Fig. 3). Mostly towards their base, these flows contain interlayer of tuff and tuff breccia with an andesitic matrix.
MATERIALS AND METHODS
In this research, different data have been used as following:
| • | Meteorological Data |
| • | Field data observation with GPS system |
| • | Topographical maps 1:25000 scales |
| • | Geological maps 1:25000 scales |
| • | Arial photos 1:20000 scales |
| • | Landuse maps 1:25000 scales |
| • | Land unit maps 1:25000 scales |
| • | Vegetation cover maps 1:25000 scales |
Daily rainfall recorded during the period 1971-2003 was analyzed from data collected at many meteorological stations in the region. The frequency distribution of daily rainfalls and the average annual rainfall recorded during this period were evaluated. This frequency distribution was compared with that recorded in the area during the 20th century, which allowed the classification of the study years as wet, normal or dry years, taking into account the percentiles 0.9, 0.5 and 0.25, respectively. In addition, using the STORMGEM program (Mulligan, 1996) and taking into account the rainfall characteristics of the area, recorded at 1 min intervals during the last decade, storms were modeled and the information on intensities recorded during the whole period was obtained.
The GPS used to collect points which can use for morphological analysis of gully in the GIS environment. Another aspect of using GPS technology is that there is the possibility to create geomorphologically-specific Digital Elevation Models (DEMs). Further, GPS technology was used to map a series of gullies by walking around their perimeter. Therefore, positions of gully erosion and its morphological characteristics by creating the geomorphologically DEMs and 3d models in the GIS environment were analyzed. The accuracy of GPS-derived data was later assessed visually by overlaying the GPS data on the geometrically-corrected aerial photography. This confirmed the ability of using GPS to delineate geographical position of features (x, y and z) with confidence, while also emphasizing the highly spatially accurate of the GPS data. The GPS that was used in the study is accurate to 5 m approximately.
Other thematic maps such as: slope, elevation, profile, lithology, vegetation cover, hydrology, geomorphology, landuse, land units, erosion rate and field studies were added to GIS environment.
Head cuts migrations have been indicated by experimental methods such as regression analysis of Vandekrckhove et al. (2001) which calculated for 46 gullies in Spain:
Log Vc = -2.844+ 0.285(log Ap) + 0.173 Hhc + 0.017CN |
In this equation: Log Vc the rates of head cut migration in cubic meter per year (m3 year-1); Ap is drainage basin area in sq meter (m2). Hhc is height of the head cut in meter; CN is runoff curve number values of Soil Conservation System of America (SCS). In this equation, for evaluation of gully head cut retreat 11 information layer have been used which are as following: slope, elevation, profile, lithology, vegetation cover, hydrology, geomorphology, landuse, land units and erosion rate on the base of MPSIAC method.
Regression rate of head cut of gully have been calculated after fitting layers in GIS. In this study, the main attention is to tectonics activities, which unconsidered in mentioned equation.
Morphotectonics and neotectonics indexes have been used for evaluation the role of tectonics activities in increasing the intensity of gully erosion. This factor did not considered in Vandekrckhove method. These indexes are as following:
| • | Sinuosity of mountain front |
| • | The morphology of valleys including V-ratio, ratio of valley to depth, asymmetry of streams, topography cross section symmetry of the region. |
These indexes have been used as information layers with other information layers for evaluation of influenced factors in gully erosion changes. A GIS was used to bring together all spatial data sets. GIS benefit geographical feature detection by allowing the integration of many deference data source; including spatially referenced field surveys, map-based information and DEMs. The use of several data sets such as thematic maps information maximizes the information available to geomorphologist.
RESULTS AND DISCUSSION
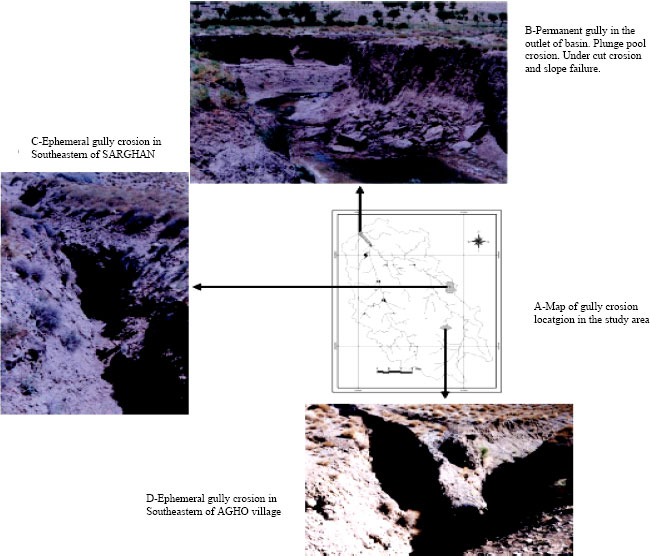
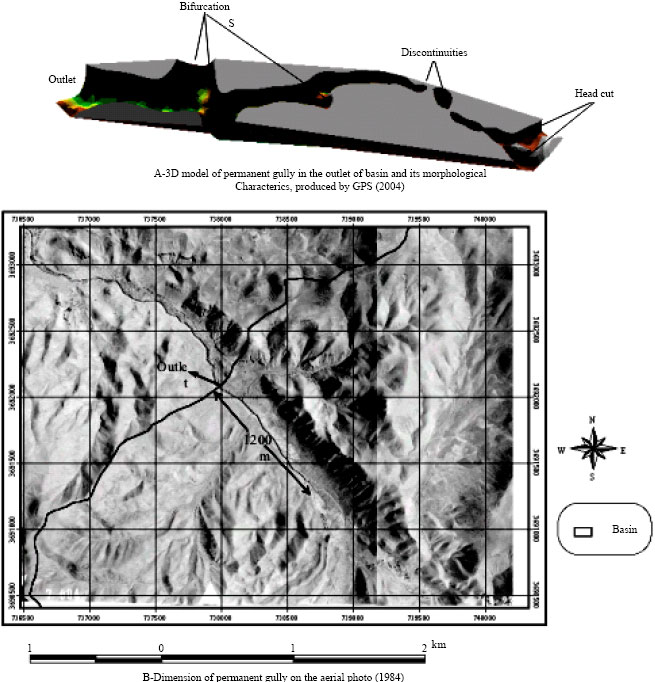
Gully erosion evaluation: Figure 4 shows the zones (in grey) where gully erosion occurred, using GPS by walking around their perimeter. The intensity of water run off and thick layer of sediments prepared good condition for gully creating and development, especially near to outlet of the drainage basin (Fig. 4). The length of this permanent gully is 2004 m.
 | |
| Fig. 4: | Situation of region with gully erosion |
Base on the field study and aerial photos (1:20000), the length of gully have been changed in the interval of photography (dated 1984) and field study (achieved in 2004) (Fig. 5). In the aerial photos, gully length is 1200 m, while in the field studies and measurement with GPS, the measured length of gully is 2004 m.
The rate of permanent gully head cut migration in Shakhen basin is 2.55 m3 year-1 using Vandekrckhove et al. (2001) model. From point of Vandekrckhove model in the drainage basin with 127.6 km2 areas, head cut will be active if the migration rates in gully erosion due to the model equal to 4 m3 year-1. Vandekrckhove head cut migration threshold for Shakhen basin with 117.63 km2 areas is lower than from critical threshold.
By comparing the annual rainfall recorded in the study period with a 32 year record in the area, one can observe that the period was mostly normal-semi aired. Four years received rainfalls >0.75 percentile, ranging between 280 and 300 mm. During that 32-year period, 162 rainfall events were recorded. Of those events, 21 were erosive, according to the criteria of Wischmeier and Smith (1978).
Thus, results of rainfall characteristic analysis show that it is not critical variables in head cut erosion of permanent gully in the study area and head cut migration rate were computed for permanent gully in the basin using Vandekrckhove et al. (2001) model, show that the gully head cut migration is inactive. While, comparing of gully length by aerial photo and field measurement by GPS, Show that 804 m change in the length of permanent gully occurred in the outlet of basin. For this condition there are two possible answers: 1) after regional tectonics acting, gully erosion accelerated and after time spending reduced. (2) Thresholds of Vandekrckhove model are lower than.
 | |
| Fig. 5: | Analysis of the gully change in the study area |
Ongoing tectonic deformation in the area is manifested by (1) prominent seismic activity, (2) displacement of artificial structures, (3) formation of tectonic landforms (including shutter ridges, displaced gullies and active landslides) and (4) formation of the convex longitudinal profile of the Shaken River Fig. 6. The present morphotectonic configuration in the area is shaped by the northwest-southeast-striking and northeast-southwest-striking fault lines, which have a major sinisterly component.
In continuation of this part, new tectonic evolutions of the area discussed using morphotectonic factors.
Evaluation of morphotectonic factors: Tectonic faults are often associated with characteristic geomorphologic features such as linear valleys, ridgelines and slope breaks that can be identified as lineaments in Digital Elevation Models (DEMs). Lineaments are defined as straight linear elements visible at the earth`s surface and which are the representations of geological and/or geomorphologic phenomena (Clark and Wilson, 1994). In geomorphometric analysis, a linear feature can have geometric origin only and represent a change in terrain elevation, such as a valley or ridgeline, slope break or in flex line. In terms of digital terrain modeling, a lineament is a continuous series of pixels having similar terrain values (Koike et al., 1998).
 | |
| Fig. 6: | Anomalous convex in longitudinal profile of Main Rivers in the two sub-basins |
 | |
| Fig. 7: | Cross-profiles of valleys (Table 1) |
Sinuosity of mountain front: Length of mountain front in study area is 54.778 km and the length of straight front is 46.672 km. Therefore, sinuosity is equal with 1.17, which near to one and has been shown new frontal activity.
Morphology of valleys: The result of reviewing indexes of valleys shows that they are deep and V form (Table 1, Fig. 7).
| Table 1: | Results of Valleys morphology study |
 | |
 | |
| Fig. 8: | Uplifting of the study area with eastward tendency |
 | |
| Fig. 9: | Required parameters for calculating topographic cross conjunction |
| Table 2: | Comparison of area and length of sub-streams on the beside of main streams |
 | |
| Table 3: | Calculated topographic cross conjunction |
 | |
Considering indexes results of width to depth ratio across the mainstream indicated that, there is wide bed only in the mouth of drainage basin.
Asymmetry of streams: The calculated asymmetric index for Vashan River is 32.22, which has been shown asymmetry and uplifting of left side of river. Overall, uplifting in the left side of basin (western part of Shakhen drainage basin) is more than east side. So, Shakhen drainage basin inclined to the eastward (Fig. 8). With attention to area of main drainage in Sergan sub-basin (Table 2), area differences between left and right side of main stream is 4.66 km2, while in Washan sub-basin it is 15.78 km2. Therefore, area increasing in the left side of main stream in both sub-basins, result in the length increasing of stream orders in the left side of main streams (Table 2). Measuring of length have been certified this subject. Therefore, that may be caused vertical displacement of left sides.
Topographic cross conjunction: This index has been calculated by extracting 12 profiles across two main streams. The calculated results have been shown there are conjunctions in the study area (Table 3, Fig. 9). The average rate is 0.18. Thus, displacement and uplifting in the area result in small rate of non-conjunction condition. This uplifting caused to divergence of streams direction eastward.
Subsequently, the strata of the region formation were affected by faulting and folding. The uplift of the area ended the deposition in the basin valleys and caused erosion and vertical incision of the river. The incision of the Shaken River, in turn, caused the exposure of the very fine depositional sediment of unconsolidated or poorly sorted materials such as gypsiferous and salty silt marls and silt-clay deposits of Tertiary and Quaternary age. The uplift is accompanied by subsidence of blocks toward the outside of valley basin.
CONCLUSION
Mechanisms for gully erosion appearance and growth are still poorly understood. In the study area, gully formation is associated with both natural drainage features and land-management practices. In addition to the rain characteristics, topography plays an important role in the initiation of gullies. But, the empirical approach shows the need for information on the environment other than topography alone. This is indicated by the weak correlation between drainage basin area and local slope measurements at the initiation point of gullies, even when they are obtained by standard methods.
In this area, in addition to natural factors such as: soil, vegetation, hydrology and landuse, new tectonic activity have been considered also. Throughout the history of the Earth, the movement of plates has resulted in continual global environmental change. The impact of plate tectonics can be considered on two levels. The long-term earth history indicates significant impacts due to the agglomeration of landmasses into larger landmasses and the subsequent changes in temperatures that these landmasses experienced. The splitting of landmasses, together with the changes in global water circulation that followed, also caused considerable change in environmental conditions, both in the oceans and on land. On a smaller time scale, the impacts of earthquakes and volcanic eruptions that have occurred in the recorded history of humans provide insight into the slow but inexorable change brought upon land masses by tectonic activity. This unit allows examining the scale of change caused by both earthquakes and volcanoes while gathering and analyzing the information that indicates past tectonic activity. Using neotectonic indexes, new tectonic activities in this region studied. Results have been certified in early Pleistocene time, uplift and emergence resulted in the progressive migration and the superposition of drainage on the beds. During the recent years, the area was uplifted while base level falls also. In this research, the rates of changes in gully erosion by comparison of aerial photos (1:20000) and GPS in field study have been indicated. The results show permanently changes in gully erosion in the recent decades. On the other hand, change in landuse and decreasing vegetation cover and overgrazing are external factors in gully erosion in this region.
The most active processes, leading to the largest retreat rates, were soil fall after tension crack development (Fig. 4) and undercutting by plunge pool erosion or by the development and consecutive destruction of flutes (Fig. 4) and piping as a potential mechanism for head cut retreat was active in the studied bank gullies, but remnants of pipes observed in some gullies indicate that this process might be more important at an earlier stage of development. Finally, the availability of suitable topographic indices able to satisfactorily estimate gully erosion, together with terrain digital models and geographic information systems, would identify areas susceptible to gully erosion.
REFERENCES
- Clark, C.D. and C. Wilson, 1994. Spatial analysis of lineaments. Comput. Geosci., 20: 1237-1258.
CrossRefDirect Link - Koike, K., S. Nagano and K. Kawaba, 1998. Construction and analysis of interpreted fracture planes through combination of satellite-image derived lineaments and digital elevation model data. Comput. Geosci., 24: 573-583.
CrossRefDirect Link - Mendonca, J.K.S. and R. Marcelo, 2002. Gully Erosion Monitoring in Sao Luis City-Maranhao State-Brazil. Soil and Fertilizer Society of Thailand. WCSS, Thailand.
Direct Link - Poesen, J., G. Verstraeten, R. Soenens and L. Seynaeve, 2001. Soil losses due to harvesting of chicory roots and sugar beet: An underrated geomorphic process? Catena, 43: 35-47.
CrossRef - Vandekerckhove, L., J. Poesen, D.O. Wijdenes and G. Gyssels, 2001. Short-term bank gully retreat rates in Mediterranean environments. Catena, 44: 133-161.
CrossRefDirect Link