
Muhammad Hikam
Not Available
Bambang Soegijono
Not Available
Nofrijon I. Sofyan
Not Available
Journal of Applied Sciences
Year: 2006 | Volume: 6 | Issue: 15 | Page No.: 3096-3102


ABSTRACT
The effect of Pb on crystallographic structure and electron density of Ba1-xPbxTiO3 ceramic, where x (nominal) = 0.5, has been investigated by XRD Phillips 1877. The samples were synthesized using powder metallurgy method from BaCO3, PbCO3 and TiO2, with purity better than 99%, available commercially from E-Merck. The x-ray diffraction data obtained at room temperature were refined using the crystallographic software package GSAS. The structural analysis shows that the crystal is Ba0.7Pb0.3TiO3 with the perovskite-type BaTiO3 structure, the space group is tetragonal P4mm with a = 3.943(1) Å, c = 4.055 Å and V = 63.035 Å3. These results imply that Pb has no effect on the non-centrosymmetric structural change of barium titanate, except to slightly contract a and b parameters and to extend c parameter, the c/a ratio becomes 1.03. The studies on electron density show that the electron density measurements are consistent with the calculated structural parameters, it has maximum Δρ = 7.965 eΕ-3 and minimum_Δρ = -2.555 eÅ-3. The final results show that there is an increasing of electron density at the substitute ion positions with maximum ρ = 180.069 eΕ-3 and 172,105 eÅ-3 for the observed and the calculated values, respectively. These values are greater than the one from barium titanate. Approximately, the observed (calculated) maximum electron density increases by 56% (53%) as 33% Pb substitutes Ba.
PDF Abstract XML References Citation
How to cite this article
Muhammad Hikam, Bambang Soegijono and Nofrijon I. Sofyan, 2006. Crystallographic Structure and Electron Density of Ba1-xPbxTiO3 Ceramic. Journal of Applied Sciences, 6: 3096-3102.
DOI: 10.3923/jas.2006.3096.3102
URL: https://scialert.net/abstract/?doi=jas.2006.3096.3102
DOI: 10.3923/jas.2006.3096.3102
URL: https://scialert.net/abstract/?doi=jas.2006.3096.3102
INTRODUCTION
Nowadays, CD-ROM, VCD, DVD or other types of optical disk are of important part in the recording media technology. One of the information recording methods is using a hologram technique using photorefractive effect on polar dielectric material (Joseph et al., 1994), where the recording is done by block-by-block rather than point-by-point, which in turn enables much higher density in information recording as compared to ordinary technique (Kotechi et al., 1999). The photorefractive effect strongly depends on refractive index, which is highly non-linear.
One of the materials for this purpose is barium titanate, BaTiO3, which has been intensively investigated for many years (Jona and Shirane, 1962; Cross, 1995; Beck et al., 2001; Ahluwalia et al., 2005). The material is chemically and mechanically stable, it exhibits ferroelectric properties at and above room temperature and it can be prepared and used in the form of ceramic polycrystalline.
The ferroelectric behaviors of ceramic BaTiO3 were reported by Von Hippel et al. (1946), independently by Wul and Golgmani (Buttner and Maslen, 1992). The tetragonal room-temperature phase, originally assigned to the space group P4/mmm by Megaw et al. (1945-47), was shown to conform the non-centrosymmetric space group P4mm by convergent-beam electron diffraction by Tanaka and Lempfuhl (1972). This P4mm phase is stable from 268 to 939 K. BaTiO3 undergoes phase transitions to orthorhombic at 268 K and to rhombohedral at 183 K. Above 393 K the stable phase has the ideal cubic structure with space group Pm ![]() m. The tetragonal, orthorhombic and rhombohedral phases are polar and ferroelectric.
m. The tetragonal, orthorhombic and rhombohedral phases are polar and ferroelectric.
Lead titanate, PbTiO3, is ferroelectric at room temperature and has a Curie temperature at 490°C as reported first by Shirane et al. and independently by Smolenskii (Jona and Shirane, 1962). Subsequent investigations of the properties of this ceramic have provided comparative data for barium titanate. The structure of PbTiO3 is isomorphic with BaTiO3 in which there is a tetragonal distortion from cubic perovskite lattice at room temperature. One of the deficiencies of lead titanate as compared to BaTiO3 that PbTiO3 is unstable because of the loss of PbO at higher temperature. Nevertheless, lead titanate has a relatively lower melting point as compared with barium titanate.
This research describes the effect of Pb on crystallographic structure and electron density of Ba1-xPbxTiO3 ceramic with x (nominal) = 0.5.
MATERIALS AND METHODS
Structural analysis methods: Diffraction analysis involves a structural parameter refinement process in such a way so that the calculated intensities based on those parameters have the value as close as possible to the observed intensities (Larson and Von Dreele, 1998). For data from polycrystalline samples, Rietveld's method is often used. This method is based on fitting the whole diffraction pattern point by point including profile function and possible overlap peaks. The general expression for the intensity data is:
| (1) |
where Ic is the value of calculated intensity, Ib is the background value, Sτ is the histogram scale factor, Sp,τ is the individual phase scale factor within a histogram and Yp,τ is the contribution from the τth reflection of the pth phase. The two scale factors are useful for the analysis of multiphase mixtures. The advantage of this method is its ability to resolve dense peaks.
In general, the expressions for the calculated values corresponding to the set of crystallographic observations are transcendental and thus the least-square minimization function is nonlinear and the process is iterative. For powder data the function is:
| (2) |
where Io is the number of counts observed in a channel of width, the weight, w, are derived from an error propagation scheme during this procedure and are assumed to be uncorrelated. The quality of least-square refinement is indicated by some residual functions as the following:
 | (3) |
for the whole pattern and
 | (4) |
for weighted pattern.
The reduced χ2 or goodness of fit is defined by the minimization function as:
| (5) |
Further analysis, which should be in agreement with the structural analysis, is the electron density analysis using the difference Fourier synthesis method (Giacovazzo, 1992). A Fourier series having as coefficients the computed using equation:
| (6) |
will give the calculated electron density, ρc(r):
| (7) |
This equation will show a maximum at the positions of the atom of the given model, while a series with coefficients ![]() will give the observed electron density, ρo(r):
will give the observed electron density, ρo(r):
| (8) |
which represents the true structure. In order to see how much the initial model deviates from the real structure, the difference series:
| (9) |
should be computed. Unfortunately the value of φtrue is not known and we have to assume
this approximation is valid for good starting structural model. Eq. (9) then becomes:
| (10) |
If in the model an atom is missing, ρc(r) will be zero at the corresponding position, while ρo(r) will show a maximum. If ρc(r) is correct then the difference synthesis will be almost zero anywhere.
Experiment: The samples Ba1-xPbxTiO3, where x (nominal) in this study was 0.5, were synthesized using powder metallurgy from BaCO3, PbCO3 and TiO2 (DeFrutos et al., 1997), which were reagents with purity better than 99% available commercially from E-Merck. Pure BaTiO3 from E-Merck was used as a reference. Several treatments, including calcination, pelletization and sintering at various temperature were done for the samples (Purwanto, 1998).
Philips PW1877 X-ray diffractometer available at Materials Science Program, Department of Physics University of Indonesia was used to obtain room temperature diffractograms for the representative samples. The x-ray diffraction data were then refined using GSAS, which was developed by Larson and Von Dreele (1998), either for structural parameters and electron density (Hahn, 1995).
RESULTS AND DISCUSSION
The diffraction patterns shown in Fig. 1 belong to pure BaTiO3 from E-Merck as a reference and the best one of Ba1-xPbxTiO3, while the structural parameters and refinements one are shown in Table 1 and Fig. 1a shows a diffraction pattern of pure BaTiO3 from E-Merck using λ (Cu Kα) 1.5405 Å with step counts at room temperature, while Fig. 1b shows a diffraction pattern of Ba1-xPbxTiO3 sample that was compacted 6 tons with the presence of 3% PVA and sintered for 5 h at 950°C, here λ (Co Κα) 1.7889 Å is used.
Table 1 shows that 0.5 weight mole fraction, each for Ba and Pb, just gives the yield 0.7:0.3 proportion of Ba:Pb, results in the composition of Ba0.7Pb0.3TiO3. The lack amount of Pb was expected because of the loss of Pb during the sintering process. Table 1 also indicates that Pb does not influence the non-centrosymmetric structure of barium titanate, it is slightly contract a and b axis and to extend c axis with c/a ratio is of 1.03.
| Table 1: | Structural parameters of BaTiO3 and Ba1-xPbxTiO3, refined in tetragonal P4mm |
 | |
| Here a and c are the lattice parameters, V is the unit cell volume | |
The electron densities are given in the terms of Fourier map as can be seen in Fig. 2-5. Figure 2 shows the observed Fourier maps for (a) BaTiO3 of E-Merck and (b) Ba0.7Pb0.3TiO3, each with the map size of 10 Å, centered at (000) and Ba at z position of Table 1. Contours represent the region with positive electron densities, while negative electron densities or depletion regions are among these contours. Figure 2a shows that maximum electron density takes place at the position of Ba2+ ion, with the value of 115.129 e Å-3 and 112.467 e Å-3 for the observed (Fig. 2a above) and calculated (Fig. 2a below) Fourier, respectively. Figure 2b shows that maximum electron density also takes place at the position of Ba2+ ion, where substitution with Pb2+ ion occurs, with the value of 180.069 e Å-3 and 172.105 e Å-3 for the observed (Fig. 2b above) and the calculated (Fig. 2b below) Fourier, respectively. As can be seen, Ba0,7Pb0,3TiO3 has an increasing of electron density at the substitute ion position relatively as compared to that of pure BaTiO3. This can be understood mainly because the electron number of Ba atom only 2, 8, 18, 18, 8 and 2 each for K, L, M N, O and P shells, while Pb atom has the electron number of 2, 8, 18, 32, 18 and 4 each for K, L, M, N, O and P shells [10].
Figure 3 shows the observed Fourier maps (above) and the calculated Fourier maps (below), each of Fig. 3a and b have the map size of 10 Å, centered at (000) and Ba at z position of Table 1.
 | |
| Fig. 1: | ( a)Diffraction pattern of pure BaTiO3 from E-Merck and (b) the best sample of Ba1-xPbxTiO3 |
 | |
| Fig. 2: | Observed Fourier maps (above) and calculated Fourier maps (below), each 10 Å in size, centered at (000) and Ba at z position of Table 1. Horizontal line is the [100] direction and vertical line is the (010) direction. Contours represent positive electron density |
Horizontal line is the [100] direction and vertical line is the [001] direction. Contours represent region with positive electron densities while negative one or depletion regions are among these contours. As can be seen in Table 1, not too clear indeed, Fig. 2 and 3 show that lattice parameter for BaTiO3 and Ba0.7Pb0.3TiO3 are a = b ≠ c as indication of tetragonal system. It is clearly seen from Fig. 3 that Ti position of Fig. 3b shifts as compared to that of Fig. 3a according to z position of Ti of Table 1. This shifting is made possible because of the non-centrosymmetric crystal symmetry that is the crystal has no symmetry inversion. Figure 4 shows the observed Fourier maps, horizontal line is the [100] direction and vertical line is the [011] direction, centered at (000) and Ti at z position of Table 1. Contours represent positive electron densities while negative one or depletion regions are among these contours. From Fig. 4, the extended of vertical line is clearly seen because, actually, the [011] axis is the diagonal of the cell unit.
Figure 5 shows the difference Fourier maps, each of Fig. 5a, b have the size of 10 Å, centered at (000) and Ba at z position of Table 1.
 | |
| Fig. 3: | Observed Fourier maps (above) and calculated Fourier maps (below), each 10 Å in size, centered at (000) and Ba at z position of Table 1. Horizontal line is the [100] direction and vertical line is the [001] direction. Contours represent positive electron density |
 | |
| Fig. 4: | Observed Fourier map, horizontal line is the [100] direction and vertical line is the [011] direction, centered at (000) and Ti at z position of Table 1 |
 | |
| Fig. 5: | Difference Fourier maps, horizontal line is the [100] direction and vertical line is the [010] direction, each with the map size of 10 Å, centered at (000) and Ba at z position of Table 1 |
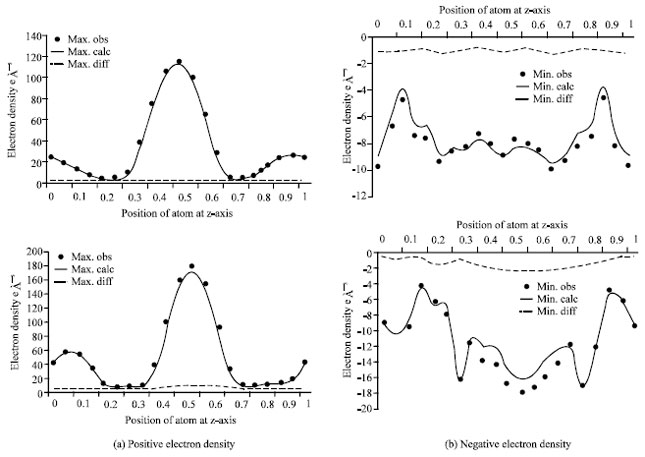 | |
| Fig. 6: | Comparison curves between the observed electron density and the calculated electron density. Curves show that, both for BaTiO3 (above) and Ba0,7Pb0,3TiO3 (below), the calculated structural parameters are correct, marked by the observed maximum peak at the same position with the calculated maximum peak |
As can be seen, there is a significant difference between the two. This difference has been expected because Pb, which has the largest number of electron in Ba0.7Pb0.3TiO3, affects Ti ion. This effect causes Ti ion moving away from O line (Fig. 2 and 3) so that the electrons near O spread away and the contours of Fig. 5b is then simpler as compared to that of Fig. 5a.
Figure 6 shows a comparison between the observed electron density and the calculated electron density. Both curves show that the observed maximum peaks are at the same position with the calculated maximum peaks. These results suggest that the electron density measurement is consistent with the calculated structural parameters.
CONCLUSIONS
Structural parameter refinements show that Ba1-xPbxTiO3 with x (nominal) = 0.5 results x = 0.3, gives the composition of Ba0.7Pb0.3TiO3. The structure remains non-centrosymmetric and isomorphous as that of barium titanate with small contraction in a and b lattice parameters but extension in c-direction with c/a ratio is of 1.03. Electron density analysis shows that there is a consistency between the calculated structural parameters and the electron density measurement with the max. Δρ and min. Δρ 2.662 e Å-3 and B1.190 e Å-3 for BaTiO3 and 7.965 e Å-3 and B2.555 e Å-3 for Ba0.7Pb0.3TiO3, respectively. Final results show that there is an increasing of electron density at the substitute ion position of Ba0,7Pb0,3TiO3, which has max. ρ of 180.069 e Å-3 and 172.105 e Å-3 for the observed and the calculated value, respectively, as compared to that of pure BaTiO3, which has max. ρ of 115.129 e Å-3 and 112.467 e Å-3 for the observed and the calculated value, respectively.
REFERENCES
- Ahluwalia, R., L.A. Lookman, A. Saxena and W. Cao, 2005. Domain-size dependence of piezoelectric properties of ferroelectrics. Phys. Rev., 72: 014112.1-014112.13.
Direct Link - Beck, H.P., W. Eiser and R. Haberkorn, 2001. Pitfalls in the synthesis of nanoscaled perovskite type compounds, Part I: Influence of different sol-gel preparation methods and characterization of nanoscaled BaTiO3. J. Eur. Cer. Soc., 21: 687-693.
Direct Link - Buttner, R.H. and E.N. Maslen, 1992. Structural parameters and electron difference density in BaTiO3. Acta Cryst., B48: 764-769.
CrossRef - DeFrutos, J., A.M. Gonzalez, E. Menendez and M.L. Calzada, 1997. Non-uniform distribution of polarization in Pb0.76Ca0.24 Co0.5W0.5)0.05Ti0.95O3 ceramics produced by defects. J. Mater. Sci. Mater. Elect., 8: 327-331.
CrossRef - Kotechi, D.E., J.D. Baniecki and H. Shen, 1999. Basr TiO3 dielectrics for future stacked capacitor dram. IBM J. Res. Dev., 43: 367-382.
Direct Link