
Sefer Bozkurt
Not Available
Bulent Ozekici
Not Available
Journal of Applied Sciences
Year: 2006 | Volume: 6 | Issue: 15 | Page No.: 3026-3034


ABSTRACT
This study was carried out to determine the effects of different fertigation practices on clogging in in-line emitters using Samandag region well water. The experiment was conducted at the research field of the Samandag Vocational College, University of Mustafa Kemal, Hatay, Turkey, from 2001 to 2002. Three different emitters (1.7, 2.75 and 4.0 L h-1) and three different fertigation treatments (no-fertilizer, MKP+Ca(NO3)2+KNO3+K2SO4+NH4NO3 and NH4NO3+K2SO4+MKP) with flushing and no flushing management groups were evaluated in three replications. Emitter discharge rates were tested at the beginning and at the end of every season to determine emitter flow variations which depend on degree of emitter clogging. The effect of the different fertilizer treatments on emitter clogging was found to be statistically significant. Fertilizers which included both calcium and sulfates resulted in higher clogging effects than the others. Emitters that have the lowest flow rates clogged more than the others. The acid treatment and flushing management decreased emitter clogging but it was not found to be statistically significant.
PDF Abstract XML References Citation
How to cite this article
Sefer Bozkurt and Bulent Ozekici, 2006. The Effects of Fertigation Managements on Clogging of In-line Emitters. Journal of Applied Sciences, 6: 3026-3034.
DOI: 10.3923/jas.2006.3026.3034
URL: https://scialert.net/abstract/?doi=jas.2006.3026.3034
DOI: 10.3923/jas.2006.3026.3034
URL: https://scialert.net/abstract/?doi=jas.2006.3026.3034
INTRODUCTION
Drip irrigation method provides plant water requirements more regularly and frequently when compared to the other irrigation methods (Özekici and Sneed, 1995). It has important advantages over other irrigation methods; nutrients and other chemicals can be applied more frequently and regularly as needed by the plants, which can result in healthier and higher yielding plants (Nakayama and Bucks, 1981).
Drip irrigation was first introduced in Turkey in 1970's. Considerable research has been conducted on drip irrigation since than, particularly in southern Turkey. Now, drip irrigation is a common method of irrigation used in greenhouses and it is rapidly expanding in other agricultural areas such as fruit farms (Kanber, 1997).
Although drip irrigation has many advantages, it also has some limitations. Clogging of the emitters is the most common problem in drip irrigation systems (Bucks et al., 1977). Partially or fully clogging of the emitters lowers irrigation uniformity and affects the plant growth and development adversely. If the necessary precautions are not taken in time, irrigation uniformity, amount of water given to each plant, system maintaining costs, crop yields and crop quality can be affected adversely.
Quality of irrigation water also affects the degree of emitter clogging (Bucks et al., 1979). A high concentration of soluble salts in the water is the most important factor in clogging. When the concentrations of calcium, magnesium, bicarbonate and sulfate are high, of calcium carbonate, calcium sulfate and magnesium sulfate can occur. Calcium carbonate precipitation will also depend on the pH of the water. Precipitation of insoluble salts can also occur due to chemical reactions among the elements added as fertilizers in irrigation water (Tüzel and Anaç, 1991). Precipitated salts can easily clog emitters.
Fertilizers injected into a microirrigation system may contribute to plugging (Pitts et al., 1990). The most important disadvantage of fertigation is precipitation of chemical materials and clogging of emitters (Papadopoulos, 1993). Any fertilizer with calcium should not be used with sulfates together because they could form insoluble gypsum (Pitts et al., 1990; Burt et al., 1995; Burt, 1998).
Hebbar et al. (2004) declared that, in fertigation, use of 100% water-soluble fertilizer is recognized to safe guard the drip system in a long run. The normal fertilizer generally tends to clog the emitters and cause uneven distribution of fertilizers. However, in the study of two years, no clogging of emitters was observed.
Water passage ways in an emitter and speed of water flow were found to be important parameters effecting clogging (Keller and Bliesner, 1990). Emitters with flow area lower than 0.7 mm2 were classified as high sensitive to clogging, emitters with flow area of 0.7-1.5 mm2 were classified as medium sensitive to clogging and emitters with flow area bigger than 1.5 mm2 were classified as low sensitive to clogging (Keller and Bliesner, 1990).
Flushing of irrigation system pipelines is an essential part of the maintenance program required for long-term success with microirrigation. Flushing will prevent accumulation of small particles and their build-up to a size which can plug emitters. Flushing frequency can vary according to both amount of flushing material and quality of the irrigation water, because of this laterals should flushed at least once a month (Smajstrla and Boman, 1999).
Without proper flushing, expensive trickle irrigation systems can become ineffective in a short time. In turn, discouraged growers return back to the other irrigation systems which have lower irrigation uniformities (Özekici, 1998).
The aim of this study was to determine the effects of different fertilizers on emitter clogging in drip irrigation and also to suggest solutions to decrease the clogging of emitters.
MATERIALS AND METHODS
The research was conducted at a tomato greenhouse at the research field of Samandağ Vocational College, University of Mustafa Kemal, Hatay, in three consecutive seasons (spring, 2001, fall 2001 and spring 2002). The greenhouse was located in the coastal area of Samandağ, 600 m away from the Mediterranean Sea (36o 08' N; 35o 54' E) at altitude of 3 m above sea level. During the study, average, maximum and minimum temperatures inside of the greenhouse were 22.9, 42.2 and 2.4°C, respectively.
The water source was a 9 m deep well. The irrigation water, which affects emitters’ performance, was analyzed and classified by Bucks et al. (1979) according to clogging capacity at the beginning of each growing season. EC, TDS and pH were measured with EC meter (YSI-3200) and pH-meter (WTW-526), respectively. Determination of CO3, HCO3 and Cl was carried out by titration tests. Contents of Na - K and Ca - Mg - Mn were measured with flame photometer (Jenway-PFP7) and ICP-AES (Varian liberty series II, axially-viewed), respectively. Total Fe was measured with Merck (SQ 118) labeled device by photometric method. Hydrogen sulfite was determined by chemical extraction methods. Bacterial population was determined analytically in water samples. Water samples were taken from water source and were bottled with sterile tubs. Tubs were isolated from light and temperatures to prevent bacterial growth during the analyses.
Drip irrigation system was used in the experiment. Control unit of the irrigation system was set up with sand separator, screen filter with 200 meshes, fertilizer tank with 100 L capacity and a pump, water meter, valves and manometers. Submain pipeline which had ball valves and pressure regulators at the inlets were located for applying each fertilizer forms separately. In the system, three different laterals with different in-line emitters were used (Table 1).
The experimental design was set up in split-strip plots with three replications. Main plots included fertilizer treatments (F1 and F2) and control (F0). Main plots were split by two different managements which included flushing (M1) and pH regulations and with no flushing (M0-control) and pH regulations. In these plots, three different laterals with different emitters (E1, E2 and E3) were placed with three replications (Fig. 1). All factors in the experiment are given in detail below.
F0, control plots, included only irrigation water application (no fertilizer).
| Table 1: | Technical properties of laterals and emitters in the experiment |
 | |
| *Found by measurement or tests. E: Emitters, CVm: Coefficient of manufacturing variation, EUd: Design emission uniformity, qmean: Average flow rates, Us: Statistical uniformity | |
 | |
| Fig. 1: | Graphical layout of experiment plan |
F1, total nitrogen was given as 25% sulfate and 75% nitrate forms with Ammonium Nitrate (NH4NO3), Calcium Nitrate (Ca(NO3)2), Potassium Nitrate (KNO3), Potassium Sulfate (K2SO4) and Mono Potassium Phosphate (MKP).
F2, total nitrogen was given as 50% sulfate and 50% nitrate forms with NH4NO3, K2SO4 and MKP.
M0, control plots, no pH adjustment and flushing were performed throughout all irrigation seasons.
M1, pH adjustment was used to keep the pH value of the irrigation water about 6-6.5 level. For achieving this level, a concentration of 1 mg L-1 phosphoric acid was injected in every irrigation depending on the water-phosphoric acid titration test results made in laboratory. Flushing was performed only once at the end of the each season with 5 mg L-1 phosphoric acid solution.
E1, emitters with 2.75 L h-1 discharge rate.
E2, emitters with 4.0 L h-1 discharge rate.
E3, emitters with 1.7 L h-1 discharge rate.
Lengths of all laterals were 23 m and they were placed 50 cm away each other.
Fertigation was applied as recommended by Bar-Yosef (1991), where amount of NPK should be 450, 95 and 943 kg ha-1 200 day as pure elements, respectively. Fertilizers were applied with every irrigation application. Fertilizers were applied according to plant growing stages in the experiment. Different amounts of fertilizer were applied each season because plant growing stages differ from season to season. Fertigation was achieved by Burt et al. (1995) methods. Total applied amount of fertilizers in F1 and F2 treatments were given in Table 2. Irrigation water was applied in control (F0) treatment but fertilizer was not applied in this treatment.
The amount of irrigation water applied was based on free surface evaporation from a Class A Pan. Manufacturing, placement and management of this pan were based on rules described by Richard et al. (1998). Irrigation water was applied in par with the pan evaporation. Irrigation was started when the soil water matric potential was less than -25 kPa as measured with a tensiometer located 30 cm below the soil surface.
The first growing season (S1) was 145 days. In this season, 309.1 mm of total irrigation water was given with twelve irrigations. The second growing season (S2) was 165 days and a total of 216 mm irrigation water applied with eleven irrigations. Third growing season (S3) was 101 days and 292 mm of total irrigation water was applied with ten irrigations.
Emitters discharge rates were tested at the beginning of the experiment according to ASAE standards (1998). During the tests, laterals were raised 20 cm from the ground without elevation differences, irrigation water pressures in the lateral were adjusted according to manometers value at the beginning and end of the laterals by placing ball valves.
| Table 2: | Applied fertilizer quantity based on treatments (kg/ha-1 season) |
 | |
| S: Season F: Fertilizer treatment MKP: Mono potassium phosphate | |
Emitter flow variations were determined twice at the beginning (BS) and end of the (ES) each season for predetermined 50 emitters from each lateral. To determine the flushing effects, emitters discharge rates were tested at the end of the season before (ESBF) and after (ES) the flushing. During the tests, water temperatures were measured but since the emitters have turbulent flows, the effects of water temperature on discharge rates were ignored (Wu and Phene, 1984; Peng et al., 1986).
Flushing applications were not performed in M0 (control) treatments. Flushed water coming out of the lateral ends were collected and filtered by filter paper in M1 treatments. Amount of collected deposits were determined gravimetrically according to treatments.
All laterals in the experiment were cut and remaining deposits which had clogged the emitters were collected in each treatment separately to determine the causes of the emitters clogging. Physical and biological materials, which cause clogging, were determined by weighting device and lightened stereo microscope respectively. Chemical clogging, remaining deposits in the emitters; phosphor was determined by SQ 118 Merck labeled device and its related kits with photometric method, lime was determined by calcimeter, magnesium (Mg) was determined by ICP-AES device, potasyum (K) was measured with flame photometer (Jenway-PFP7) and sulphur (SO4) was calculated by subtracting total anion from total cation after the completion of analyses of anions-cations.
RESULTS AND DISCUSSION
The irrigation water used in this experiment fall into high risk class regarding pH, hydrogen sulfite and bacterial population and average risk class regarding dissolved materials and low risk class regarding Mn, total Fe and suspended materials according to clogging capacity (Table 3).
More solubility difficulties were observed in K2SO4 and CaNO3 fertilizers in winter than the spring.
| Table 3: | Average values of irrigation water quality in seasons |
 | |
| S: Season | |
Solubility of fertilizer could differ due to water temperatures. Some researchers reported similar statements that high concentrations of fertilizer application with drip irrigation, depending on the type of fertilizer and irrigation water temperatures, result in serious clogging problems. Therefore, lower concentrations of fertilizers with higher frequencies are more suitable in colder climates (Pitts et al., 1990; Hochmuth and Smajstrla, 1991; Burt et al., 1995).
In general, sources of accumulated materials in laterals are suspended materials, injected chemicals and their combined precipitates. In the experiment, since different amounts of water and chemicals were applied among season, amount of accumulated materials in laterals were different (Table 4). Total remaining material accumulation in laterals were 50.41 g in first season, 41.97 g in second season and 38.49 g in third season.
At the end of the experiment, maximum material accumulation was in E3 laterals (72.11 g), which had the lowest emitter discharge rate and the minimum material accumulation was in E2 laterals (18.77 g), which had the highest emitter discharge rate. Any material, which could pass through the filter during irrigation, could easily discharge from emitters with larger outlets than emitters with smaller outlets. Therefore, less material accumulation was occurring in emitters. On the other hand, emitters with smaller outlets could catch suspended materials in the system by acting as a filter. Similarly, Hochmuth and Smajstrla (1991) reported that emitters with bigger discharge rate could irrigate plant root zone more quickly and be less sensitive to clogging. However, emitters with smaller discharge rates allow longer lateral lengths and are more sensitive to the clogging.
Variance analysis was done to determine the effect of treatments on deposit accumulation. Season, fertilizer, lateral, season x fertilizer, fertilizer x lateral interactions were significant at 0.1% level and season x fertilizer x lateral interaction was significant at 5% level (Table 5).
| Table 4: | Amount of flushing deposits in laterals (g) |
 | |
| S: Season. F: Fertigation treatment (F0: Control plots). E: Emitter treatment | |
| Table 5: | Analysis of variance table for total accumulated materials in the laterals |
 | |
| *p<0.05, ***p<0.001 S: Season, F: Fertigation treatment E: Emitter treatment | |
| Table 6: | Tukey's honestly significant difference test results of flushing deposits in the laterals among season x fertilizer x lateral interactions(A) |
 | |
| (A)Data are the mean values of three samples in M1 treatments. *Different letters in the table indicate significant differences at p<0.05. S: Season F: Fertigation treatment (F0: control plots) E: Emitter treatment | |
Means of the M1 treatment were analyzed by Tukey's Honestly Significant Difference Test. Season x fertilizer x lateral interactions had twelve statistical groups with 95% confidence level. The highest accumulation was in S1F1E3 interaction and the lowest accumulations were in S3F2E2, S3F0E1, S3F0E2, S3F1E2, S2F0E2, S2F0E1 and S1F0E2 interactions (Table 6).
Number of clogged emitters in each treatment was calculated as percentages at the end of the experiment. Also, the degree of emitter clogging for each treatment were calculated based on percent reduction in discharge rates of each emitter and eight clogging ratio class were formed for each treatment (Fig. 2A-C).
 | |
| Fig. 2: | Number of clogged emitter and reductions in emitter discharge rates in the E1, E2 and E3 emitters at the end of the experiment |
In control treatment (F0M0), 74% of E1, 95% E2 and 49% E3 emitters showed 0-5% discharge rate decrease due to clogging. Emitters of E3 showed up to 50% discharge rates decrease. 4% of E1 in F1M0 groups, 0.67% of E2 in F2M0 and 0.67% of E2 in F2M1 groups, 14.02% of E3 in F1M0 and 13.34% of E3 in F1M1 groups showed maximum (%25-100) discharge rate decrease due to clogging.
Although flushing application had reclaimed some of the clogged emitters and increased emitter discharge rates, this was not found to be significant statistically.
In the experiment, the emitters at the end of the lines experienced a higher percentage of clogging than those in the beginning or in the middle of the lateral. Some researchers such as Adin and Sacks (1991) and Ravina et al. (1992) declared similar findings in their studies. When emitters, which had clogging and decreased flow rates at some percentages, were evaluated, the highest clogging and thereby lowest flow rates were observed in F1 applications. Moreover, the E3 emitters, which had relatively smaller outlets, tend to have more clogging and lower flow rates. As the emitter exits get larger, clogging decreased and flow rates increased. These results are in good agreement with the findings of Keller and Bliesner (1990). Similarly, Capra and Scicolone (2004) declared that in-line labyrinth emitters in pipes with a smaller diameter were more sensitive to clogging than same kind of emitters in pipes with a greater diameter.
Physical, chemical and biological factors and amount of materials, which caused clogging in emitters and their chemical compositions are presented in Table 7. There was less material deposits in M1 than M0 (control) treatments. There were more material deposits at the end of the laterals. It was found by microscopic observations that deposits in emitters were soil particles, plant residuals, algea, bacteria and chemical precipitation such as lime. Chemical and biological analysis of these deposits could be performed but physical identification of these compounds could not be achieved since amounts of these deposits were not enough for segregation. However, it was assumed that the 200-mesh filter could catch all sand particles in water. Because of this, the residues in emitters might be constituted of silt, clay and organic gunk. The silts and clay particles would pass through a 200-mesh filter, but it was determined that the flushing treatments (M1) could remove many of them (Table 7). Because no chlorination was done, the organic component could well pass through the 200-mesh filter and grow in the lines.
Outlets of some emitters were clogged by soil particles. Some of the emitter clogging was temporary especially in M1 treatments. Main causes of physical clogging were suspended materials and sand particles, which could not pass through emitter passages (Pitts et al., 1985).
Although it is difficult to determine the effect of water and fertigation application on chemical clogging separately, the highest percentage of chemical deposits in emitter was due to lime. Maximum percentage of lime (36.7%) was determined in F1M0. When flushing and acid treatment (M1) was performed in same treatments lime percentage decreased to 22.3% (in F1M1 treatment) (Table 7). This decrease indicates that the percentage of lime precipitates in all residues decreased about 15% but the total lime quantity decreased about 60%.
Hills et al. (1989) declared that the precipitation and accumulation of calcium carbonate is the most common causes of emitter clogging in drip irrigation systems. In the experiment, lime precipitation could be seen by naked eyes, especially in F1 treatments (Fig. 3). Precipitation was also observed outside the emitter water outlets. Occurrence of lime precipitation was observed in emitters because the temperatures in greenhouse were higher than outside. Black polyethylene pipes were used in the experiment and the greenhouse was heated in winter. Similarly, Lizanne and Patrick (2001) indicated that the speed of precipitation and accumulation increased as water got warmer in black polyethylene drip line.
In laboratory analyses, reddish-brown deposits were observed in some emitters. Chemical analysis of these deposits could not be performed because amount of this deposits were not enough for analyses. However, Bar (1995) identified this type accumulation in emitter is due to Fe precipitation.
| Table 7: | Chemical composition and the amounts of deposits in emitters |
 | |
| (*) “Others” contains silt, clay and organic gunk which could not segregated each others, F: Fertigation treatment (F0 and M0: control plots), M: Flushing and pH adjustment treatment | |
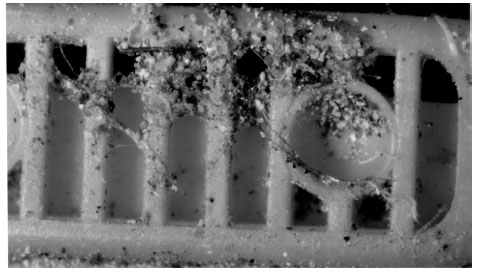 | |
| Fig. 3: | Lime precipitation in the emitter at the end of the test |
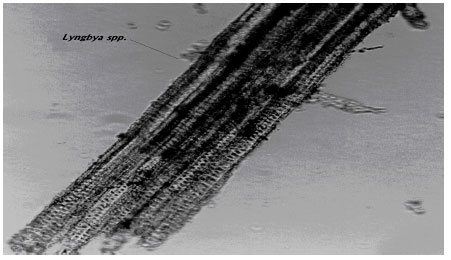 | |
| Fig. 4a: | Bacteria in emitters (forming bacteria colonies) |
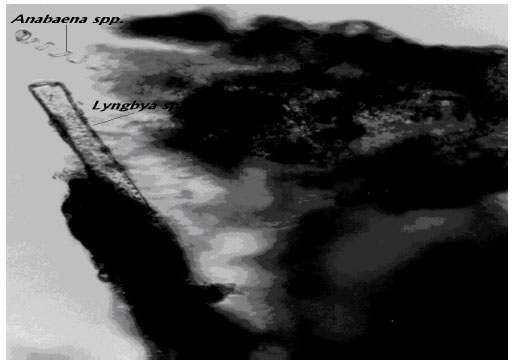 | |
| Fig. 4b: | Bacteria in emitters (flocculating clay like substances by their sticky effects) |
Since the irrigation water contains Fe, it is assumed that this precipitation could be due to Fe. Similarly, Gilbert and Ford (1986) reported that dissolved Fe and Mn can form precipitation and oxidation and later their accumulation could clog the emitters. Certain bacteria can cause enough precipitation of manganese, sulphur and iron compounds which cause emitter plugging (Pitts et al., 1990).
Lyngbya and Anabaena bacteria were observed in samples of accumulated materials in emitters by lightened stereo microscopic observation (Fig. 4a-b). Bacteria affect the emitter clogging by forming bacteria colonies (Fig. 4a) and flocculating clay like substances by their sticky effects (Fig. 4b). This type of clogging due to microscopic slimes was also reported by Ford and Turker (1974) and Adin (1987).
CONCLUSIONS
Fertigation could be one of the main causes of emitter clogging in drip irrigation system. The type of fertilizer used affects the amount of clogging. Ca and SO4 fertilizers especially can cause more clogging. In this experiment, the highest percentage of clogging was observed in smaller emitter flow rates. Thus, choosing emitters with the higher discharge rates must be important.
There were no significant differences between flushing applications statistically but these applications reduced emitter discharge rate decreases. Further research should be conducted to determine the effect of flushing application on emitter clogging.
ACKNOWLEDGMENTS
We would like to thank Dr. M.K. Sangün and Dr. S. Bargu for their help in the chemical and biological analyses of water samples. We are also grateful to the reviewers for their perceptive comments and corrections on the manuscript.
REFERENCES
- Adin, A., 1987. Clogging in irrigation systems reusing pond effluents and its prevention. Water Sci. Technol., 19: 323-328.
Direct Link - Adin, A. and M. Sacks, 1991. Dripper-clogging factors in wastewater irrigation. J. Irrig. Drainage Eng., 117: 813-826.
CrossRef - Hebbar, S.S., B.K. Ramachandrappa, H.V. Nanjappa and M. Prabhakar, 2004. Studies on NPK drip fertigation in field grown tomato (Lycopersicon esculentum Mill.). Eur. J. Agron., 21: 117-127.
CrossRefDirect Link - Ozekici, B. and R.E. Sneed, 1995. Manufacturing variation for various trickle irrigation on-line emitters. Applied Eng. Agric., 11: 235-240.
Direct Link - Papadopoulos, I., 1993. Agricultural and environmental aspects of fertigation-chemigation in protected agriculture under Mediterranean and arid climates. Proceedings of the Symposium on Environmentally Sound Water Management of Protected Agriculture under Mediterranean and Arid Climates, July 16-18, 1993, Bari, Italy, pp: 1-33.
- Peng, G.F., I.P. Wu and C.J. Phene, 1986. Temperature effects on drip line hydraulics. Trans. ASAE, 29: 211-215.
Direct Link - Ravina, I., E. Paz, Z. Sofer, A. Marcu, A. Shisha and G. Sagi, 1992. Control of emitter clogging in drip irrigation with reclaimed wastewater. Irrig. Sci., 13: 129-139.
CrossRefDirect Link