
Serdal Terzi
Faculty of Technical Education, Suleyman Demirel University, Isparta 32260, Turkey
Journal of Applied Sciences
Year: 2006 | Volume: 6 | Issue: 1 | Page No.: 193-197


ABSTRACT
The term present serviceability was adopted to represent the momentary ability of pavement to serve traffic and the performance of the pavement was represented by its serviceability history in conjunction with its load application history. Serviceability was found to be influenced by longitudinal and transverse profile as well as the extent of cracking and patching. The amount of weight to assign to each element in the determination of the over-all serviceability is a matter of subjective opinion. In the present study, a regression tree model has been presented for determining flexible pavement surface layer thickness. The model, RT was selected as estimating method. Results show that wearing course thickness of flexible pavement regression values of the regression tree model is better than that of the AASHO model. This approach can be easily and realistically performed to solve the optimization problems which do not have a formulation or function about the solution.
PDF Abstract XML References Citation
How to cite this article
Serdal Terzi, 2006. Modeling the Pavement Present Serviceability Index of Flexible Highway Pavements Using Data Mining. Journal of Applied Sciences, 6: 193-197.
DOI: 10.3923/jas.2006.193.197
URL: https://scialert.net/abstract/?doi=jas.2006.193.197
DOI: 10.3923/jas.2006.193.197
URL: https://scialert.net/abstract/?doi=jas.2006.193.197
INTRODUCTION
The pavement management concept was first conceived in the mid-1960’s to organize and coordinate the activities involved in achieving the best value possible for the available funds[1]. In response to the growing need for highway rehabilitation and maintenance on one hand and shrinking resources on the other, there has been an increased interest in developing a formal management approach to optimize the utilization of highway construction and maintenance resources. The specific component of this approach related to pavement is termed Pavement Management System (PMS)[2,3].
Hence optimizing the current pavement condition evaluation practice will be the first and foremost task of efficient pavement management systems[4].
Setting priorities for pavement maintenance and rehabilitation depends on the availability of a universal scale for assessing the condition of every element in the network. The condition of a pavement section has traditionally been assessed by several condition indexes. The Present Serviceability Index (PSI) is one common evaluator used to describe the functional condition with respect to ride quality. Pavement Condition Index (PCI) is another index commonly used to describe the extent of distress on a pavement section[5].
Pavement Condition Rating (PCR) method is based upon visual inspection of pavement distresses. Although the relationship between pavement distresses and performance is not well defined, there is general agreement that the ability of a pavement to sustain traffic loads in a safe and smooth manner is adversely affected by the occurrence of observable distress. The rating method provides a procedure for uniformly identifying and describing, in terms of severity and extent, pavement distress. The mathematical expression for PCR provides an index reflecting the composite effects of various distress types, their severity and extent upon the overall condition of the pavement[6].
Prediction of future pavement condition is not only essential for maintenance budget forecasting at the network level but also for determining the most cost-effective rehabilitation strategy at the project level[4]. The knowledge of future pavement performance is essential to sound pavement design and life-cycle economic evaluation at the project level of pavement management. At the network level, such information is important to ensure adequate financial funding and budgeting[7].
Pavement failure is a highly variable event that not only depends on layer material properties, environmental and subgrade condition and traffic loading, but also on the specific definition of failure adopted by the highway agency. Failure can be defined in terms of amount of cracking, rut depth, surface roughness, or combinations of these or other indicators of performance[8].
Knowledge discovery uses data mining and machine learning techniques that have evolved through a synergy in artificial intelligence, computer science, statistics and other related fields. Although there are technical differences, the terms machine learning, data mining and Knowledge Discovery and Data Mining (KDD) are often used interchangeably[9].
Data Mining is often defined as the process of extracting valid, previously unknown, comprehensible information from large databases in order to improve and optimize business decisions[10]. In others definition Data Mining is defined as the identification of interesting structure in data, where structure designates patterns, statistical or predictive models of the data and relationships among parts of the data[11].
PRESENT SERVICEABILITY INDEX
Performance is general term for how pavements change their condition or serve their intended function with accumulating use[12]. The evaluation of pavement performance involves a study of the functional behavior of a selection or length of pavement. For a functional or performance analysis, information is needed on the history of the riding quality of the pavement section for the time period chosen and the traffic during that time. This can be determined by periodic observations or measurements of the pavement riding quality coupled with records of traffic history and time. It is this history of deterioration of the ride quality or serviceability provided to the user, which defines pavement performance as shown in Fig. 1[13].
In order to define performance, a new concept was evolved founded on the principle that the prime function of a pavement is to serve the traveling public. The term present serviceability was adopted to represent the momentary ability of pavement to serve traffic and the performance of the pavement was represented by its serviceability history in conjunction with its load application history. Though the serviceability of a pavement is patently a matter to be determined subjectively, a method for converting it to a quantity based on objective measurements is given in the next two sections[14].
Rating of pavements in service: Serviceability was found to be influenced by longitudinal and transverse profile as well as the extent of cracking and patching. The amount of weight to assign to each element in the determination of the over-all serviceability is a matter of subjective opinion. Furthermore, the degree of serviceability loss to be associated with a given change in any one of these elements depends on subjective judgment. To obtain a good estimate of the opinion of the traveling public in these subjective matters a Pavement Serviceability Rating Panel was appointed.
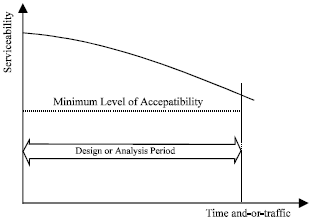 | |
| Fig. 1: | Deterioration of ride quality or serviceability[13] |
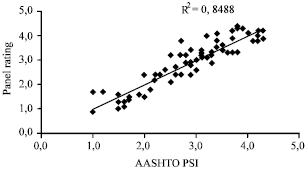 | |
| Fig. 2: | Regression curve of panel rating and PSI |
This panel included highway designers, highway maintenance men, highway administrators, men with materials interests, trucking interests, automobile manufacturing interests and others. These men made independent ratings of the ability of 138 sections of pavement located three states, to serve high speed, mixed truck and passenger traffic. The members were instructed to use whatever system they wished in rating each pavement and to indicate their opinions of the ability of the pavement to serve traffic at the time of rating on a scale ranging from 0 to 5 with adjective designations of very poor (0-1), poor (1-2), fair (2-3), good (3-4) and very good (4-5). For each section the mean of the independent ratings of the individual panel members was taken as the section’s present serviceability rating. Equation 1 was used to determine the level of serviceability of the flexible pavement sections.
| (1) |
Where:
| PSI | : | The present serviceability index; |
| SV | : | The mean of the slope variance in the two wheel paths; |
| C + P | : | As measure of cracking and patching in the pavement surface and |
| RD | : | A measure of rutting in the wheelpaths14]. Fig. 2 shows relationship of pavement serviceability panel rating and PSI. |
DATA MINING
Data mining process generally involves phases of data understanding, data preparation, modeling and evaluation[15]. It is a hybrid disciplinary that integrates technologies of databases, statistics, machine learning, signal processing and high-performance computing. This rapidly emerging technology is motivated by the need for new techniques to help analyze, understand or even visualize the huge amounts of stored data gathered from business and scientific applications. The major data mining functions that are developed in commercial and research communities include summarization, association, classification, prediction and clustering[16].
Data understanding starts with an initial data collection and proceeds with activities to get familiar with the data, to identify data quality problems and to discover first insights into the data. Data preparation covers all activities that construct the final dataset to be modeled from the initial raw data. The tasks of this phase may include data cleaning for removing noise and inconsistent data and data transformation for extracting the embedded features[15]. Successful mining of data relies on refining tools and techniques capable of rendering large quantities of data understandable and meaningful[17]. The modeling phase applies various modeling techniques, determines the optimal values for parameters in models and finds the one most suitable to meet the objectives. The evaluation phase evaluates the model found in the last stage to confirm its validity to fit the problem requirements. No matter which areas data mining is applied to, most of the efforts are directed toward the data preparation phase[15].
A good relational database management system will form the core of the data repository and adequately reflect both the data structure and the process flow and the database design will anticipate the kind of analysis and data mining to be performed. The data repository should also support access to existing databases allowing retrieval of supporting information that can be used at various levels in the decision making process[18].
Data mining is a powerful technique for extracting predictive information from large databases. The automated analysis offered by data mining goes beyond the retrospective analysis of data. Data mining tools can answer questions that are too time-consuming to resolve with methods based on first principles. In data mining, databases are searched for hidden patterns to reveal predictive information in patterns that are too complicated for human experts to identify[19]. Data mining is applied in a wide variety of fields for prediction, e.g. stock-prices, customer behavior, production control. In addition, data mining has also been applied to other types of scientific data such as bioinformatical, astronomical and medical data[15].
Regression trees: Classification and Regression Trees (CART), introduced by Breiman et al.[20] is a statistical technique that can select from a large number of explanatory variables (x) those that are most important in determining the response variable (y) to be explained[21]. A regression tree is built through a process known as binary recursive partitioning. This is an iterative procedure in which a heterogeneous set of training data consisting of multiple classes is hierarchically subdivided into progressively more homogeneous clusters using a binary splitting rule. The algorithm chooses the split that partitions the data into two parts such that it minimizes the sum of the squared deviations from the mean in the separate parts. This splitting is then applied to each of the new branches. The process continues until each node reaches a user-specified minimum node size and becomes a terminal node. Indeed, the regression tree is especially useful in the multi-dimensional cases. Furthermore, the regression tree has the advantage that it works also when the regression variables are a mixture of categorical and continuous variables. The response variable is assumed to be a continuous variable[22].
MODELING WITH DATA MINING
After RT calculations were performed, results obtained from RT approaches were compared with measured values for data sets. Figure 3 shows structure of RT model.
Figure 4 shows the comparison between measured values and the results of RT. It can be seen that RT results are close to measured values.
As a summary of this study:
| • | RT model can solve the problem using data set without using any pre-assumption. |
| • | RT gives high regression coefficient. |
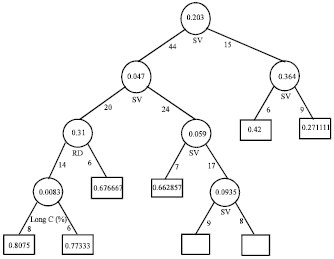 | |
| Fig. 3: | Structure of regression tree |
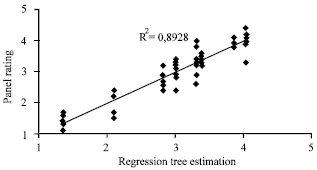 | |
| Fig. 4: | Comparison of the panel rating versus regression tree |
CONCLUSIONS
In the present study, a regression tree model has been presented for determining flexible pavement surface layer thickness. The model, RT was selected as estimating method. Results show that wearing course thickness of flexible pavement regression values of the regression tree model is better than that of the AASHO model.
Some models used for this type of problems are based on some simplifying assumptions that cannot reflect the reality. Solutions of the problems which do not have a formula or function about the solution can be easily and realistically performed using these approaches presented here.
This new methodology can help the highway agency in estimating pavement serviceability values using distresses measurements.
REFERENCES
- Rada, G.R., J. Perl and W. Witczak, 1986. Integrated model for project-level management of flexible J. Transportation Eng., 112: 381-399.
CrossRef - Tavakoli, A., M.L. Lapin and L. Figueroa, 1992. PMSC: Pavement management system for small communities. J. Transportation Eng., 118: 270-280.
CrossRef - Bandara, N. and M. Gunaratne, 2001. Current and future pavement maintenance prioritization based on rapid visual condition evaluation. J. Transp. Eng., 127: 116-123.
CrossRefDirect Link - Fwa, T.F. and K.C. Sinha, 1986. Routine maintenance and pavement performance. J. Transp. Eng., 112: 329-344.
CrossRef - Madanat, S., J.A. Prozzi and M. Han, 2002. Effect of performance model accuracy on optimal pavement design. Comput. Aided Civil Infrastruct. Eng., 17: 22-30.
Direct Link - Goodwin, L., M. Van Dyne, S. Lin and S. Talbert, 2003. Data mining issues and opportunities for building nursing knowledge. J. Biomed. Inform., 36: 379-388.
Direct Link - Braha, D. and A. Shmilovici, 2002. Data mining for improving a cleaning process in the semiconductor industry. IEEE Trans. Semiconductor Manuf., 15: 91-101.
CrossRefDirect Link - Fayyad, U.M. and R. Uthurusamy, 2002. Evolving data mining into solutions for insights. Commun. ACM, 45: 28-31.
Direct Link - Rupp, B. and J. Wang, 2004. Predictive models for protein crystallization. Methods, 34: 390-407.
CrossRefDirect Link - Hoffmann, D. and J. Apostolakis, 2003. Crystal structure prediction by data mining. J. Mol. Struct., 647: 17-39.
CrossRefDirect Link - Questier, F., R. Put, D. Coomans, B. Walczak and Y.V. Heyden, 2005. The use of cart and multivariate regression trees for supervised and unsupervised feature selection. Chemometrics Intell. Lab. Syst., 76: 45-54.
Direct Link - Liu, W. and E.Y. Wu, 2005. Comparison of non-linear mixture models: Sub-pixel classification. Remote Sensing Environ., 94: 145-154.
CrossRef