
Jacob Kporfor
Not Available
Cheng Jiaguo
Not Available
Journal of Applied Sciences
Year: 2005 | Volume: 5 | Issue: 7 | Page No.: 1299-1305


ABSTRACT
Increasing cost of mineral exploration ventures over the time necessitates considerations of other innovations especially in delineating potential zones at the reconnaissance stage of mineral assessment. This study demonstrated the application of Weight of evidence model in delineating a very large and inaccessible area of 69052 sq.km in the northwestern part of Yunnan Province. The geological data sets compiled for the study includes, digital database of the following: geochemical stream sediment sampling results, lineament extracted from four landsat images, geological periods of the lithologies and mineral occurrences. The following preprocessing were meted to the data before weighting. Factor analysis was applied to the geochemical data, briefly illustrated, the geological period were reclassified and the lineaments were put into grid and the lineament density obtained and contoured before weighting. The selected three suitable diagnostic criteria; lineament, lithological ages and geochemical data sets were integrated using Weight-of-evidence model on 27 known hydrothermal deposits point to prepare the favorability map. The result of the prediction indicated a successful implementation of the model using the three recognition criteria above and also suggested new areas for a follow up exploration ventures.
PDF Abstract XML References Citation
How to cite this article
Jacob Kporfor and Cheng Jiaguo, 2005. Regional Hydrothermal Copper Prediction Using Weight of Evidence Model in Northwestern Yunnan. Journal of Applied Sciences, 5: 1299-1305.
DOI: 10.3923/jas.2005.1299.1305
URL: https://scialert.net/abstract/?doi=jas.2005.1299.1305
DOI: 10.3923/jas.2005.1299.1305
URL: https://scialert.net/abstract/?doi=jas.2005.1299.1305
INTRODUCTION
The purpose of this study was to demonstrate the use of weight of evidence model as a choice in delineating potential areas in a very vast area of 69052.1 sq.km in the northwestern Yunnan Province. The main objectives were to evaluate effectiveness of the model in predicting regional hydrothermal copper deposit in the study area; to determine and evaluate the spatial associations between the copper bearing occurrences and variety of regional-scale geoscientific data; to determine the first order diagnostic recognition criteria for recognition the mentioned deposit type. The area is renowned in its mineral endowment, but the complexity of the topography makes it difficult to access. The use of quantitative mathematical methods is becoming very popular in solving these problems[1,2] The technique originally developed in a non-spatial context for medical[2] diagnosis and has been modified by Bonham-Cater et al.[1] to deal with spatial prediction-diagnosing mineral deposits using the symptoms of various geological phenomena.
Since the early 1990’s computer-based Geographic Information Systems (GIS) applications has become an integral part of many mineral resource exploration programs[3]. A GIS is an integrated system of hardware, software and methodologies for the management of spatial (georeferenced) data. It facilitates data compilation and synthesis and permits exploratory analysis and modeling Evaluation of geosciences data with GIS can provide support for various geological investigations and aid decision-making processes, such as determining successful and cost-effective exploration or management strategies.
Three geological data set have been integrated using the above model to predict potential areas for hydrothermal copper prospects. The study reviews briefly on the regional geological setting and mineralization, applied factor analysis to the geochemical data to select only area associated with hydrothermal deposit through the minerals associations to avoid including area of different genetic types of copper mineralization. Flavorability has been produced indicating new areas for further prospecting.
WEIGHT OF EVIDENCE MODEL
The model is based on a probability framework on a set of theory[2] in which case the idea of posterior probability is emphasized. Considering mineral resource assessment, lets assume that a hypothesis (H) about the probability of mineral deposits of a series type D of a study area is related to a set of evidences X(X={ X1, X2…Xn}); and X1, X2…Xn which are conditionally independent with each other.
The probability of occurrence of mineral of type D without the consideration of any known evidence information is the prior probability (P{D}). The probability of occurrence of mineral deposit of type D given the condition of existing X in the study area is the posterior probability (P{D/X}).
The odd probability (O{D}) is the ratio of the probability that an evidence occur P{D}; to the probability that it does not occur, such as ![]() .
.
Expressed as:
| (1) |
Based on the hypothesis H on D with given X, its odd is:
| (2) |
In ordinary weights of evidence model X1 in the X need be divided into subsets, which can be expressed in terms of set of theory.
A (presence or true ) and ![]() (absence or false). The two subsets have following purposes.
(absence or false). The two subsets have following purposes.
| (3) |
| (4) |
With the definitions and the properties of binary pattern outlined above, the following equations can be deduced:
 | (5) |
 | (6) |
 | (7) |
If Xi is present:
is called sufficient ratio (LS). Otherwise, it is called necessity ratio (LN). Corresponding to the natural logarithm of LS is the weight of positive weight of evidence(W+) and the natural logarithm of LN is the negative weight of evidence (W¯). For convenience let Wo denote the natural logarithm of O{D}.
Thus the Eq. (6) and (7) can be written as
| (8) |
 | (9) |
The posterior probability P{D/X} can be converted from the equation above as follows:
| (10) |
The values of P{D/X} calculated with using Eq. (7) are identical to those calculated directly using Eq. (5).
The advantage of using the conditional probability expressions (5 or 8) is that the weights are easier to be interpreted than the probability factors.
In most applications of ordinary Weight of evidence model, the contrast C is defined as Eq. (1.11) and used to select the cut-off to divide continuous variables into binary patterns
| (11) |
In general, absolute weights values between 0 and 0.5 are mildly predictive; values 0.5 and 1 are moderately predictive ;values between 1 and 2 are strongly predictive and greater than 2 are extremely predictive.
Geological setting: Yunnan Province is located in the Himalayan fold belt. It is characterized by complex geological structures, perfectly developed strata, frequent magmatic activities and various degree of metamorphism. The province consists of dominant basaltic lavas and subordinate pyroclastic rocks an example the Permian Emeishan Basalt Formation that is one of Earth’s LIPs (large igneous provinces). The Emeishan volcanic successions unconformably overlie the late Middle Pemian carbonate formation (i.e. the Maokou limestone) and are in turn covered by the upper Triassic or Jurrassic sediment in the central part. The early Permian thick carbonate sequence began to deposit as response to extensive transgression and basin subsidence. The Yangtse-craton was separated by an unconformity which formed as a response of the Dongwu movement. It consists of Proterozoic metamorphic rocks overlain by a thick Cambrian-Triassic carbonate and shale sequence. In the Devonian, the SW margin of the craton underwent extensional faulting, deposition of a thick sequence of Devonian-Triassic marine sedimentary rocks and in a few places eruption of basalts. These rocks were uplifted and folded during the Early Jurassic to Latest Cretaceous (190-65 Ma) Yanshanian orogeny, which formed as a response to subduction of the Pacific Plate under the Eurasian plate movement. The process of splitting and amalgamation took place from time to time in this region, which resulted in the formation of three main ore-bearing strata. Three main metallogenetic models can be described as three types of deposits, magmatic, metamorphic and tectonic mobile zone.
Mineralization: The known copper, gold, lead-zinc, silver and molybdenum occurrence in the study area occur in several forms, hydrothermal, epithermal, hypothermal, mesothermal, magmatic, volcano-sedimentary, strata-bound, skarn and saline lake deposits. The host rocks in most cases are shale, carbonates, sandstone, conglomerate and partially altered andesine. The principal alteration processes are decalcification, silification, sericitization, sulfurdation, epidotization and chloritization.
Porphyry-type the most common type in the area occurs when large amounts of hot water carrying small amounts of metals pass through permeable rocks and deposits the metals. They are located mainly in two settings within the area, the orogenic belts; at island arcs and at continental margins. The plutonic porphyry types occur in batholithic settings with mineralization principally occurring in one or more phases of plutonic host rock. Volcanic types occur in the roots of volcanoes, with mineralization both in the volcanic rocks and in associated comagmatic plutons. Mineralization occurring around dykes and granitic rocks with porphyritic textures, breccia zones with angular or locally rounded fragments with sulphides between fragments or in fragments, epidote and chlorite, quartz and sericite and secondary biotite alteration-with fractures coated by sulphides, or quartz veins with sulphides. Original sulphide minerals in these deposits are pyrite, chalcopyrite, bornite and molybdenite. Most of the su1phides occur in veins or plastered on fractures; most are intergrown with quartz or sericite. In many cases, the deposits have a central very low grade zone enclosed by 'shells' dominated by bornite, then chalcopyrite and finally pyrite, which may be up to 15% of the rock[4]. Molybdenite distribution is variable, radial fracture zones outside the pyrite halo may contain lead-zinc veins with gold and silver mineralization.
Recognition criteria: Hydrothermal copper deposits are scattered throughout the northwestern area, which are mainly porphyry type. Their genetic characteristic recognition criteria appear to be; age of host-rock lithology; association with volcanic or magmatic-plutonic rocks; hydrothermal alteration zones, geological structures with high tectonic settings and fractures. The criteria based on the heat sources rock and faults are not considered further as a result of the reworking of the area within the geological period and could only be appropriate when working on local bases.
PREDICTION OUTLINE
The GIS-based mineral potential mapping process can be broken down into five main steps[5]:
| • | Building a spatial digital database |
| • | Extracting predictive evidence for a particular deposit type, based on exploration model |
| • | Calculating weights for each predictive map (evidential theme) |
| • | Combining the evidential themes to predict mineral potential |
| • | Validation of the model. |
Spatial datasets: The datasets for this study are compiled from the Yunnan Geological survey. These are:
| • | The digital based mineral deposit data consists of 42 established mines on the study area out of these 27 are identified with hydrothermal mineralization. |
| • | Database of the Lithology |
| • | Lineament digitized from 1:200.000 geological maps derived from shaded relief total intensity magnetic field image |
| • | Database of geochemical mainly from stream sediment sampling covering almost entire study area. |
DATA PROCESSING AND ANALYSIS
Geochemical data: The geochemical data covers almost the entire study area. This is stream sediment data consisting of 16 elements shown in the Table 1. In the area different genetic type of copper can be found and to differentiate these factor analysis[6] had been carried out and five factors were obtained to show different forms of mineralization.
| Table 1: | Component matrix |
 | |
 | |
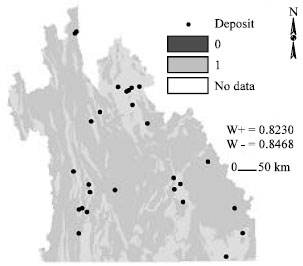
| Fig. 1: | Binary Map of geochemical data crossed with Cu deposits showing favorable areas of Cu deposits |
 | |
| Fig. 2: | Binary layer of lineament overlaid with Cu deposits |
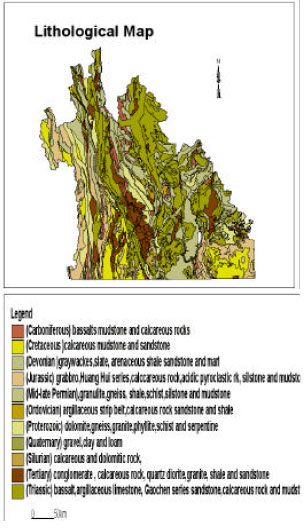 | |
| Fig. 3: | The map illustrates the major lithologies and their geological periods |
The first factor illustrate Cu in association with ultrabasic minerals such Ni, V etc. signifying metamorphic mineralization in an orogenic environment, the second factor where copper occurs with Pb, Zn, Ag despite the low value of Cu can be classified as hydrothermal mineralization, the third mineral association shows acidic magmatic deposition. The fourth shows mineralization in a low temperature environment could be classified as epithermal and the fifth Cu with Sn, very high temperature mineraliation. The second factor has been selected and contoured using Kriging in ArcGIS and exported for the weighting. The data was overlain by the mineral occurrence to determine the favorable zone based on (W+ and W¯) (Fig. 2) and the multiclass map reclassified to binary map. The cut-off was selected from W+=0.2 to W+=0.65 to represent favorable geochemical anomalous zone which covers approximately about 32% of the area. Fifteen out of the 27 mines fall in this region shown in Fig. 1.
| Table 2: | Weight of evidence analysis of the selected recognition criteria |
 | |
| Table 3: | Contingency table conditional independence |
| Probability values depend on chi-squared values and number of degrees of freedom. | |
| Table 4: | Result of weight-of-evidence |
 | |
Lineament data: Lineaments are extracted from the Landsat images using lines and circular features. Intersection of radial features and the lines are most favorable for mineralization. The lineament are then put into grid and the line density calculated using MAPGIS a software developed by CUG. The result is then imported in ARCGIS and contoured using kriking.
The layer has then been weighted and an evidence layer has been chosen. The cut-off value was selected with (W+ = 0.52 to W+ = 1.57). This represent the anomalous zone for lineament and this occupies about 24.6% of the area and 12 out of the 27 mines are within the area shown in Fig. 2.
Lithology: The database provides the various geological periods associated with most of the formation shown in Fig. 3. The classification of the geological period is the one adopted by the Yunnan Geological Survey. The various time units were reclassified to the major geologic periods and reclassification is again done on the major units, which have mineral occurrence in order to avoid over prediction. The cut-off value range from (W+ = 0.22 to W+ = 2) which includes Silurian rocks, Triassic Gaoshen series (T3BS), Triassic (T1-2MS), Late-Permian formations, Creataceous and the Carboniferous formations shown on (Table 2). This occupies nearly 31% of the area and 18 of the mines are located in this region shown in Fig. 4.
TEST OF CONDITIONAL INDEPENCE
Conditional independence is done to check the maps that can be used in the final prediction. This is tested by formulating the null hypothesis of pairwise conditional independence of the predictor binary maps. The χ2 tests is run to check if the hypothesis is rejected at 95% significance level.
According to Bonham-carten et al.[2], if two binary predictor maps B1 and B2 are conditionally independent with respect to a set of mineral occurrences points D:
Then, N{B1 ∩ B2} = N{B1 ∩ D}N{B2 ∩ D}/N{D}
 | |
| Fig. 4: | Binary map extracted from lithology and deposits |
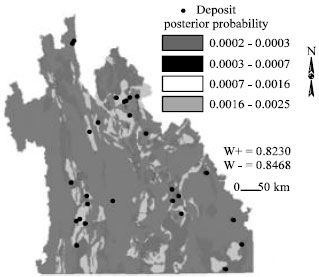 | |
| Fig. 5: | Map of conditional probability of hydrothermal Cu occurrence in Northwestern Yunnan Fig. 5 (prior prob = 0.0004) |
The mineral occurrence are considered as points, or single unit cells, the resulting values of χ2 are unaffected by the units of the area measurement. The calculated values can then be compared with the standard values of χ2 to verify if the conditional hypothesis holds at 95% probability with one degree of freedom. The standard value of χ2 with one degree of freedom at 95% significance level is 3.84[7] all the values shown on Table 3 from result WOE are less than 3.84.
PROSPECTIVITY MODEL
The predictive exploration model was generated by summing the weights of evidence of three binary maps representing the hydrothermal copper recognition criteria. The various overlap combinations of the binary maps result in the highest cumulative weights for the locations where favorable conditions are present.
DISCUSSION
The low value of the prior probability is the result of the few number of mineral occurrences for this particular study. This affects the low value gotten from the posterior probability values.
Reines[8] Suggested the following test if the weights make sense; the deposits must be found in the high favorability area; use other methods to cross check if the results tally. In general the results of the prediction needs to be validated to see the predictive ability of the results but this is quite an expensive thing to do.
The prediction result demonstrates that most of the known deposits occur in the predictive region. They could be classified into three major group, high medium and low. With a prior probability of 0.0004, the blue color shown on the legend represent the background value, the green color represent low predictive zone which occupies about 21% of the area, yellow color the medium which occupies 12% and the red color the high predictive region occupying about 3% with 9 mines located or near it as shown clearly on Fig. 5.
Table 4 summaries the results of the weight, contrast and student (C) calculated from the weight evidence model. The three evidential maps have contrast value nearly or greater than 0.5 and their students (C) values greater that 2 and they are conditionally independent to each other at significant level 95% (Table 3) so the can be used in weight evidence model. The lithological age is the best recognition criteria according to the available data the with contrast value of 1.6698 and student (C) value of 3.961 (Table 2)
CONCLUSIONS
The results of the evaluation concluded the successful implementation of weight-of-evidence model in the Northwestern of Yunnan as a preliminary measure is delineating potential areas for further exploration. The results has shown new areas which need to be check as a way of validation.
Weight of evidence has its associated advantages and disadvantages. Since it is a data-driven, it does not allow for subjective decisions on the choice of evidences especially determining the cut-off weight. There is the possibility of loosing information during the conversion of multi-class map to binary maps. It’s main advantage is the ease of carrying the method especially where there is the need to make a quick decision.