
Bassam Saleh
Not Available
Ayman N. Al- Dakhlallah
Not Available
Journal of Applied Sciences
Year: 2005 | Volume: 5 | Issue: 7 | Page No.: 1279-1285


ABSTRACT
The purpose of this study was to build and analyze a spatial geodatabase for Civil Defense Directorate (CDD) of Amman city in Jordan. To do so, many features were mapped from the ground using GPS techniques. The ArcGIS software was used to build the geodatabase and to perform different types of analyses such as overlay, classification, buffering, statistics, etc. This study provided a spatial analytical framework for using Geographic Information System (GIS) technology in order to enhance and assist (CDD) in making more informed decisions. GIS offered powerful data mapping and visualization functionality to facilitate spatial explorations of the data. It also allowed data from multiple sources and disparate formats to be integrated. Its powerful spatial querying and overlay capabilities greatly facilitated the organization and management of data sets to fit the needs of Civil Defense.
PDF Abstract XML References Citation
How to cite this article
Bassam Saleh and Ayman N. Al- Dakhlallah, 2005. Enhancement of Civil Defense Services Using Geographic Information System. Journal of Applied Sciences, 5: 1279-1285.
DOI: 10.3923/jas.2005.1279.1285
URL: https://scialert.net/abstract/?doi=jas.2005.1279.1285
DOI: 10.3923/jas.2005.1279.1285
URL: https://scialert.net/abstract/?doi=jas.2005.1279.1285
INTRODUCTION
Disasters and incidents in the form of earthquakes, fires, floods, explosions etc. severely impact communities economically, financially and socially. Most disasters are characterized by short reaction/response times, over whelming devastation to infrastructure and a strain on the intangible resources of the affected community. Decision makers at local and national levels are expected to quickly implement plans to restore order and mitigate the aftermath of the disaster.
A significant challenge in emergency management is delivering the appropriate information to the proper party at the appropriate place and time in a useful form. Data acquisition and integration in an emergency management information system should therefore focus on questions and problems related to capturing and integrating spatial information to the various needs of each party[1,2]. The overall challenge can be viewed as one of delivering accurate and appropriate information to all parties involved in an emergency at the proper stages of the emergency, in a timely manner.
GIS provides a mechanism to centralise and visually display critical information for emergency management. GIS software uses geography and computer-generated maps as an interface for integrating and accessing massive mounts of location-based information. GIS allows public safety personnel to effectively plan for emergency responses, determine mitigation priorities, analyse historical events and predict future events[3,4]. GIS can also be used to get critical information to officials, responders and citizens when an emergency occurs or when important information needs to be shared based on spatial requirements. When properly trained, emergency planners and geospatial analysts can take advantage of GIS to aid in tasks such as establishing communications sites, restoring electrical power and routing emergency supplies to critical facilities. However, in many cases specific datasets will not be available to accommodate every possible contingency that may arise in these operations.
GIS can be applied to almost any types of disasters and incidents such as fires, floods, earthquakes, explosions, etc. that can benefit from rapidly delivered spatial information which can aid rescue efforts. Technologies, such as GIS, continue to be incorporated into the emergency management systems and provide support for decision makers[1,5,6]. As these tools gain acceptance, they will not only help make critical decisions but also assist in saving lives and property.
This study is focused on Amman city, the capital of Jordan. The emergency services in the city are directed by the CDD using paper maps. So, it was necessary to build a GIS database that met the needs of emergency services. In this study, we present the applied methodology to achieve this goal as well as the results of present research. Spatial and statistical analyses were performed to evaluate the performance of our GIS system.
MATERIALS AND METHODS
Amman is the capital of the Hashemite Kingdom of Jordan and located at 32°N and 36°E (Fig. 1). Amman is the biggest city in Jordan with an area of 622 km2 with its suburbs and a population of 2 millions in 2002[7]. Around 38% of the country population lives in the Amman metropolitan area which causes many planning and environmental problems. Amman is considered as a land of immigration for many people after wars according to Laveau[8], the Palestinian's immigration in 1948, 1967, 1990, the Lebanese in 1975 and the Iraqis in 1990 and 2003. Amman is situated in the mountain heights plateau of Jordan and limited by the desert from the East and South with an elevation ranging from 400 m to 1000 m above sea level.
Layers and attributes definition: The needed layers and their attributes were defined after many discussions with the CDD. It was agreed to include many layers in the GIS database such as: CDCs, fire hydrants, districts, streets, schools, hospitals, ministries, embassies, Police departments, government departments, hotels, trade centers, Companies, forests, industrial zones, etc. The attributes of each layer were defined in function of the CDD needs. Detailed data attributes were specified for the CDCs such as: name, type, number of vehicles, number of interventions for the year 2003, reservoir capacity, number of officers, firemen, rescuing men and drivers, etc. For the attributes of the other layers, the name as well as the location (district and sub-district) was specified for each feature. The Jordan Transverse Mercator Projection was adopted as a coordinate system for the different layers.
Data collection: Ikonos Satellite images acquired in 2002 of Greater Amman were used to obtain the streets of new urban areas. The Amman tourist map was also used to obtain the location of different features such as ministries, embassies, hotels, etc. The Amman administration map was used to obtain the districts and sub-districts layers.
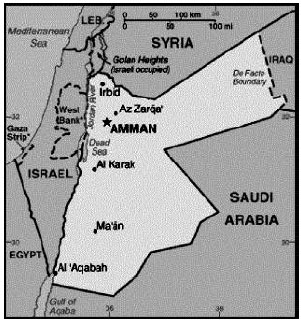 | |
| Fig. 1: | Amman location map |
The locations of some features such as the CDCs, fire hydrants, new hotels, schools, hospitals and trade centers were obtained by GPS. Tabular attribute data was collected from the CCD and other governmental ministries and directorates[9].
Scanning, registration and digitization: The Amman tourist map as well as the Amman administration map were scanned using high resolution. Then they were registered using the coordinates of some ground control points. This process of registration was applied also to Ikonos images in order to keep the images in Jordan Transverse Mercator Coordinate System. The different layers were obtained by digitizing the needed features located on the images using the ArcGIS software.
Linking spatial data with attribute data: Some attribute data were entered to the geodatabase while building the layers. Some tabular attribute data with Excel format were linked to the layers after changing the format of the table from Excel to Access database. The ArcGIS software was used to link the tables with the appropriate layers.
Data analysis and interpretation: Statistical and spatial analyses were applied to the built geodatabase using different methods offered by the GIS technique.
RESULTS
Twenty five layers were obtained covering the needs of the CDD. The CDCs were represented by pie charts in function of their equipment. The size of the pie chart is proportional to the number of vehicles in the CDCs. CDCs are not well distributed in the districts of Amman due to the great expansion of the city (Fig. 2). Also, the fire hydrants are not well distributed due to the previous reason, besides the location of the fire hydrants is decided by a Private Water Supply Company without any coordination with the CDD.
Figure 3 shows: districts, main streets, CDCs, police centers, ministries, governmental directorates, hotels, gas stations, hospitals and companies layers. The CDCs can hardly manage any emergency in Fig. 3 mentioned objects, especially since all these objects are located in the most crowded part of the city.
The majority of the accidents are concentrated in the western and south-eastern parts of Amman city. These parts are not well served by the CDCs because of the traffic jam and distance (Fig. 4).
In order to examine the areas served by the CDCs, different buffer zones of various radiuses (1, 2 and 3 km) were created in coordination with the CDD. The maximum radius of 3 km represents the maximum distance that can be reached within 10 min (Fig. 5). The buffers indicate that many areas are not well served. In order to improve the quality of the emergency services, additional CDCs were suggested.
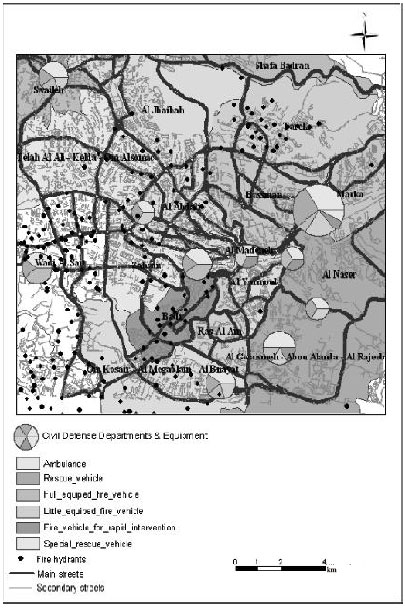 | |
| Fig. 2: | GIS Map composed of districts, main stress, CDCs and fire hydrants layers |
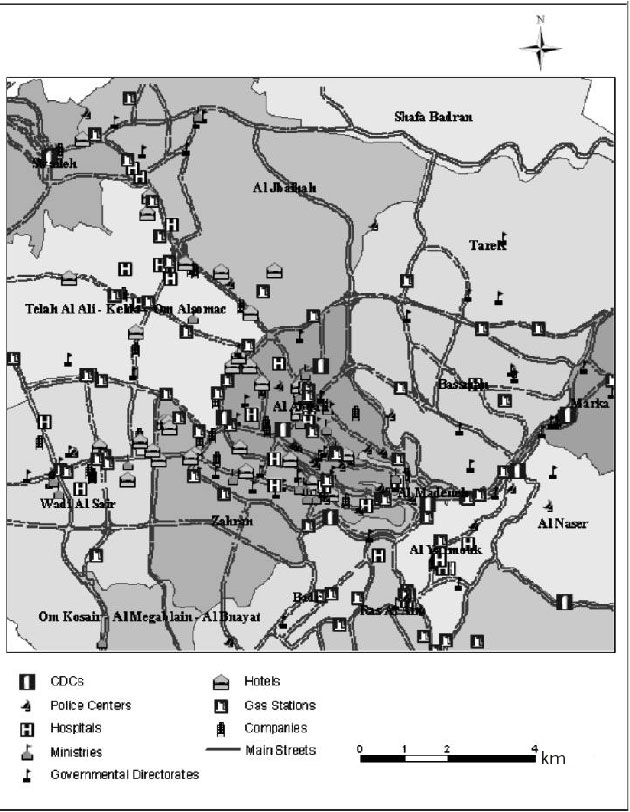 | |
| Fig. 3: | GIS Map composed of districts, main stress, CDCs, police centers, ministries, govermental directoates, hotels, gas station, hospital and companies layer |
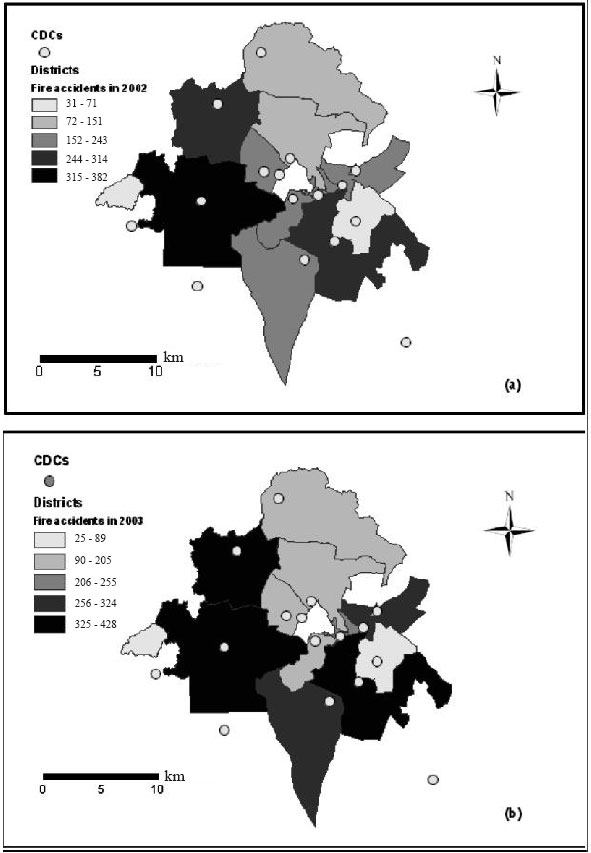 | |
| Fig. 4: | Distribution of fire accidents in 2002 and 2003 in different districts |
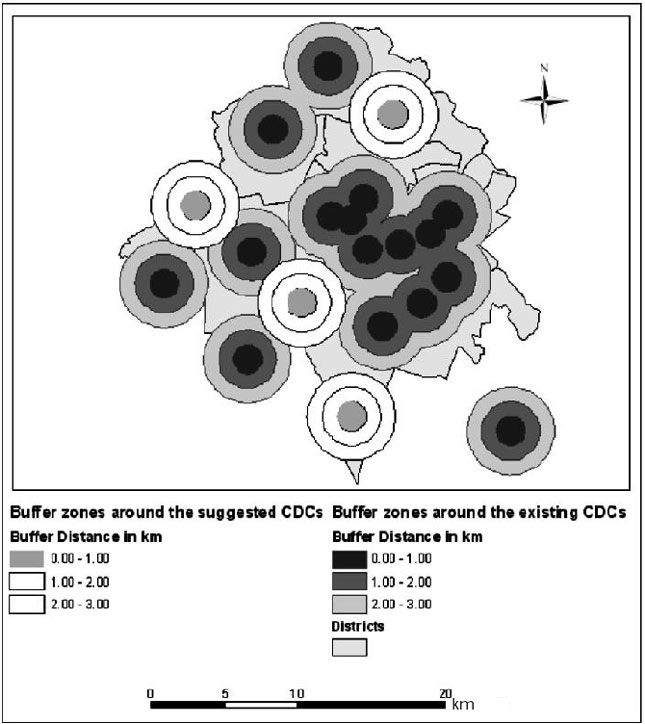 | |
| Fig. 5: | Buffer zones around the existing and suggested CDCs |
DISCUSSION
The built GIS is a powerful mechanism available to emergency planners for collecting, storing, analyzing and sharing the geospatial information needed by CDCs to effectively support operations and restore disaster-affected communities in a relatively efficient manner. For emergency planners, GIS can facilitate critical decision making before a disaster strikes and in the crucial early stages of disaster relief operations.
The system can provide important information to CDCs such as locations of critical facilities (e.g. ministries, hotels, hospitals, etc.), transportation network (e.g. main streets, secondary streets, etc.) and areas affected by follow-on events such as fires. The system can be used in every stage of a disaster relief operation, but it is necessary to have existing GIS well-trained analysts, to maintain the system.
CONCLUSIONS
Through this study in which twenty five layers were produced, the following points are concluded:
| • | The CDCs work should be based on the built GIS instead of paper maps. |
| • | Offering a new interactive tool for modern planning and immediate reflection of any change in the civil defense of Amman. |
| • | The necessity of increasing the number of CDCs in different districts in order to improve the quality of emergency services. |
| • | Integrating modern technologies such as vehicle tracking systems (GIS and GPS) to have more efficiencies and capabilities. |