
Xin Hou
College of Computer Science and Information Engineering, Zhejiang Gongshang, University, Hangzhou 310018, China
Wenjie Ge
College of Computer Science and Information Engineering, Zhejiang Gongshang, University, Hangzhou 310018, China
Information Technology Journal
Year: 2012 | Volume: 11 | Issue: 7 | Page No.: 931-935


ABSTRACT
The essence of the state monitoring for the electric power network is the pattern clustering of its operating state. This study introduces the research results of complex network, establishing the network model of fault diagnosis, converting the fault diagnosis for the electric power network into the detection problem of sub-network, realizing the state clustering by means of the block merging algorithms and the optimal rules functions. On this basis, a practical state monitoring system for the electric power network is designed which real-time collects the operating status data by the multi-sensor. The method based on complex network analysis is proved by the experiments to be effective in state classification and fault diagnosis for the electric power network.
PDF Abstract XML References Citation
Received: November 24, 2011;
Accepted: March 27, 2012;
Published: May 29, 2012
How to cite this article
Xin Hou and Wenjie Ge, 2012. The Design of State Monitoring System Based on Complex Network. Information Technology Journal, 11: 931-935.
DOI: 10.3923/itj.2012.931.935
URL: https://scialert.net/abstract/?doi=itj.2012.931.935
DOI: 10.3923/itj.2012.931.935
URL: https://scialert.net/abstract/?doi=itj.2012.931.935
INTRODUCTION
Currently, the monitoring method for the electric power network is usually by the people, who deliver the monitoring results to the control center by the wired communication. The traditional monitoring method is static, error, limited monitoring scope and high cost. The state monitoring system can be realized to transfer the “regular maintenance” to the “timely maintenance”, extend equipment life and reduce the costs.
Many scholars have been studied the state monitoring and fault diagnosis problems of the electric power network (Mohamadi et al., 2008; Wang et al., 2011). A brief introduction of artificial intelligence techniques related and commentary of power network fault diagnosis methods is proposed in the literature (Bi et al., 2000). A generator insulation fault diagnosis expert system based on fuzzy reasoning is proposed and designed (Sun et al., 2006). Wang et al. (2008) proposed a distribution network fault diagnosis algorithm based on decision tree and rough sets, using the characteristics of rough sets and decision tree to extract diagnostic rules, achieved a rapid diagnosis, improved accuracy and robustness of fault diagnosis in distribution network. Zhao et al. (2004) proposed an attribute reduction algorithm based on rough set theory, regarding the protect and circuit breaker as condition attribute, the fault zone as decision attribute, formed the decision table and finally formed a comprehensive mix of knowledge model. These studies mainly focused on power generation equipment fault diagnosis, including diagnosed and located the fault troubleshooting through effective algorithm according to the information of circuit breakers and protection devices. While the research of state monitoring and fault diagnosis for the electric power network is not a lot.
The essence of state monitoring for the electric power network is actually solving the problems of pattern clustering (Wang et al., 2011). Network model can be introduced to diagnose fault in power network because of its characters of express intuitive, adaptable and can effectively be divided into clusters (Chu et al., 2011; Mehennaoui et al., 2006). This study was attempt to establish a state monitoring system for the electric power network, using block merging algorithms based on complex network to achieve state classification and fault diagnosis. According to the fault which is diagnosed by state monitoring, the fault trends and impending fault can be forecasted and the support information for the power network is provided.
SYSTEM ARCHITECTURE DESIGN
The main task of state monitoring typically includes the following aspects:
| • | Accumulate operating data, establish historical archives |
| • | Classify the operating state, analysis and determine the nature and degree of faults based on the historical data and the historical characteristics of faults |
| • | Assess the operational status of electric power network, determine its operation status is normal or not, provide support information based on historical data and expert knowledge |
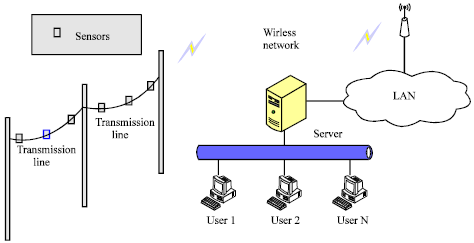 | |
| Fig. 1: | System diagram |
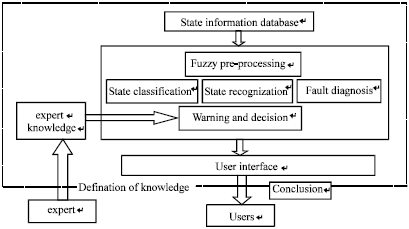 | |
| Fig. 2: | System structure diagram |
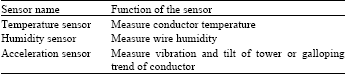
| Table 1: | Types of sensor for network monitoring |
 | |
The overall system diagram is shown in Fig. 1.
The state monitoring system of the power network collects the status information of high-voltage transmission lines by the multi-sensors which is installed on the line and tower. The data of the equipment is transported to the data processing server via wireless and then stored in the database.
The state monitoring of electric power network included three main areas: (1) the working status of the lines: line temperature, the wind side and so on, (2) the environment of the lines: temperature, humidity, wind speed and (3) the insulation status of the lines: the size and distribution of insulator leakage current.
According to the above, the main monitoring sensors are shown in Table 1.
The system structure is shown in Fig. 2.
In the data processing server, the status date is fuzzed firstly in order to reduce distortion, noise and other interference on the impact of the status of classification and the fault diagnosis and eliminate differences of the data in the dimension and value. Using the fuzzed data which is processed through a fault diagnosis algorithm based on complex network can classify and identify the state of the transmission lines and diagnose the fault. According to the outcome of the state identification and fault diagnosis, the corresponding maintenance or repair measure can are got and the decision support information is provided by accessing the pool of expert knowledge. The expert knowledge base contains the knowledge of running state and all measures should be taken which can be got from experts in the field of knowledge acquisition process.
In addition, the system which is combined by the management information system of power system can arrange appropriate maintenance operations according to the diagnostic results in order to maximize efficiency and reduce costs.
FAULT DIAGNOSIS BASED ON COMPLEX NETWORK
Fuzzy pretreatment: The data pre-processing is realized to eliminate interference and improve diagnostic accuracy since the data would be interfered by the noise, distortion and some other interference during transmission (Du et al., 2010). It is necessary to use normative data sets because of the differences in the dimension and value of the state variables. This paper use piecewise linear method to fuzzy pre-treat the state parameters and mapping to the interval [0,1].
The piecewise linear function is in the form below:
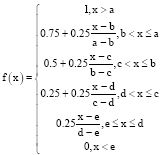 | (1) |
Where, a, b, c, d, e get segment value of the data distribution according to the actual operating procedures and data.
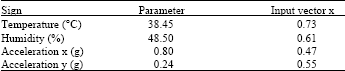
Table 2 shows an experimental sample collected by the sensors, when the humidity was 48.5%, according to a large number of historical data collected. a, b, c, d, e were, respectively 80, 70, 60, 40 and 20 which is obtained by clustering. Substituted into Eq. 1, the result calculated is 0.61. The fuzzy treatment of other parameters is similar to the humidity and the results are shown in the third column of Table 2. The vector consisted by the column is the input vector of fault diagnosis module.
The network model of fault diagnosis: Set the system state samples with p attributes form a sample set X = {x1,x2,…, xn}, {xi1,xi2,…, xip}, i = 1, 2,…, n. The contact between sample xi and xj is expressed with the similarity eij which the composition of the similarity between each sample makes up set E.
| Table 2: | Fault symptoms and input vector |
 | |
The higher the similarity between samples is, the larger eij is; and the lower the similarity between samples is, the smaller eij is. Set the X as nodes of a network, E as weighted edges to form a weighted undirected network G(X, E). Because it is an undirected network, the similarity between the two nodes is equal, so E is a symmetric matrix. The design principles of similarity matrix E are as large as possible within-class similarity, the similarity between classes is as small as possible, this paper use the function:
| (2) |
where, dij use Euclidean distance. It can be seen that the larger dij is the smaller eij is which indicates the similarity of the samples xi and xj. When i = j, set eij = 0.
After network model is established, the process of fault diagnosis is that make the set of nodes X of weighted undirected network divide into the m non-overlapping sub-networks by arithmetic operation g, namely:
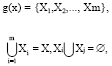 |
Xi⊂X, X≠i, I≠j, I, j∈(1, m). Each subset corresponds to a class of system status, so the process of fault diagnosis can be transformed for the detection of sub-network problems which meets "large within-class similarity, small similarity between the class ". Design objective function according to the needs, handle network detection problem into optimization problem, namely:
| (3) |
The objective function Q is a criterion function.
Define similarity between the two subsets Xp and Xq of the m sets obtained by clustering as wpq:
| (4) |
When p = q, wpq is the similarity of samples in Xp. When p≠q, wpq is the similarity between subsets Xp and Xq. Depending on the target (Σp wpq) and min(Σp,q wpq), define the criterion function of the detection of the sub-network and fault diagnosis:
| (5) |
where:
is the within-class similarity:
is the similarity between classes, Q meets positive correlation of within-class similarity and meets anti-correlation of between-class similarity, meets with the goal of fault diagnosis clustering.
Fault diagnosis based on complex network: Set each sample as a subset forming a set X = {X1, X2,..., Xn}, Xi = {xi}, i∈(1,n). Combine all the subsets according to the method of hierarchical clustering based on the principle of bottom-up. It can be expressed as: "subset ![]() , … ,
, … , ![]() larger subset
larger subset ![]() , … ,
, … ,![]() the final clustering results” .
the final clustering results” .
The process of module merging is a process to optimize clustering criterion function, select two the subsets making the value of clustering criterion function increases largest as the objects to be combined. Set up n0 (X) = {X1, X2,..., Xn}, n0 (X) indicates the first 0 combination of X. After k times of merger, the sample has been divided into m subsets. At this time, combine the subset of Xf and Xg with the operation of nk+1(X), f, g = 1,2,...m,, Q will change the value of Q ', calculate through Eq. 4, 5:
| (6) |
| (7) |
Recorder:
| (8) |
where wfg = wfg, is the similarity between subsets Xf and Xg, wfp and wgp are the similarities between subsets Xf, Xg and Xp.
By comparison, combine the subsets Xf and Xg make the value of the criterion function Q has the change of Δfg. According to the selection criteria subsets merger, as long as Δfg>0, it can be ensured that this merger is effective, further, make the choice of Δfg>0, it can be ensured that this merger is the best and effective. For any two modules can be calculated the corresponding Δfg, construct the matrix :
 | (9) |
Combine the subsets of Δfg>0.
Therefore, the operation flow of the fault diagnosis algorithm based on complex network is as follows:
| • | Build a weighted undirected network G(X, E), design the similarity function |
| • | Calculate the matrix Δm |
| • | Identify the maximum Δfg in the matrix, if max(Δfg>0), turn to next, otherwise to (6) |
| • | Combine subsets Xf and Xg |
| • | Calculate the matrix Δm-1 of the new network, return (3) |
| • | Get the final clustering results, achieve the fault state classification |
ALGORITHM VALIDATION
In order to verify the effectiveness of the fault diagnosis algorithm for electric power network in the experimental environment, the sample data are collected through multi-sensor at different times in different environments for testing. Collect 1326 groups of sample data in the experimental environment, randomly selecting half of them as training data and the remaining half as test data.
Since it costs large computation and time to combine the samples directly, so make initial division of the samples. Procedure is as follows:
| • | Initialize the sample collection |
| • | Find the nearest points xi in the sample from the origin |
| • | Mark points whose similarity is greater than the threshold θ (include θ), forming a new collection |
| • | Remove the marked points in the sample, if the sample X = ø, end; otherwise, go to (2) |
After the initial classification, the sample is divided into several subsets, then making state classification according to the fault diagnosis algorithm based on complex network. Test result is shown in Table 3, in which the correct rate of classification μ is calculated as follows:
| (10) |
Nr is the number of correctly classified, Nt is the number of all test data.
 | |
| Fig. 3: | Affect of threshold to correct rate |
| Table 3: | Result of fault diagnosis |
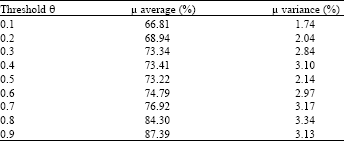 | |
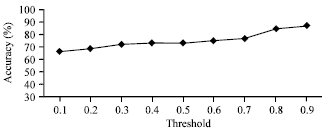
The relationship between correct rate and threshold is shown in Fig. 3.
It can be found from the result that with the increase of the initial threshold θ, the correct rate of state classification increases. When the initial threshold θ is larger, it can be got more data sets. As a result, the correct rate will be larger and the overall variance is relatively small. It indicates that the method performance is relatively stable in the application of fault diagnosis. Therefore, the fault diagnosis based on complex network can be effectively used in fault state classification in electric power network.
CONCLUSIONS
The system which is realized by this paper monitor the state of high-voltage transmission lines, collect real-time state information by wireless sensors, then make state classification, state identification and fault diagnosis. After then call the expert knowledge, assess the equipment operation state which is abnormal or not, predict the possible fault so that can promptly arrange for maintenance and provide support information for the power grid maintenance when faults have happened. System performance depends on the accuracy of state classification achieved by fault diagnosis algorithm. Fault diagnosis in electric power network is to solve the mode clustering problem. The research of complex network is introduced, establish network model of fault diagnosis, so the fault diagnosis is transformed into the problem of sub-networks dividing.
ACKNOWLEDGMENTS
The study reported in this paper was funded by Zhejiang Major Science and Technology and Priority Themes Projects (No. 2010C11051).
REFERENCES
- Mohamadi, M.H., H. Ahmadi, S.S. Mohtasebi and S. Hasani, 2008. Vibration condition monitoring techniques for fault diagnosis of electromotor with 1.5 kw power. J. Applied Sci., 8: 1268-1273.
CrossRefDirect Link - Wang, W., B. Wang, Z. Liu and L. Guo, 2011. A cluster-based real-time fault diagnosis aggregation algorithm for wireless sensor networks. Inform. Technol. J., 10: 80-88.
CrossRefDirect Link - Chu, H., Z. Xie and H. Jiang, 2011. Hybrid intelligent monitoring network based on Ad hoc and wireless sensor networks. Inform. Technol. J., 10: 849-855.
CrossRefDirect Link - Mehennaoui, L., N. Debbache and M.L. Benloucif, 2006. Neuro-fuzzy methods for fault diagnosis of nonlinear systems. J. Applied Sci., 6: 2020-2030.
CrossRefDirect Link - Wang, W., Z. Liu, X. Hu, B. Wang, L. Guo, W. Xiong and C. Gao, 2011. CEDCAP: Cluster-based energy-efficient data collecting and aggregation protocol for WSNs. Res. J. Inform. Technol., 3: 93-103.
CrossRefDirect Link