
Makoto Murakami
2-6-1-609 Higashi-ikebukuro, Toshima, Tokyo 170-0013, Japan
International Journal of Biological Chemistry
Year: 2011 | Volume: 5 | Issue: 2 | Page No.: 156-160


ABSTRACT
Program Atp2 computes the transformed standard Gibbs energy ΔrG°’ (kJ mol-1) for the ATP hydrolysis at various pH values. The incorporation of a table form which consists of three ionic strengths and their corresponding groups of equilibrium constants is essential to implement the simulation. The tables consisted of any three from six ionic strengths (0, 0.17, 0.20, 0.21, 0.22 and 0.30 mol kg-1) and their corresponding groups of ten equilibrium constants. Twenty 10x3 tables thus formed were incorporated to the program one by one and the computation of ΔrG°’ was carried out at pH 6.8. When the equilibrium constants corresponding to ionic strength (I) 0 consisted of elements at one column, ΔrG°’ was highest. In cases when the equilibrium constants at I = 0.17 were elements of one column and other two columns were not composed of the constants corresponding to I = 0 and I = 0.30 which are ionic strengths distant from cellular conditions, the Gibbs energy was the lowest value. When the equilibrium constants corresponded to ionic strengths relatively remote from the physiological region, ΔrG°’ values were higher than those computed with the constants corresponding to ionic strengths on typical cellular conditions. The present study has shown the importance of two features. First, a table form which relates a group of quantities to another group of quantities is essential for complicated computing. Secondly, theoretical simulation well supported by exact experimental data displays important significance. An extension of this work would take notice of these findings.
PDF Abstract XML References Citation
Received: August 17, 2010;
Accepted: December 15, 2010;
Published: February 22, 2011
How to cite this article
Makoto Murakami, 2011. Simulation of ATP Hydrolysis with Table Form. International Journal of Biological Chemistry, 5: 156-160.
URL: https://scialert.net/abstract/?doi=ijbc.2011.156.160
URL: https://scialert.net/abstract/?doi=ijbc.2011.156.160
INTRODUCTION
Adenosine triphosphate (ATP) acts not only as the energy store, but also as a kinetically versatile coupling agent (Hanson, 1989). The essence of ATP action is its ability to lose its terminal phosphate (Pi) by hydrolysis and to form Adenosine diphosphate (ADP). The hydrolysis is exergonic and this exergonicity depends on temperature, pH, pMg (= -log[Mg2+]) and ionic strength (I) (Alberty, 2003). There are two explanations of the molecular basis for the exergonicity of the ATP hydrolysis reaction. The first is the hypothesis that electrostatic repulsion between adjacent phosphate groups is a factor that controls the exergonicity of ATP hydrolysis. The second explanation is the destabilizing effect of opposing resonance along the P-O-P backbone of the ATP molecule in comparison to the reduced effect of its hydrolysis products. Several investigators have attempted the quantitative explanations of these hypotheses using the most up-to-date computing methods (Colvin et al., 1995; Hansia et al., 2006; Arabi and Matta, 2009).
In aqueous solutions, ATP can take acidic forms, ATP4¯ and HATP3¯. It also binds Mg2+ in cellular environments to form MgATP2¯, MgHATP¯ and Mg2 ATP (Storer and Cornish-Bowden, 1976). The Gibbs energy of ATP hydrolysis is influenced by alterations in pH and I. Theoretical simulation of the ATP hydrolysis is very complicated not only because the components in the process have many forms, but also because three variables, pH, pMg and I, need to be considered.
| Table 1: | Equilibrium constants for ATP, ADP and Pi at 37°C and various ionic strengths (I) (mol kg-1) |
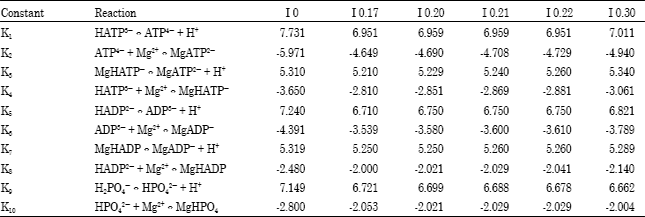 | |
| The values of the constants for the ten reactions were calculated using data given by TABLE VI in Rosing and Slater (1972) and converting to the negative logarithms (base 10) of the data. | |
Computer program Atp2 (Cropper, 1998) written in Mathematica code computes the transformed standard Gibbs energy (ΔrG°’) (kJ mol-1) for the ATP hydrolysis at various pH values. In the program, a table of equilibrium constants at three ionic strengths (mol kg-1) is used. The data reported by Rosing and Slater (1972) are introduced in this table, but the basis in preparing the table is not clear. In the present study, values of the constants reported by Rosing and Slater (1972) have been readjusted and computations have been implemented with tables prepared according to a well-defined protocol.
MATERIALS AND METHODS
Between pH 6 and 9, there are ten equilibrium constants for ATP, ADP and Pi. Values of the equilibrium constants for these compounds have been given by Rosing and Slater (1972). The data were converted to the negative logarithms (base 10). The ten equilibrium constants (K1-K10) thus obtained corresponding to six ionic strengths are listed in Table 1.
Table forms used in the present study consisted of the ten equilibrium constants at any three of the six ionic strengths. These 10x3 table forms were essential for computing.
Computational methods: The program Atp2 is written in Mathematica code and included in the CD-ROM that accompanies the Cropper’s book. The programs used in the present study were modified slightly from Atp2 and calculated ΔrG°’ for pH = 6.8, pMg = 3.0 and I = 0.15 mol kg-1. These values are typical for cellular conditions.
Two kinds of output, one was graphical and another was numerical, were obtained by the implementation. The former was the pH profile of ΔrG°’ and the latter was ΔrG°’ at pH 6.8. This study was carried out in author’s home office from January 2009 to May 2010.
RESULTS
There are twenty combinations of the six ionic strengths taken any three. Table 2 shows ΔrG°’ computed using the ten equilibrium constants corresponding to three ionic strengths in the table form on the fourteenth line of the program. The data in Table 2 are ΔrG°’ for pH 6.8.
Two findings emerged from the computing results. First, in cases when the equilibrium constants at the first column were those at I=0, the Gibbs energy was higher than that computed with the table in which the constants at three columns corresponded to ionic strengths other than 0.
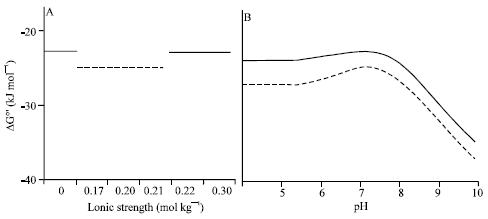 | |
| Fig. 1: | Comparison of the profiles of the highest and lowest ΔrG°’ values computed by using the table forms indicated in Table 2. The solid and broken lines indicate the highest and lowest ΔrG°’ (kJ mol-1), respectively. (A) The horizontal lines indicate the groups of three ionic strengths (mol kg-1) to which the highest and lowest Gibbs energies correspond. The lowest energy was also obtained by computing with the equilibrium constants which corresponded to other two groups of ionic strengths (0.17, 0.20, 0.22) and (0.17, 0.21, 0.22). (B) The pH profiles of ΔrG°’ for the ATP hydrolysis reaction |
| Table 2: | Values of ΔrG°’ (kJ mol-1) at pH 6.8 computed by using ten equilibrium constants at groups of three ionic strengths (I) (mol kg-1) in the table form on the fourteenth line of the program |
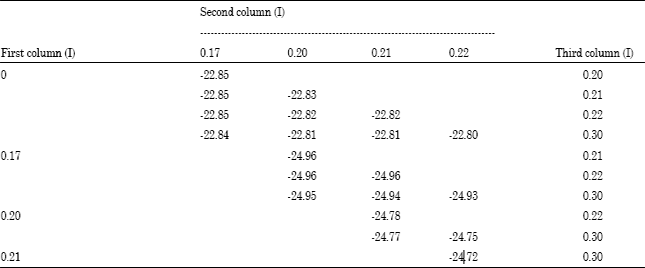 | |
Secondly, when the equilibrium constants which corresponded to I = 0.17 consisted of the first column and other two columns were not composed of the constants corresponding to I = 0 and I = 0.30 which are distant from cellular conditions, the computed Gibbs energy was the lowest value. The lowest value was obtained in cases where the table forms were composed of the equilibrium constants corresponding to the following three groups of ionic strengths: (0.17, 0.20, 0.21), (0.17, 0.20, 0.22) and (0.17, 0.21, 0.22) (Table 2). These results are illustrated in Fig. 1A. Comparison of the pH profiles of the highest and lowest Gibbs energies is shown in Fig. 1B. Precise simulation was able to implement using the table form to which values derived from the exact experimental data were assigned as elements.
DISCUSSION
The two-dimensional table forms on the fourteenth line in the programs were essential for computing. With a one-dimensional vector form (Tam, 2008), such as a group of ten equilibrium constants which corresponded to one ionic strength (for example, I = 0.17 only), computation was not able to implement. It is necessary to relate a group of three ionic strengths to corresponding ten equilibrium constants.
The following table is used in the original Atp2 program.
 |
The elements of the first column are obviously the group of the constants corresponding to I = 0 (Table 1). It is not informed, however, about sources of values in the second and third columns. The Gibbs energy for pH 6.8 calculated with the original Atp2 is -27.05 kJ mol-1. Using the exact experimental data (Rosing and Slater, 1972) concerning the equilibrium constants for various ionic strengths, the present study showed clearly that ΔrG°’ computed fell into two groups, lower values for the ionic strengths on typical cellular conditions and higher ones for those relatively remote from the physiological region. In contradiction of the original Atp2 program, by incorporating the readjusted experimental data into the table form, the present work has been able to simulate precisely the relationships between the Gibbs energies for the ATP hydrolysis and various values of ionic strengths which are within or beyond the physiological region.
In this study, the point to be emphasized is that table forms which relate two groups of quantities, can convey significant information. A matrix method consisting of four products and corresponding three stages (mixing, reaction and separation) has been proposed to obtain overall optimization of the product cost (Shafeeq et al., 2008). This approach is in support of the usefulness of the present study on table forms.
Nagy et al. (2006) have found that the dynamics and structure relationship of biomolecules is accessible with two-dimensional spectroscopies. Furthermore, they have shown that these techniques can connect time-resolved picture with spatial resolution. These two-dimensional spectroscopies (Nagy et al., 2006) and simulation with table forms in the present work are different subjects, but the two studies have something in common in the respect that relating groups of quantities each other is essential for numerical processing.
The future direction of the present study will go on to more detailed examinations of significance of table forms (including matrices and tensors) in simulation. Alberty (2004) has shown how the thermodynamics of biochemical reactions like pyruvate dehydrogenase and the citric acid cycle can be discussed at steady-state concentrations of certain coenzymes. For this approach, manipulations of matrix multiplication have been needed. Furthermore, these manipulations have been applied to the ATP hydrolysis and have obtained values of the transformed standard Gibbs energies for the formation of ATP, ADP and adenosine monophosphate (AMP) (Alberty, 2006). EL-Naowk (2007) has described that these operations can apply to writing in cipher and deciphering the message. A foreseeable extension of the present research would be to include manipulations of matrix multiplication in the implementation of computing with high-level programming languages.
CONCLUSION
The incorporation of a two-dimensional table form which consisted of three ionic strengths and corresponding groups of equilibrium constants was essential to compute ΔrG°’ for the ATP hydrolysis reaction. When equilibrium constants corresponded to ionic strengths relatively remote from the physiological region, ΔrG°’ values were higher than those computed using the constants corresponded to ionic strengths on typical cellular conditions. The present study shows the importance of two features. First, a table form which relates a group of quantities to another group of quantities is essential for complicated computing. Secondly, theoretical simulation well supported by exact experimental data displays important significance. An extension of this work would take notice of these findings.
REFERENCES
- Alberty, R.A., 2003. Thermodynamics of the hydrolysis of adenosine triphosphate as a function of temperature, pH, pMg, and ionic strength. J. Phys. Chem. B, 107: 12324-12330.
CrossRef - Alberty, R.A., 2004. Equilibrium concentrations for pyruvate dehydrogenase and the citric acid cycle at specified concentrations of certain coenzymes. Biophys. Chem., 109: 73-84.
CrossRef - Arabi, A.A. and C.F. Matta, 2009. Where is electronic energy stored in adenosine triphosphate. J. Phys. Chem. A, 113: 3360-3368.
CrossRef - Colvin, M.E., E. Evleth and Y. Akacem, 1995. Quantum chemical studies of pyrophosphate hydrolysis. J. Am. Chem. Soc., 117: 4357-4362.
CrossRef - EL-Naowk, F.R., 2007. A generalization of the RSA elatrash scheme. J. Applied Sci., 7: 1824-1826.
CrossRefDirect Link - Hansia, P., N. Guruprasad and S. Vishveshwara, 2006. Ab initio studies on the tri- and diphosphate fragments of adenosine triphosphate. Biophys. Chem., 119: 127-136.
CrossRef - Nagy, A., V. Prokhorenko and R.J.D. Miller, 2006. Do we live in a quantum world: Advances in multidimensional coherent spectroscopies refine our understanding of quantum coherences and structural dynamics of biological systems. Curr. Opin. Struct. Biol., 16: 654-663.
CrossRef - Rosing, J. and E.C. Slater, 1972. The value of G° for the hydrolysis of ATP. Biochim. Biophys. Acta, 267: 275-290.
PubMed - Shafeeq, A., M.I. Abdul Mutalib, K.A. Amminudin and M. Ayyaz, 2008. Scheduling three stage flowshop processes with no intermediate storage using novel matrix approach. J. Applied Sci., 8: 2136-2141.
CrossRefDirect Link - Storer, A.C. and A. Cornish-Bowden, 1976. Concentration of MgATP2- and other ions in solution: Calculation of the true concentrations of species present in mixtures of associating ions. Biochem. J., 159: 1-5.
Direct Link