
Tarek M. Galal
Department of Botany and Microbiology, Faculty of Science, Helwan University, Egypt
LiveDNA: 20.28133


ABSTRACT
The aim of the present study was to evaluate the population structure of 10 woody perennials in terms of size distribution and density along different elevations. These species are: 5 trees (Acacia tortilis subsp. raddiana, Acacia tortilis subsp. tortilis, Balanites aegyptiaca, Tamarix aphylla and Tamarix nilotica), 2 shrubs (Leptadenia pyrotechnica and Nitraria retusa) and 3 shrublets (Pulicaria undulata, Zilla spinosa and Zygophyllum coccineum). The number of individuals of each species was counted and the height (H) and mean crown diameter (D) were measured. The size index of each individual was calculated and then used to classify population into 6 size classes; 20 >size> 80 cm for shrublets, 100 > size > 500 cm for shrubs and 2>size>10 m for trees. The absolute and relative frequency of individuals and mean height, diameter and height to diameter ratio per individual in each size class were then determined. The present study indicated that the density of most species, except B. aegyptiaca, decreased as elevation increased. The height-to-diameter ratio was less than unity for most of the recorded species except T. nilotica. Four forms of size distributions along the different elevations were recognized: more or less inverse J-shaped distribution (T. nilotica along elevation level I and Z. coccineum along elevation levels I and II), positive skewed distribution (B. aegyptiaca along elevation levels I and II), bell shaped distribution (Z. spinosa along elevation level I) and more or less J-shaped distribution (P. undulata along elevation levels I and II).
PDF Abstract XML References Citation
How to cite this article
Tarek M. Galal, 2011. Size Structure and Dynamics of Some Woody Perennials along Elevation Gradient in Wadi Gimal, Red Sea Coast of Egypt. Ecologia, 1: 56-67.
DOI: 10.3923/ecologia.2011.56.67
URL: https://scialert.net/abstract/?doi=ecologia.2011.56.67
DOI: 10.3923/ecologia.2011.56.67
URL: https://scialert.net/abstract/?doi=ecologia.2011.56.67
INTRODUCTION
The natural vegetation in the desert has to adapt to growth conditions which are characterized by high summer temperature that coincides with storage of water with the alternation of more humid winter period (El-Kenany, 1995). Shrubs and trees are important elements of semi-desert vegetation since many community and ecosystem processes are regulated by them (Evenari, 1985). These plants show a number of morpho-physiological features that allow them to cope with the high aridity and low nutrient availability characteristic of semi-arid environments, such as deep root systems, tolerance to high radiation levels and capacity for clonal spread, presence of thorns and spines and small leaves (Nobel and Franco, 1989; Pugnaire et al., 1996a, b). Many shrubs and trees are of structural and economic importance in the arid regions (Crisp and Lange, 1976). They play an important role in soil protection and stabilization against movement by wind or water, provide a source of forage for animals and fuel for local inhabitants and have medicinal and potential industrial values (Thalen, 1979).
From the point of view of the dynamics of semi-desert communities, many shrubs and trees may be considered pioneer species. Their high germinability, elevated growth rates during early stages and tolerance to high radiation levels allow them to colonize open spaces, thus providing microsites for the germination and establishment of many other species under their canopies (Nobel and Franco, 1989; Valiente-Banuet and Ezcurra, 1991; Pugnaire et al., 1996a, b). This process contributes to create the heterogeneous landscape that characterizes semi-desert ecosystems. As a result of the above reason, shrubs and trees of semi-desert communities could be considered as keystone species on which many community and ecosystem processes depend (Valiente-Banuet et al., 1991; Pugnaire et al., 1996a, b).
The distribution and abundance of a plant species within a particular climatic zone is determined by environmental factors, especially soil conditions, interactions with other species and dispersal. Survivorship and fecundity appear to be primarily determined by the size and the developmental stage, rather than age, of individuals within a plant population (Werner and Caswell, 1977; Silvertown, 1981). Thus, the status of a plant population will be reflected by its density and size structure. Comparisons of the size structure of populations of a species in different localities may provide an insight into the relationship between the species and the communities in which it lives.
Size variation is a feature of virtually all wild populations of plants (Weiner, 1990) and because fecundity is generally correlated with individual plant size, this variation can result in a few large plants of one generation contributing disproportionately to the next, with a consequent reduction in effective population size (Gottlieb, 1977). Size differences may be caused directly or through differences in growth rates due to age differences, generic variation, heterogeneity of resources, herbivory and competition (Weiner, 1985).
The distribution of plant species along elevation gradients is governed by a series of interacting biological, environmental and historical factors (Colwell and Lees, 2000). Elevation represents a complex gradient along which many environmental variables change simultaneously (Austin et al., 1996). Thus, the effect of each variable could be difficult to separate and these interacting factors would be difficult to disentangle. Furthermore, the observable associations between species distribution and elevation bands may help to understand the possible effects of environmental changes, e.g., by providing baseline information from which to measure or gauge the effect of climate change and anthropogenic changes on vegetation.
Some ecologists have focused their attention towards the vegetation of wadis that drain in the Red Sea. Among them (Sharaf El-Din and Shaltout, 1985) and Dargie and El-Demerdash (1991) (Wadi Araba), (Zareh and Faragali, 1991) (Wadi Abu-Ghusun) and (El-Sharkawy et al., 1982) and Sheded (1992) (Wadi Gimal). Little studies had been carried out on the size structure of the woody populations in Egypt. The study of shaltout and Ayyad (1988) on the structure and standing crop of Egyptian Thymalaea hirsuta populations could be considered the pilot study in this domain. Shaltout et al. (2003) studied the phytosociology and size structure of Nitraria retusa along the Egyptian Red Sea coast. In addition, the study of Al-Sodany (2003), dealt with the size structure and dynamics of the common shrubs in Omayed Biosphere Reserve in the Western Mediterranean coast of Egypt. The present study aims at studying the population structure of 10 common woody perennials, in terms of size distribution, height, diameter and density in Wadi Gimalalong the Red Sea coast of Egypt. It aims also at assessing effect of elevation on the size, distribution and density of the investigated species.MATERIALS AND METHODS
Study area: Wadi Gimal lies at the South of Mersa Alam City, along the Red Sea Coast of Egypt (Fig. 1). It originates in the Red Sea mountainous terrain skirting the coastal plain.
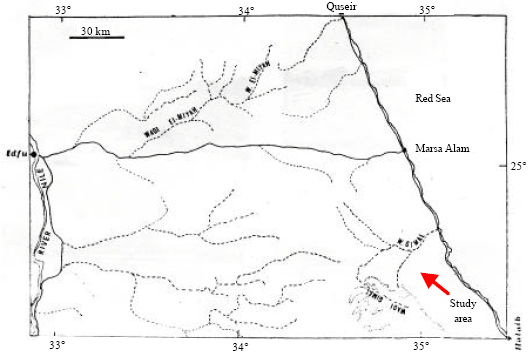 | |
| Fig. 1: | Location map of the study area (after El-Sharkawy et al., 1982) |
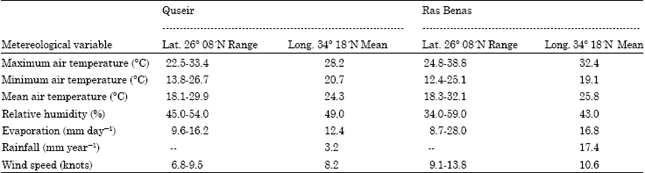
The wadi runs almost east along its drainage course and ends in a rather narrow deltaic part near the coastline. One of its tributaries originates alongside the Samuki Mountain, one of the highest summits in the Red Sea ridge South of the main course of the wadi. This wadi is bound on both sides by elements of these high ridges of the igneous rocks which, due to frequent changes in their orientation, resulted in a meandering course. In isolated patches, soil of fine sand and silt is accumulated in thin layers and these are usually catchment loci of wind blown material. The location of such loci is apparently dependent on changes in course and orientation of such a change (El-Sharkawy et al., 1982). Wadi Gimal originates from the watershed, which runs along the basement mountain range and drains towards high hills of which Gabal Nugrus, G. Hafafit, G. Zabara and G. Samuki are conspicuous. These mountains are composed of igneous and metamorphic rocks. Through, its course toward the East, it crosses the coastal sedimentary rocks composed mainly of sandstone, shales and marls. Inhabitants of this wadi and others to the South are nomads belonging to a widely spread tribe Bashariya who live partly in Sudan (El-Sharkawy et al., 1982). Wadi Gimal had declared as a desert protected area in 2003 with an area of about 7450 km2, including the studied wadi. Climatologically, the study area belongs to the category of 'warm coastal deserts' of Meigs (1973). The climatic gradients from Quseir in the North to Ras Benas in the South are indicated in Table 1 (Anonymous, 1980).
Data collection: Eighteen stands (100x100 m) were selected (during the period from spring to summer 2007) along the different elevation levels (I: less than 100 m, II: 100-300 m and III: more than 300 m.a.s.l.) to represent the different habitats associated with 10 common perennial species in Wadi Gimal along the Red Sea. These species are: 5 trees (Acacia tortilis subsp. raddiana, Acacia tortilis subsp. tortilis, Balanites aegyptiaca, Tamarix aphylla and Tamarix nilotica), 2 shrubs (Leptadenia pyrotechnica and Nitraria retusa) and 3 shrublets (Pulicaria undulata, Zilla spinosa and Zygophyllum coccineum).
| Table 1: | Long term annual averages of the metereological data of Quseir and Ras Benas stations along the Red Sea coast (Anonymous, 1980) |
 | |
The population structure of these species was evaluated in terms of size distribution. In each stand, the number of individuals of each species was counted and the height (H) and mean crown diameter (D) were measured (based on 2-4 diameter measurements/ind.). The size index of each individual was calculated as the average of its height and diameter [(H+D)/2] and its volume was calculated as a cylinder. The size estimations were then used to classify population into 6 size classes; 20 > size > 80 cm for shrublets, 100 > size > 500 cm for shrubs and 2 > size > 10 m for trees. The absolute and relative frequency of individuals and mean height, diameter and height to diameter ratio per individual in each size class were then determined (Shaltout and Ayyad, 1988). The soil samples were collected from each stand as profiles of 0-50 cm. Soil water extracts of 1:5 were prepared for the determination of EC, soil reaction, chlorides, bicarbonates, sulphates, calcium, magnesium, sodium and potassium (Allen et al. 1986). The relationship between the studied species and the soil variable was tested using the simple linear correlation coefficient (SPSS, 1999).
RESULTS
Ten common perennial species belonging to 8 families were distributed along the different elevation levels in Wadi Gimal. Leguminosae was represented by two species: A. tortilis subsp. raddiana and A. tortilis subsp. tortilis, Tamaricaceae was represented by other two: T. aphylla and T. nilotica and the other families were represented by only one species (Table 2). Seven species were phanerophytes: T. nilotica, L. pyrotechnica and N. retusa, two were chamaephytes: Z. spinosa and Z. coccineum and one hemicryptophytic species: P. undulata. The phytogeographical elements of the studied species indicated that all species are Saharo-Arabian elements: B. aegyptiaca and N. retusa or Saharo-Arabians intermingled by Sudano-Zambezian elements: A. tortilis subsp. raddiana and P. undulata.
Z. spinosa was the only species recorded along the three elevation levels, its population had the highest average density (800.5"637.5 ind. ha-1) with its maximum (1291.4 ind. ha-1) at elevation level I and its minimum (80.0 ind. ha-1) at level III (Table 2). On the other hand, the population of A. tortilis subsp. tortilis had the lowest average density (15.2"26.4 ind. ha-1). Two species were exclusively recoded in elevation level I: A. tortilis subsp. tortilis (density = 45.7 ind. ha-1) and T. nilotica (742.9 ind. ha-1), while other two species were only recorded in elevation level II: A. tortilis subsp. raddiana (60.0 ind. ha-1) and L. pyrotechnica (110.0 ind. ha-1). On the other hand, N. retusa (160.0 ind. ha-1) was only recorded in elevation level III.
The relationship between individual heights and diameters of the 10 species are simple linear with r values range between 0.241 for P. undulata and 0.959 for L. pyrotechnica (Table 3).
| Table 2: | Density (ind. ha-1), life forms and floristic categories of the 10 sampled species in Wadi Gimal |
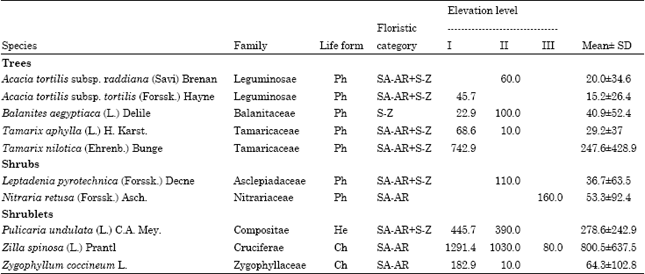 | |
| Ph: Phanerophytes, Ch: Chamaephytes, HE: Hemicryptophytes, SA-SR: Saharo-Arabian, S-Z: Sudano-Zambezian, SU: Sudanian | |
| Table 3: | Mean (upper line) and standard deviation (lower line) of the dimensions of the 10 studied species in Wadi Gimal |
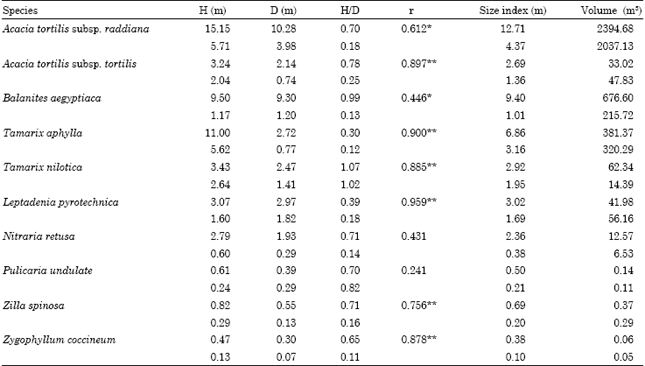 | |
| H: Height, D: Diameter, r: Simple linear correlation coefficient between height and diameter. *p< 0.05, **p< 0.01 | |
On the other hand, the mean of height to diameter ratio varies between 0.30 for T. aphylla and 1.07 for T. nilotica. A. tortilis subsp. raddiana occupied the largest volume (2394.68 m3), while Z. coccineum occupies the lowest (0.06 m3).
The diagrams illustrating the size distribution (Fig. 2a-d and 3a-e) of the 10 examined species indicated that T. nilotica and A. tortilis subsp. tortilis had more or less inverse J-shaped distribution along elevation level I, while Z. coccineum had the same distribution along elevation levels I and II. B. aegyptiaca had positive skewed distribution along elevation levels I and II.
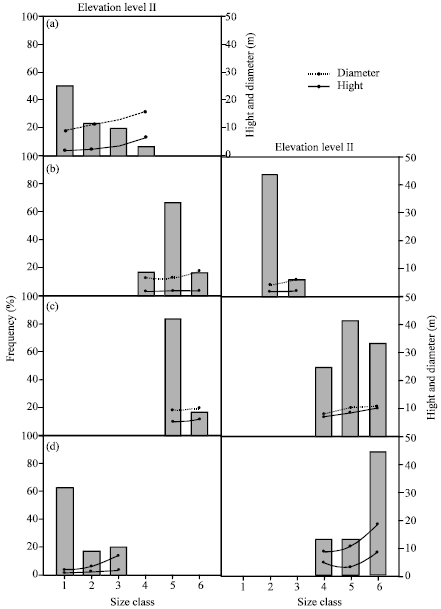 | |
| Fig. 2: | Size frequency distribution for the population of five trees in Wadi Gimal along the three elevation levels. The range of size classes are: 1:< 2, 2: 2-4, 3: 4-6, 4: 6-8, 5: 8-10 and 6: >10 m. (a) Tamarix nilotica, (b) Tamarix aphylla, (c) Balanites aegyptiaca and (d) Acacia tortilis subsp. tortilis |
On the other hand, T. aphylla had positive skewed distribution along elevation level I, but inverse J-shaped distribution along elevation level II. The population of Z. spinosa had approximately symmetrical (i.e., bell shaped) distribution along elevation level I, while J-shaped along elevation levels II and III. More or less J-shaped distribution was represented in A. tortilis subsp. raddiana at elevation level II and P. undulate along elevation levels I and II. N. retusa and L. pyrotechnica exhibited bell shaped size distribution along elevation level II and III, respectively.
Soil chemical analysis at the different elevation levels indicated that, soils at elevation level I were characterized by the highest values of salinity (1.10 mS cm-1) as well as bicarbonates, chlorides, sulphate, calcium, magnesium, sodium and potassium (0.39, 3.00, 0.93, 0.45, 0.46, 3.73 and 0.05 mg 100 g-1) (Table 4).
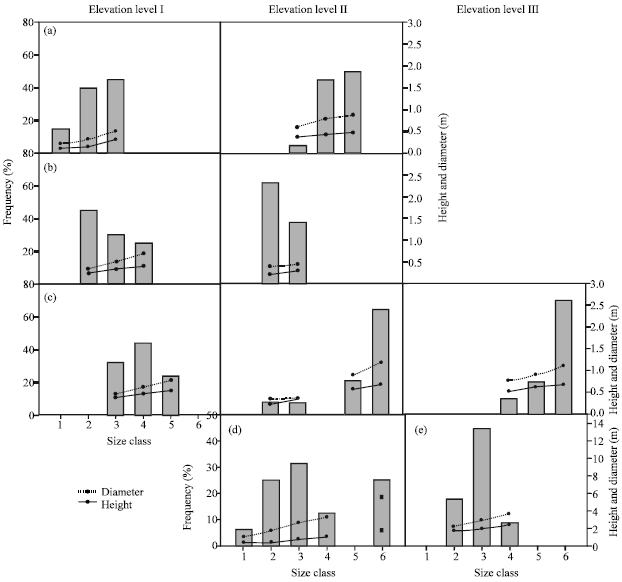 | |
| Fig. 3: | Size frequency distribution for the population of three shrublets and two shrubs in Wadi Gimal along the three elevation levels. The range of size classes are: 1: < 20, 2: 20-35, 3: 35-50, 4: 50-65, 5: 65-80 and 6: > 80 cm (For shrublets) and 1: <100, 2: 100-200, 3: 200-300, 4: 300-400, 5: 400-500 and 6: > 500 cm (for shrubs). (a) Pulicaria undulata, (b) Zyophyllum cocineum, (c) Zilla spinosa, (d) Leptadenia pyrotechnica and (e) Nitraria retusa |
| Table 4: | Mean±SD of the soil characteristics along the three elevation levels in Wadi Gimal |
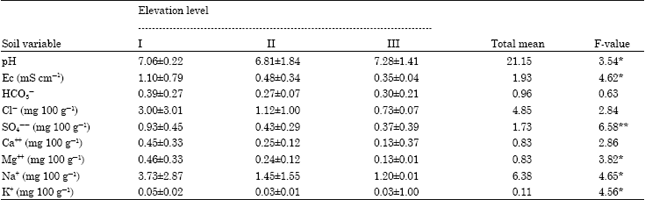 | |
| *p<0.05, **p<0.01 | |
| Table 5: | Simple linear correlation coefficient (r) between some soil variables and the size of the studied species |
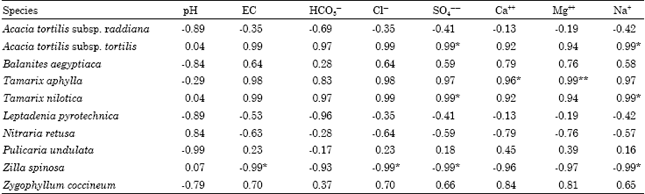 | |
| *p<0.05, **p<0.01 | |
On the other hand, soils at elevation level III were characterized by the lowest of salinity (0.35 mS cm-1) as well as chlorides, sulphate, calcium, magnesium, sodium and potassium (0.73, 0.37, 0.13, 0.13, 1.02 and 0.03 mg 100 g-1), but the highest of pH (7.28). The lowest value of bicarbonates (0.27 mg 100g-1) was recorded at elevation level II.
The size structure of some species was positively significant with some soil variable (Table 5) such as A. tortilis subsp. tortilis and T. nilotica with sulphate and sodium (r = 0.99 each) and T. aphylla with calcium and magnesium (r = 0.96 and 0.99, respectively). On the other hand, Z. spinosa had significant negative correlations with salinity, chlorides, sulphate and sodium (r = -0.99 each).
DISCUSSION
The life form spectra provide information, which may help in assessing the response of vegetation to variations in environmental factors (Ayyad and El-Ghareeb, 1982). The present study indicated the predominance of phanerophytes, which are important elements of semi-desert vegetation. On the other hand, Saharo-Arabian chorotype forms the major floristic structure of the study area. Plants of this chorotype are good indicators for the desert environmental conditions (Abd El-Ghani and Amer, 2003).
The distribution of plant species along elevation gradients is governed by a series of interacting biological, environmental and historical factors (Colwell and Lees, 2000). Further, elevation gradients create varied climates, along with resultant soil differentiation; promote the diversification of plant species (Brown, 2001). In the present study, A. tortilis subsp. raddiana was exclusively recorded in elevation level II, which may replace A. tortilis subsp. tortilis recorded in elevation level I. On the other hand, T. exhibits some overlap with T. nilotica along elevation levels I and II. Brown (2001) stated that species with limited elevation range always replace each other with some overlap along the mountainside. Moreover, the higher number of species in the lower elevation may be attributed to that low elevation may receive larger amount of runoff water than higher ones. Furthermore, the density of most species, except B. aegyptiaca, decreases as elevation increases and this could be due in part to ecophysiological constrains, such a reduced growing season, low temperature and low ecosystem productivity in high elevations (Körner, 1998). In addition, the boundary effect could also influence the plant density at high elevation (Colwell and lees, 2000; Gerytnes and Vetaas, 2002). Boundary effect is defined in relation to the degree of species resistance to dispersals and survival (Colwell and Lees, 2000). The distribution of Z. spinosa in all elevation levels may be du to that this plant can tolerate a wide ecological range of habitats. Other trees such as A. tortilis also show a high tolerance to stressful conditions (Wilson and Witkowsky, 1998).
The height and stem diameter of record-size individuals from different species are particularly important because they reveal the maximum size attained by phyletically or functionally different species groups, which are crucial to a variety of ecological and evolutionary hypotheses (Niklas et al., 2006). Plant height is a major parameter that has vital involvement to contribute most of plant yield (Siddiqui et al., 2007). The height-to-diameter ratio gives an idea about the growth habit of the plant. In the present study, this ratio is less than unity for most of the recorded species except T. nilotica. This means that the individual diameter exceeds their height, i.e., the individuals of these species tend to expand horizontally rather than vertically. According to (Shaltout and Mady, 2008), this behavior may be a strategy of the desert trees and shrubs in order to provide safe sites for their self-regeneration, as the horizontal expansion usually provides shade which leads to decrease the severe heating effect and increase the soil moisture. This result is in accordance with Shaltout et al. (2003) for N. retusa along the Red Sea Coastal land and Al-Sodany (2003) on the common shrubs in the Western Mediterranean coast of Egypt. On the other hand, T. nilotica expands vertically rather than horizontally and this may be attributed to the high density and consequently high intraspecific competition of this plant. Moreover, Lentz (1998) found that intraspecific competition significantly affected plant height and total mass, both independently and interactively. He emphasized that plant height decreased with increasing density. Moreover, Al-Quran (2005) reported that the higher elevations show a wider range of diameter classes than the lower elevation, although in most cases, their densities are extremely lesser of what exist in the lower elevation.
Plant population structure such as the distribution of plant size and distribution of reproductive effort and success has important evolutionary and conservation implications. For example, plant size distribution has frequently been shown to effect survivorship and reproduction (Harper, 1977; Wesselingh et al., 1997) and can be related to inter- and intraspecific competition (Harper, 1977; Jack, 1971). In the present study, some species had inverse J-shaped distribution (T. nilotica, A. tortilis subsp. tortilis and Z. coccineum) or positively skewed size distribution (B. aegyptiaca and T. aphylla). These may represent rapidly growing populations with high reproductive capacity. Such distributions may indicate also a high juvenile mortality (Harper, 1977), but nevertheless, they seem to represent long-term stability, since in most stable populations one could expect an excess of juvenile over mature individuals (Goldberg and Turner, 1986; Shaltout and Ayyad, 1988). Moreover, these distribution patterns are caused, through variations in growth rate, by factors such as: competition, heterogeneity of resources, genetic variation and small differences in the rate of emergence (Weiner and Solbrig, 1984).
The bell shaped size distribution of Z. spinoa, Leptadenia pyrotechnica and N. retusa along elevation levels I, II and II, respectively indicated comparable representation of the juvenile and mature individuals. If the current situation continues, a reduction in population size of these species is expected in the future. These results were coincided with that of (Shaltout and Mady, 2008) in their study on the size distribution of Lycium shawii in Central Saudi Arabia and Al-Sodany (2003) in his study on the size structure of Phlomis floccosa in the Western Mediterranean Coast of Egypt. The J-shaped size distribution of Z. spinosa, A. tortilis subsp. raddiana and P. undulata indicated the dominance of mature individuals over the juvenile ones. This distribution characterizes a declining population; because the population has a large proportion of larger individuals than smaller ones (i.e. limited regeneration capacity). This may indicate that the recruitment of these species is rare which may be related to hyper-aridity and low fertility. Similar conclusions were made by Al-Sodany (2003). In addition, Woody plants of xeric environments typically have considerable persistence and prolonged longevity; however, the opportunities for colonization and establishment of seedlings appear to be limited (Menges and Hawkes, 1998).
Size variability among plants has been observed to increase with higher stand density (Bonan, 1991) as well as elevation gradient, leading to the speculation that resource distribution among competing plants is primarily asymmetric rather than symmetric. The negative relationship between the density and size of the individual of some species probably means that their size is density-dependent. Individuals are bigger under low rather than high density. This could be explained as a competitive phenomenon, since plants with neighbors close by grow well than plants with few distant neighbors (Weiner, 1985) and may be related to the decrease in resources available for each individual with increasing density (Mithen et al., 1984). Furthermore, at high densities, competitive interactions overwhelm facilitative interactions, also leading to increased size inequality (Chu et al., 2009). Similar conclusions were reported in the studies of Shaltout and Ayyad (1988), Shaltout and El-Beheiry (2000) and Shaltout et al. (2003) on some Egyptian desert plants. The individuals of T. aphylla had positive skewed size distribution along elevation level I combined with higher species density and soil salinity, while inverse J-shaped distribution along elevation level II with lower density and salinity. This may indicate stability of its population as well as the predominance of juveniles over mature individuals. Uunder high densities, small individuals may die, resulting in fairly predictable relationships between average plant size and density (White and Harper, 1970), through a process commonly referred to as self-thinning. In addition, Bonan (1991) reported that size variability did not increase with higher stand densities when neighbourhood competition was constant for all plants. On the other hand, the population of Z. spinosa had bell-shaped distribution along elevation level I and more or less J-shaped distribution along elevation levels II and III. This may indicate a comparable representation of the juvenile and mature individuals in lower elevation and with increasing elevation mature individuals predominate over juveniles indicating a limited regeneration capacity.
ACKNOWLEDGMENTS
Author wishes to thank prof. Ahmed G. Fahmy for his help in the field work and also Prof. Yassin M. Al-Sodany for kindly support, encouragement and reviewing the manuscript.
REFERENCES
- Al-Quran, S., 2005. Vegetation dynamics in the tafileh woodlands of Southern Jordan. Am. J. Environ. Sci., 1: 46-49.
CrossRefDirect Link - Al-Sodany, Y.M., 2003. Size structure and dynamics of the common shrubs in omayed biosphere reserve in the western Mediterranean coast of Egypt. Ecol. Med., 29: 39-48.
Direct Link - Austin, M.P., J.G. Pausas and A.O. Nicholls, 1996. Patterns of tree species richness in relation to environment in south-eastern New South Wales, Australia. Aust. J. Ecol., 21: 154-164.
CrossRef - Ayyad, M.A. and R.E.M. El-Ghareeb, 1982. Salt marsh vegetation of the western Mediterranean desert of Egypt. Vegetatio, 49: 3-19.
CrossRef - Bonan, G.B., 1991. Density effects on the size structure of annual plant populations: An indication of neighbourhood competition. Ann. Bot., 68: 341-347.
Direct Link - Brown, J.H., 2001. Mammals on mountainsides: Elevational patterns of diversity. Global Ecol. Biogeogr., 10: 101-109.
CrossRefDirect Link - Chu, C.J., J. Weiner, F.T. Maestre, S. Xiao and Y.S. Wang et al., 2009. Positive interactions can increase size inequality in plant populations. J. Ecol., 97: 1401-1407.
CrossRef - Colwell, R.K. and D.C. Lees, 2000. The mid-domain effect: Geometric constraints on the geography of species richness. Trends Ecol. Evol., 15: 70-76.
Direct Link - Dargie, T.C.D. and M.A. El-Demerdash, 1991. A quantitative study of vegetation-environment relationships in two Egyptian deserts. J. Veg. Sci., 2: 3-10.
Direct Link - Grytnes, J.A. and O.R. Vetaas, 2002. Species richness and altitude: A comparison between null models and interpolated plant species richness along the Himalayan altitudinal gradient, Nepal. Am. Nat., 159: 294-304.
PubMed - Goldberg, D.E. and R.M. Turner, 1986. Vegetation change and plant demography in permanent plots in the Sonoran desert. Ecol., 67: 695-712.
CrossRef - Gottlieb, L.D., 1977. Genotypic similarity of large and small individuals in a natural population of the annual plant Stephanomeria exigua ssp. coronaria (Compositae). J. Ecol., 65: 127-134.
Direct Link - Jack, K.W., 1971. The influence of tree spacing on Sitka spruce growth. Irish Forestry, 28: 13-33.
Direct Link - Korner, C., 1998. A re-assessment of high elevation treeline positions and their explanation. Oecologia, 115: 445-449.
Direct Link - Menges, E.S. and C.V. Hawkes, 1998. Interactive effects of fire and microhabitat on plants of Florida scrub. Ecol. Appl., 8: 935-946.
Direct Link - Mithen, R., J.L. Harper and J. Weiner, 1984. Growth and mortality of individual plants as a function of available area. Oecologia, 62: 57-60.
CrossRef - Niklas, K.J., E.D. Cobbi and T. Marler, 2006. A comparison between the record height-to-stem diameter allometries of Pachycaulis and Leptocaulis species. Ann. Bot., 97: 79-83.
CrossRefDirect Link - Nobel, S.P. and C.A. Franco, 1989. Effect of nurse plants on the microhabitat and growth of cacti. J. Ecol., 77: 870-886.
Direct Link - Pugnaire, F.I., P. Haase, J. Puigdefa-Bregas, M. Cueto, S.C. Clark and L.D. Incoll, 1996. Facilitation and succession under the canopy of a leguminous shrub, Retama sphaerocarpa, in a semi-arid environment in South-East Spain. Oikos, 76: 455-464.
Direct Link - Pugnaire, F.I., J. Puigdefa-Bregas and P. Haase, 1996. Facilitation between higher plant species in a semiarid environment. Ecol., 77: 1420-1426.
Direct Link - Shaltout, K.H. and M.A. Ayyad, 1988. Structure and standing crop of Egyptian Thymelaea hirsuta populations. Vegetatio, 74: 137-142.
Direct Link - Shaltout, K.H. and M.A. Mady, 2008. Current situation of the raudhas woody plant populations in the Central Saudi Arabia. Fedd. Rep., 104: 503-509.
CrossRef - Shaltout, K.H., M.G. Shededw, H.F. El-Kady and Y.M. Al-Sodanyz, 2003. Phytosociology and size structure of Nitraria retusa along the Egyptian Red Sea coast. J. Arid Environ., 3: 331-345.
CrossRefDirect Link - Sharaf El-Din, A. and K.H. Shaltout, 1985. On the phytosociology of Wadi Araba in the eastern desert of Egypt. Proc. Egyptian Botanical Soc., 4: 1311-1325.
Direct Link - Siddiqui, M.H., F.C. Oad and U.A. Buriro, 2007. Response of cotton cultivars to varying irrigation regimes. Asian J. Plant Sci., 6: 153-157.
CrossRefDirect Link - Valiente-Banuet, A., O. Briones, A. Bolongaro-Crevenna, E. Ezcurra and H. Nunez et al., 1991. Spatial relationships between cacti and nurse shrubs in a semiarid enviroment in central Mexico. J. Veg. Sci., 2: 15-20.
Direct Link - Valiente-Banuet, A. and E. Ezcurra, 1991. Shade as a cause of the association between the cactus Neobuxbaumia tetetzo and the nurse plant Mimosa luisana in the Tehuacan Valley, Mexico. J. Ecol., 79: 661-671.
Direct Link - Weiner, J., 1985. Size hierarchies in experimental populations of annual plants. Ecology, 66: 743-752.
Direct Link - Weiner, J., 1990. Asymmetric competition in plant populations. Trends Ecol. Evol., 5: 360-364.
CrossRef - Weiner, J. and O.T. Solbrig, 1984. The meaning and measurement of size hierarchies in plant populations. Oecologia, 61: 334-336.
CrossRefDirect Link - Werner, P.A. and H. Caswell, 1977. Population growth rates and age vs. stage distribution models for teasel (Dipsacus sylvestris Huds.). Ecol., 58: 1103-1111.
Direct Link - Wesselingh, R.A., P.G.L. Klinkhamer, T.J. de Jong and L. Boorman, 1997. Threshold size for flowering in different habitats: Effects of size-dependent growth and survival. Ecol., 78: 2117-2132.
Direct Link - White, J. and J.L. Harper, 1970. Correlated changes in plant size and number in plant populations. J. Ecol., 58: 467-485.
Direct Link - Wilson, T.B. and E.T.F. Witkowsky, 1998. Water requirements for germination and early seedling establishment in four African savanna woody plant species. J. Arid Environ., 38: 541-550.
CrossRef - Abd El-Ghani, M.M. and W.M. Amer, 2003. Soil-vegetation relationships in a coastal desert plain of Southern Sinai. Egypt J. Arid Environ., 55: 607-628.
CrossRefDirect Link