
E.O. Somoye
Department of Physics, Lagos State University, P.M.B. 10200, LASU Post Office, LASU, Ojo, Lagos, Nigeria
Asian Journal of Scientific Research
Year: 2010 | Volume: 3 | Issue: 1 | Page No.: 31-38


ABSTRACT
The relationship between the time interval between successive maxima of amplitude fading records, T and the fading periods of the same records, τ, is verified for E- and F-region echoes during 1958 International Geophysical Year (IGY) and 1964 International Quiet Year of the Sun (IQSY). This is in order to find how appropriate the film speeds of 0.10 and 0.05 inch sec-1 used during 1958 (IGY) and 1964 (IQSY) and to recommend appropriate film speed. The relationship is found to be valid for E-region echo during 1958. This relationship for E-region echo during 1964 and F-region echoes during 1958 and 1964 are found to deviate from the theoretical value of 3.60. The reason for this deviation is found in the film speeds employed during both years at Ibadan. The film speeds of 0.10 and 0.05 inch sec-1 used during 1958 and 1964, respectively are found inappropriate during both epochs. The film speed of 0.20 and 0.10 inch sec-1 are suggested for high and low sunspot epochs, respectively.
PDF Abstract XML References Citation
How to cite this article
E.O. Somoye, 2010. Appropriate Film Speed for Ionospheric Fading Records from Winds Equipment. Asian Journal of Scientific Research, 3: 31-38.
DOI: 10.3923/ajsr.2010.31.38
URL: https://scialert.net/abstract/?doi=ajsr.2010.31.38
DOI: 10.3923/ajsr.2010.31.38
URL: https://scialert.net/abstract/?doi=ajsr.2010.31.38
INTRODUCTION
Intensity of echoes of radio signals transmitting via the ionosphere is found to vary over time. This fading of radio signals is caused by irregularities-inhomogeneities in electron density (Kennedy and Davis, 2003; Somoye, 2009). The irregularities, acting as a diffraction screen, modify the amplitude and phase of radio wave by scattering the incident radiation (Rishbeth and Garriot, 1969). This is the type of fading measured by the winds equipment.
Other types of fading are (1) polarization fading and (2) multipath fading. In polarization fading, rotation of the plane of polarization of radio waves occurs after the wave passes through the ionosphere, since the ordinary (O) and the extraordinary (E) waves recombine. Fading occurs as a result of the phase difference of the two components. Multipath fading is due to multiple transmission paths caused by many reflections between the Ionosphere and receiver (Ratcliffe, 1970; Yau, 2006). The waves from the different paths could then interfere constructively or destructively when they arrived at the receiver depending on the phase difference.
The method for studying fading caused by ionospheric irregularities, in which three receivers located at the corners of a triangle whose sides were of a wavelength in length were used, time shifts between corresponding maxima and minima were measured. If fading was only caused by the drift of the pattern on the ground, fading records taken at two points in the line of drift will be similar. This is not observed to be so. Fading is then found to be due to changes taking place in the diffraction pattern formed on the ground as a result of the drift and deformations in the structure of the irregularities. Usually, the angular spectrum of the down coming waves is assumed to be randomly phased.
The fluctuations of the amplitude of the radio signals are photographed on a film moving in the horizontal direction. Two film speeds of 0.05 and 0.10 inch sec-1, depending on the fading rate of signals, are commonly used. The latter speed was used during 1958 while the former was used during 1964 at the equatorial station of Ibadan. 1958 (IGY) and 1964 (IQSY) being year of high and low sunspot numbers, respectively are considered in this study. Solar variability is expected to affect fading of radio signals (Bhattacharyya et al., 2006) and therefore film speed used for fading records.
It is the aim of this study to (1) investigate how appropriate these film speeds are with respect to how rapidly fading takes place in the two layers at different epochs of solar cycle and (2) to therefore recommend the film speed appropriate for the two layers at different epochs if the film speed are found inappropriate.
The knowledge of fading of radio signal, garnered from the analysis of appropriate fading film records, due to ionospheric irregularities becomes important to HF radio wave propagation (Jjenvkh et al., 2005; Yau, 2005) for the fact that unlike the other two types of fading which can be avoided by careful choice of transmitting and receiving aerial in the case of polarization fading and by a good choice of frequency in the case of multi-path fading, fading due to ionospheric irregularity cannot be avoided.
EXPERIMENTAL SET UP, DATA AND METHOD OF ANALYSIS
Drift and pattern parameters were measured by winds equipment that consisted of a pulse transmitter, an electronic switch, transmitting and receiving aerials, delayed pulse generator, a receiver and the display units.
The transmitter which is similar to Mark II ionosonde used in h'f has frequency coverage between 0.7 to 25 MHz. Pulses of width varying between 50 and 500 μsec are transmitted at a repetition rate of 50 sec-1. The receiver, a convectional heterodyne type is connected to the receiving aerials via the electronic switch which operates in such a way that one pulse is received from each of the three receiving aerials in turn, Fig. 1. A synchronizing pulse from a delayed pulse generator controls the operation of the electron switch.
 | |
| Fig. 1: | Triangular aerial array at ibadan |
This is to make the change over from each receiving aerial to another take place roughly half way between pulses from the transmitter. Two pulses are generated by another delayed pulse generator, one of which is fed to the ground of the camera CRT as a brightening pulse. The other employed as a strobe selecting pulse is used to brilliance-modulate the desired position of the trace on the monitor tube of the display unit.
The position of the transmitting aerial, a vertical rhombic loop terminated by impedance of 1000 ohms and of apex angle 135° and length 39 m is shown as Tx in Fig. 1. Echoes received at points 1, 2 and 3 were brought through coaxial cables. With matching impedances of 75 ohms to the receiver. Aerials at points 1, 2 and 3 refer to the North, South and West Aerials, respectively. With these arrangements at Ibadan, Skinner (1956) had shown that no appreciable extra-ordinary ray would be received. This is because in the neighbourhood of the magnetic equator, extra-ordinary rays are polarized along East-West direction. Thus arrangements of aerials in the North-South direction ensured that it is the ordinary rays that were transmitted and received.
The fading records of E- and F-region echoes during 1958 and 1964, the IGY and IQSY periods, respectively (Fig. 2a-d), were reduced by the use of a Dagma Super A (J.H. Mallens,
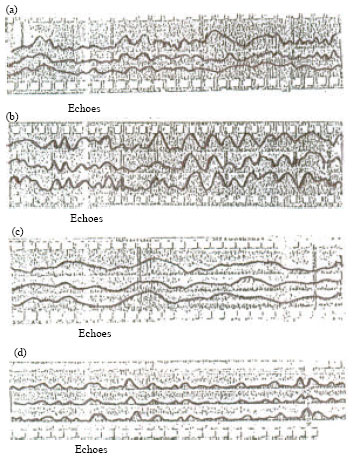 | |
| Fig. 2: | Typical amplitude fading records of F- and E-region echoes at Ibadan during 1958 and 1964. (Time marked at 10 sec Interval). (a) F-region echo on July 8, 1958, 1404 h, (b) F-region echo on November 19 1964, 1755 h, (c) E-region echo on Dec. 15, 1955 and (d) E-region echo on May 8, 1964, 1404 h |
 | |
| Fig. 3: | Typical Mean-Autocorrelation for (a) F region during 1958, (b) F region during 1964, (c) E region during 1958 and (d) E region during 1964, respectively |
N.V. Denlag, Hollard) projector which gave a good magnification of the records and with the aid of a plane mirror incorporated, conveniently, projected the record in the table placed in front of it. Scaling was done mostly at 300 points such that a period of about 30 sec covering an average of 20 fades was used for 1964 records. Skinner et al. (1962) have previously found a period of 24 sec covering 12 fades to be adequate. Full correlation analysis extended by Phillips and Spencer (1955) for anisotropic pattern is carried out to obtain the fading periods of each record.
The fading period is the time it takes the auto correlation function to fall to 0.61 (Fig. 3a-d). It has been found that the time auto correlation function is a good approximation to the Gaussian function up till the auto-correlation function falls to 0.61. Assuming the auto-correlation function to be Gaussian in form,
Then:
| (1) |
where, ρ (τ) is the auto-correlation function which measures the average correlation between values of the amplitude measured at time interval τ apart while τo is fading period.
The time τo, such that, ρ (τo) = exp (-1/2) = 0.61, may be taken as the fading period of the varying function. Bowhill (1956) has shown that the period τo is related to the average time interval, T, between successive maxima of the signal amplitude for a Gaussian time auto-correlation function. For a Gaussian probability distribution of the signal amplitude, T = 3.62 τo. The counting of maxima, one of the measures of fading speed, was employed (Somoye, 2009) in the selection of the fading records for the measurement of drift and pattern parameters of ionospheric irregularities. The inverse of the mean fading speed is known to give the mean time interval between successive maxima, T.
RESULTS
The mean fading period, τo of 30 fading records of F2-region echoes during 1958 is determined to be 0.64 sec (Fig. 3a) while the mean time interval between successive maxima, T, is found to be 1.67 sec from Fig. 4a. This implies that T = 2.62 τo. The factor 2.62 is lower than the theoretically predicted value of 3.62 by Bowhill (1956). This is as a result of over estimate of the number of maxima due to the counting of maxima which do not have significant effect on the auto-correlation function. It is this overestimate that has caused the underestimate of T.
From Fig. 4b, the mean time interval between successive maxima, T of F-region echoes during 1964 is found to be 3.33 sec. The mean fading period of 21 values of τo is 1.24 sec. This gives T = 2.69 τo, which is also lower than the value of 3.62 predicted by Bowhill (1956). This is also due to overestimate of the number of maxima by counting of insignificant maxima.
The full correlation analysis carried out for 18 fading records of E-region echoes during 1958 yielded a mean fading period, τo, of 0.92 sec (Fig. 3c). The mean of the time interval between successive maxima, T, of E-region fading records is determined as 3.33 sec from Fig. 4c.
 | |
| Fig. 4: | (a and b) F-region histogram of fading rates during 1958 and 1964, respectively and (c and d) E-region histogram of fading rates during 1958 and 1964, respectively |
This implies that T = 3.62 τo. This result is in good agreement with the theoretically predicted value, indicating that the magnitude of T was not underestimated, which implies that there was no counting of insignificant maxima. In actual fact, signals reflected from the E-region did not fade as rapidly as those from the F-region during the IGY in 1958 and the film speed of 0.10 inch sec-1 employed during 1958 rendered the amplitude maxima clearly distinguished in most of the cases.
For fading records of E-region echoes during IQSY in 1964 the mean period, τo, of 20 such records was 1.29 sec (Fig. 3d) while the mean of the time interval between successive maxima, T, is determined to be 3.33 sec from Fig. 4d. This yields T = 2.58 τo which is lower than the theoretically predicted value. The film speed of 0.05 inch sec-1 employed during this year seems to be a little low for amplitude maxima to be clearly distinguished, making for the counting of insignificant maxima which in turn resulted in T being underestimated.
DISCUSSION
While the most probable fading speed of F-region echoes during 1958, a period of maximum solar activity, is 30 maxima per minute (Fig. 4a), M the most probable fading speed of F-region echoes during 1964, a period of minimum solar activity, is 18 maxima per minute (Fig. 4b). During 1958 and 1964, the most probable fading speeds of E-region echoes are 18 maxima (Fig. 4c and d) indicating no change in fading rate of E region echoes with solar cycle. E-region drift velocity of the same irregularity responsible for fading is found to be independent of solar cycle at Ibadan and Jicarmaca by Oyinloye and Onolaja (1977) and by Carlderon and Woodman (1975), respectively. Also, drift and pattern parameters of E-region irregularity do not vary with solar cycle (Somoye, 2009) which may be because the electromotive force induced by the motion of tidal wind producing the turbulence is fairly independent of solar activity (Appleton, 1959). The present result implies that the most probable fading speed of F-region echo during 1964 is the same as those of E-region echoes. During 1958, however, the most probable fading speed of F-region is much higher than that of E-region. Dagg (1957) pointed out that F-region irregularities are produced by transference of E-region irregularities via highly conducting geomagnetic field lines into F-region. The conductivity of the geomagnetic field lines is expected to increase with solar activity as the earth magnetic field does (Chapman and Bartels, 1940). This may be responsible for the increase in the production of F-region irregularities which will make for high probable fading speed during 1958. A similar trend was observed in the results of drifts of irregularities of both regions in which drift values are in the same neighbourhood for F-region irregularities during 1964 and E-region irregularities during 1958 and 1964, but differ significantly for F-region irregularities during 1958 (Somoye, 2009). It is therefore expected that the same film speed should be used for the recording of E-region echoes during 1958 and 1964 and F-region during 1964. That the film speed of 0.10 inch sec-1 used to record E-region echoes during 1958 yielded a factor which agrees with the theoretically predicted value shows that the film speed of 0.10 inch sec-1 should have been used to record E- and F-region echoes during 1964, i.e., twice what was used.
E-region echoes during IQSY in 1964 and F-region echoes during IGY in 1958 and IQSY in 1964 yielded factors which are lower than the theoretically predicted value because a lower film speed than appropriate was used to record the amplitude fading records of these echoes. The experimental values obtained for E- and F-region echoes of IQSY in 1964 are in the neighbourhood of the value obtained for F-region echoes during IGY in 1958. This suggests that the film speed employed in recording F-region echoes during 1958 is also lower than should have been used being that F-region echoes during 1958 experienced fading more than the echoes of E- and F-region during 1964.
A film speed twice what was used, i.e., 0.10 inch sec-1 instead of 0.05 inch sec-1 for E- and F-region echoes of 1964 and 0.20 inch sec-1 instead of 0.10 inch sec-1 for F-region echoes of 1958 may yield factors that will agree with the theoretically predicted factor and give clear fading records that will eliminate counting of insignificant maxima.
Appropriate film speed is important to the determination of correct magnitude of drift pattern parameters of ionospheric irregularities responsible for the fading of radio signals.
CONCLUSION
Fading records of E- and F-region echoes of IQSY in 1964 and those of F-region echoes of IGY in 1958 do not give the theoretically predicted factor in the relation between the fading period, τ and the time interval between successive maxima, T. Fading records of E-region echoes of 1958, however, gave this theoretically predicted factor. The film speed employed in the recording of amplitude of echoes during 1958 and 1964 are responsible for these results. While the film of 0.10 inch sec-1 is found to be adequate for 1958 E-region echoes, that of 0.05 inch sec-1 is inadequate for E- and F-region echoes during 1964, a year of low solar activity, neither is the film speed of 0.10 inch sec-1 adequate for F-region echoes of 1958, a year of high solar activity. Film speed of 0.10 inch sec-1 is suggested for E-region echoes during any epoch of solar cycle and F-region echoes during low solar activity while the film speed of 0.20 inch sec-1 is suggested for F-region echoes during periods of high solar activity.
REFERENCES
- Appleton, E.V., 1959. The normal E-region of the ionosphere. Proc. IRE, 47: 155-159.
CrossRefDirect Link - Bhattacharyya, A., B. Engavale, D. Tiwani and S. Bose, 2006. Effect of solar variability on transionospheric radio wave propagation in the equatorial region. Proceedings of the ILWS Workshop, Feb. 19-24, Goa, India, pp: 25-25.
Direct Link - Oyinloye, J.O. and G.B. Onolaja, 1977. Solar cycle variation of Ionospheric E-region horizontal drift at Ibadan. J. Atmos. Terrestrial Physics, 39: 1353-1356.
Direct Link - Phillips, G.J. and M. Spencer, 1955. The effect of an isometric amplitude pattern in the measurements of ionospheric drifts. Proc. Phys. Soci., 68: 481-492.
CrossRef - Somoye, E.O., 2009. Comparison of results of drift measurement of E- and F-region irregularities at Ibadan. Int. J. Phys. Sci., 4: 107-110.
Direct Link - Yau, K.S.B., 2006. Fading of High frequency radio signals propagating in the ionosphere, results from the jindalee radar experiment. Proceedings of the 10th IET International Conference on Ionospheric Radio Systems and Techniques, Jul. 18-21, London, UK., pp: 7-11.
CrossRefDirect Link