
Z.M. Kalaba
Department of Poultry Production, Faculty of Agriculture, Mansoura University, 35516, Egypt
Asian Journal of Poultry Science
Year: 2012 | Volume: 6 | Issue: 3 | Page No.: 65-78


ABSTRACT
For rabbits, minimum space allowances and stocking densities should always refer to the final weight that rabbits would reach. To investigate the effects of cage density on growth performance and some blood parameters of rabbits, ninety California rabbits (27-day old) were housed in wire cages (50x50x30 cm for each) in groups of 1, 2, 3 and 4 rabbits/cage; corresponding to stocking densities of 4, 8, 12 and 16 rabbits m-2 for G1, G2, G3 and G4, respectively. From weaning up to 12 week of age, G1 showed the highest (p<0.05) weight and gain with the best feed conversion. At 12 week of age, values of hemoglobin (g dL-1), red blood cell count, lymphocytes (%), packed cell volume (%) and mean corpuscular volume (fl) were highest (p<0.05) in G2. Mean corpuscular hemoglobin (pg cell-1) and mean corpuscular hemoglobin concentration (g dL-1) were highest (p<0.05) in G1, while G4 showed the highest (p<0.05) white blood cell count. Concentration of total protein, globulin and creatinine was highest (p<0.05) in G1. Aspartate transaminase and alkaline phosphatase activities were higher (p<0.05) in G4 and G3 than in G1 and G2. Albumin concentration and activity of alanine transaminase were not affected. Concentration of ACTH and corticosterone was highest (p<0.05) in G4, while cortisol was highest (p<0.05) in G4. In conclusion, 4 rabbits per cage (16 animals m-2; 32 kg m-2) could be an acceptable threshold in terms of good growth performance without any adverse effects on welfare of California rabbits under the intensive production in Egypt.
PDF Abstract XML References Citation
Received: June 03, 2012;
Accepted: August 14, 2012;
Published: October 12, 2012
How to cite this article
Z.M. Kalaba, 2012. Physiological Response and Stress Indicators of California Rabbits under Intensive Conditions in Egypt. Asian Journal of Poultry Science, 6: 65-78.
DOI: 10.3923/ajpsaj.2012.65.78
URL: https://scialert.net/abstract/?doi=ajpsaj.2012.65.78
DOI: 10.3923/ajpsaj.2012.65.78
URL: https://scialert.net/abstract/?doi=ajpsaj.2012.65.78
INTRODUCTION
In different countries of the world, rabbits are kept in cages either individually or in groups of variable size, from weaning up to marketing weight (Morisse and Maurice, 1997). Several authors studied the effect of cage density and housing system on welfare and production of rabbits (Verga et al., 2006; Jordan et al., 2006; Szendro and Luzi, 2006). Cage size should allow each growing rabbit at all age intervals to stretch full length along one side of the cage and to sit up straight the height of the cage (Onbasilar and Onbasilar, 2007). Also, a appropriate cage space is needed for young rabbits fitting the increased activity and rapid locomotion (Lehmann, 1987).
Cage floor area should be 1350 cm2 for rabbit of <2 kg (NRC, 1996), 1200 cm2 for rabbits <10 weeks of age (CoE, 2004) or 450-600 cm2 for growing rabbits (EFSA, 2005). In intensive conditions, biological and ethological needs have to be taken into consideration in rabbits (Morisse and Maurice, 1994). Stocking density from weaning until marketing must reflect the needs of growers at the end of the fattening period, because they are housed in the same conditions (EFSA, 2005). The effect of stocking density on growth performance or behavior of rabbits was studied by several authors (Xiccato et al., 1999; Lambertini et al., 2001; Trocino et al., 2004) indicating the negative effect of stocking density on performance of growing rabbits. Most of the previous studies were focused on welfare and performance as affected by cage density, however there are few published reports about the effects of cage density on growth and stress indicators in growing rabbits. Therefore, the aim of this study was to investigate the effects of cage density on growth performance and some blood parameters of growing California rabbits under commercial condition in Egyptian.
MATERIALS AND METHODS
This study was conducted at a private rabbit farm in Port Said City (Al-Abouty El-Gedida) location, located in the north eastern part of the Nile Delta, Port Said Governorate, Egypt, during the period from April 2011 to June 2011. Blood biochemical analysis was carried out at the Laboratory of Poultry Production, Faculty of Agriculture, Mansoura University, Egypt.
Experimental groups: Ninety weaned, 4 week old, unsexed California rabbits, weighing 650.03±1.42 g LBW were assigned to four similar experimental groups according to their live body weight at weaning (9, 18, 27 and 36 rabbits in the 1st, 2nd, 3rd and 4th group, respectively). Rabbits of each group were housed in nine flat-deck cages made of galvanized wire measuring 50x50x30 cm (lengthxwidthxheight). The cage density was 1, 2, 3 and 4 rabbits/cage for the 1st, 2nd, 3rd and 4th group, respectively. Each cage was equipped with a nipple drinker and feeder of total length 0.50 m outside the cage. Cages were set up in an open-sided rabbit house and managed under similar conditions. Photoperiod continuous, room temperature ranged between 23.8 and 28.9°C, relative humidity from 58 to 75% during the experimental period. Nine replicates of each rabbit group were assigned to one of the four following groups:
| • | 1st group: 1 rabbit/cagex9 cages = 0.25 m2/rabbit = 4 rabbits m-2 |
| • | 2nd group: 2 rabbits/cagex9 cages = 0.125 m2/rabbit = 8 rabbits m-2 |
| • | 3rd group: 3 rabbits/cagex9 cages = 0.083 m2/rabbit = 12 rabbits m-2 |
| • | 4th group: 4 rabbits/cagex9 cages = 0.063 m2/rabbit = 16 rabbits m-2 |
Feeding system: Rabbits in all experimental groups were fed the same basal diet which was formulated in pelleted form and contained 19% crude protein, 2.57% crude fat, 12.85% crude fiber and 40% nitrogen free extract. Ingredients of the basal diet are shown in Table 1.
| Table 1: | Ingredients of the basal diet fed to rabbits in all experimental groups |
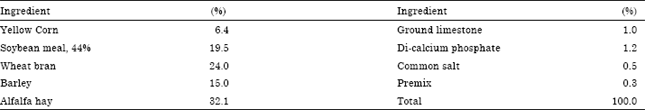 | |
| Premix: 3 kg contains Vit. A: 12,000,000 IU, Vit. D3: 3,000,000 IU, Vit. E: 10 mg, Vit, K3: 3 mg, Vit. B1: 200 mg, Vit. B2: 5 mg, Vit. B6: 3 mg, Vit. B12: 15 mg, Biotin: 50 mg, Folic acid: 1 mg, Nicotinic acid: 35 mg, Pantothenic acid: 10 mg, Mn: 80 mg, Cu: 8.8 mg, Zn: 70 mg, Fe: 35 mg, I: 1 mg, Co: 0.15 mg, Se: 0.3 mg | |
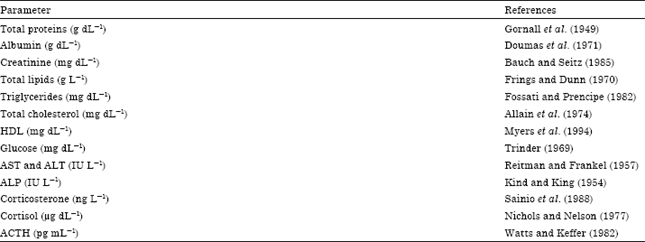
| Table 2: | References of criteria determined in blood plasma of rabbit |
 | |
Rabbits in all groups were fed ad libitum and water was available through water one nipple in each cage. The experimental period lasted from 4 up to 12 week of age.
Experimental procedures: Live body weight and feed intake were weekly recorded, then total weight gain and feed conversion ratio were calculated at different week intervals of an experimental period from 4 to 12. Also, viability rate was calculated at the end of experimental period.
Blood sampling: At the end of the experimental period (12 weeks of age), individual blood samples were collected from the jugular vein of three slaughtered rabbits in each group into two heparinized tubes. The 1st tube of each rabbit was centrifuged at 4000 rpm for 15 min to separate blood plasma and stored at -20°C for determining the concentrations of plasma total protein, albumin, total cholesterol, High Density Lipoprotein (HDL), glucose, creatinine, triglycerides and total lipids, Activity of Aspartate (AST) and Alanine (ALT) transaminases and Alkaline Phosphatase (ALP) and hormonal concentration of corticosterone, cortisol and Adreno-cortico-trophic Hormone (ACTH). Concentration of globulin was calculated by subtracting total protein from albumin concentration, while concentration of Low Density Lipoprotein (LDL) was calculated by subtracting total cholesterol from HDL concentration. All traits were determined spectrophoto-metrically in blood plasma using commercial kits according to authors as shown in Table 2.
In the 2nd tube of each rabbit, concentration of Hemoglobin (Hb), count of Red Blood Cells (RBC) and White Blood Cells (WBC), Lymphocytes (%), Packed Cell Volume (PCV%), Mean Corpuscular Volume (MCV), Mean Corpuscular Hemoglobin (MCH) and Mean Corpuscular Hemoglobin Concentration (MCHC) were measured in whole blood using blood hematology analyzer (HB 7021) in the laboratory of Poultry Production, Faculty of Agriculture, Mansoura University, Egypt.
Statistical analysis: The obtained data were statistically analyzed by SAS (2004) program using the GLM model. The, by using the following model:
Yij = μ+Gi+eij |
| Where: | ||
| Yi | = | Observations of jth animal |
| μ | = | Overall population mean. |
| Gi | = | Effect of ith group |
| eij | = | Random error |
The significant differences among groups were tested using Multiple Range Test according to Duncan (1955).
RESULTS AND DISCUSSION
Growth performance
Live body weight: Results in Table 3 show that singly housed rabbits pushed through heaviest (p<0.05) Live Body Weights (LBW) at all experimental weeks than the socially housed rabbits, reaching 2281.1 g at 12 week of age. The pronounced differences in LBW appeared at 7 week of age, whereas quartet housed rabbits were the lightest (p<0.05) up to 12 week of age, being 1958.9 g. Seaman (2002) suggested that singly housed rabbits were more motivated for contact than previously socially housed rabbits. This may have been due to the contact being more novel to the singly housed rabbits. It is of interest to note that double housed rabbits did not differ significantly in LBW from those of singly housed rabbits up to 7 week of age (for 3 week after weaning). In accordance with the present results in California rabbits, single housing had greater LBW than group housing (Drescher and Loeffler, 1991). Final weight was higher (p<0.01) in rabbits housed in low-density pens (Di Meo et al., 2003). Increasing the number of animals from 2 to 4 in a cage resulted in a significant (p<0.01) decrease in final body weight (Mbanya et al., 2004).
On the other hand, Oliveira and Almeida (2002) found no effects of stocking densities on final body weight. In another study, Garcia et al. (2005) found that average weight per cage did not show significative differences according to different stocking densities (6, 7, 8 and 9 rabbits/cage). Also, no differences were observed among the densities (4.16, 8.33, 12.5 and 16.67 NZW rabbits m-2 with regard to final weight (Neto et al., 2007).
| Table 3: | Effect of cage density on average live body weight of growing rabbits at different ages |
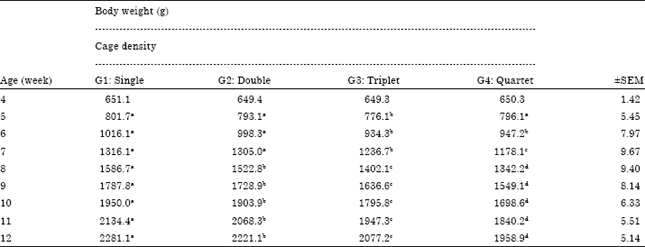 | |
| Values within the same row having different superscripts are significantly different at p≤0.05 | |
| Table 4: | Effect of cage density on total weight gain of growing rabbits at different age intervals |
 | |
| Values within the same row having different superscripts are significantly different at p≤0.05 | |
Villalobos et al. (2008) revealed that rabbit production expressed in kg m-2 increased linearly and quadratically with the density (p<0.008). Oliveira and Almeida (2002) found that the production in kilograms of meat per square meter increased linearly (p<0.05) in relation to stocking density (27.86; 31.45; 34.64 and 38.12 kg m-2). The rabbits could be reared in stocking densities equal to 54.54 kg m-2 during the fattening period and their growth performances do not vary (Garcia et al., 2005). Therefore, there was an increase in the meat production per square meter due to the higher density and consequently an increase in gross income and operational profit (Neto et al., 2007). Increasing group size resulted in lower values for body weight, but the differences were not significant (Szendro et al., 2009).
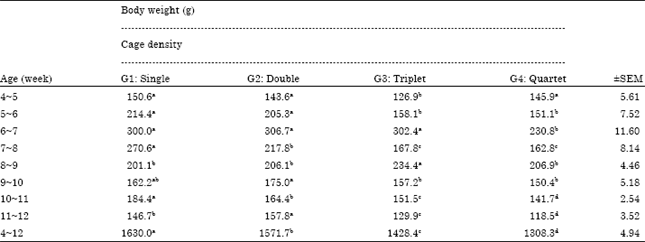
Body weight gain: Results in Table 4 show that singly housed rabbits revealed the heaviest (p<0.05) total weight gain, followed by doubled and triplet housed rabbits, respectively, at most week-intervals and during the entire length of the experimental period. Meanwhile, quartet housed rabbits showed the lowest weight gain at all age intervals, except at 4-5 week of age interval. It is of interest to note that double housed rabbits did not differ significantly in total weight gain from those of singly housed rabbits at most week-intervals. The highest weight gain in all groups was recorded at 6-7 week of age interval and this was associated with the highest feed intake during this interval as illustrated thereafter in Table 5.
In agreement with the present results, Paci et al. (2008) found that rabbits in group of 4 animals m-2 showed a significantly higher weight gain than groups of 8 or 16 animals m-2. Di Meo et al. (2003) reported that daily weight gain of rabbits housed in high-density was lower during the whole fattening period than that of low-density pens. In this respect, a significant decrease in daily weight gain of rabbits was observed by increasing the number of animals from 2 to 4 in a cage (Mbanya et al., 2004) and from 1 to 3 or 5 rabbits/cage (Onbasilar and Onbasilar, 2007). Also, for rabbits stocked at densities of 6.7, 10 and 13.3 rabbits m-2 (Grace and Olorunju, 2005) and 6, 12, 18 to 24 rabbits m-2 (Villalobos et al., 2008), average daily gain from weaning to the end of experimental period decreased per each unit by increasing the density/m2 at the beginning of the experiment. Onbasilar and Onbasilar (2007) found that young rabbits caged individually or in groups of 3 rabbits/cage were not different in body weight gain, being higher than the group having 5 rabbits/cage, especially from week 2 to week 6.
| Table 5: | Effect of cage density on average feed intake of growing rabbits at different age intervals |
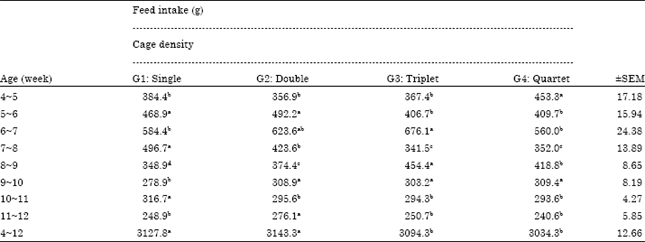 | |
| Values within the same row having different superscripts are significantly different at p≤0.05 | |
Also, Szendro et al. (2009) found that increasing group size resulted in lower values for weight gain and body weight, but the differences were not significant.
Garcia et al. (2005) reported that average weight per cage didn't show significant differences according to different stocking densities 6, 7, 8 or 9 rabbits/cage. Only, the average daily gain per cage showed significant differences between rabbits kept in lower stocking density than rabbits reared in higher densities, when the fattening rabbits had between 42-49 days old. This finding was indicated in our study, when average weight gain of rabbits showed significant differences by increasing density up to 4 rabbits/cage after the 7th week.
On the other hand, several investigators found no differences among the densities (4.16, 8.33, 12.5 and 16.67 NZW rabbits m-2 with regard to weight gain (Neto et al., 2007); for rabbits housed in pair cages (40x30 cm) and in six rabbit cages (40x90 cm) at the same space allowance (16.7 rabbits m-2, Luzi et al., 2000) or those kept in larger group sizes from 6 to 54 animals (at a density of 17 rabbits m-2, (Rommers and Meijerhof, 1998).
The gradual reduction in total body weight gain by increasing cage density in the present study may be explained by lower food intake and lower physical activity due to the crowding stress, as observed by Morisse and Maurice (1997) for rabbits caged at 5 animals/cage.
Feed intake: Results in Table 5 show pronounced differences in average feed intake among the experimental groups at each age interval. However, during the interval from 4 up to 12 week of age, feed intake was significantly (p<0.05) higher for singly and double housed than for triplet and quartet housed rabbits (3127.8 and 3143.3 vs. 3094.3 and 3034.3 g, respectively). Such trend may suggest competition among rabbits socially housed (more than 2/cage) for food, space and other vital requirements.
In accordance with the present results, Neto et al. (2007) found that the increase in stocking density (4.16, 8.33, 12.5 and 16.67 NZW rabbits m-2) reduced the daily feed consumption. Also, Villalobos et al. (2008) reported that average feed intake from weaning to the end of experimental period decreased (p<0.001) per each unit that the density increased (6, 12, 18 and 24 rabbits m-2) at the beginning of the experiment.
| Table 6: | Effect of cage density on feed conversion ratio of growing rabbits at different age intervals |
 | |
| Values within the same row having different superscripts are significantly different at p≤0.05 | |
Di Meo et al. (2003) mentioned that feed intake was higher in the rabbits housed in low-density, with the difference being significant only between 49-70 days. The confliction in feed intake throughout different week intervals among different densities as observed in this study was indicated by Grace and Olorunju (2005), who found a significant decrease in feed intake by individual rabbits as stocking density increases in week 1-2 and 3-4. However, Whary et al. (1993) reported that feed intake during the experimental period was significantly higher in group-housed rabbits than single-housed rabbits. On the other hand, some authors found no effects of stocking densities (Oliveira and Almeida, 2002) or stocking rate (5 vs. 10 m-2, Mbanya et al., 2004) on daily ration consumption of rabbits.
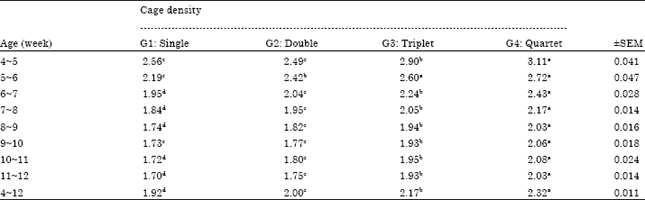
Feed conversion: Results in Table 6 revealed that singly housed rabbits showed significantly (p<0.05) the best Feed Conversion Ratio (FCR), followed by doubled and triplet housed rabbits, respectively, at all week intervals and during the entire length of the experimental period. While, quartet housed rabbits showed significantly (p<0.05) the worst FCR. It is of interest to note that FCR of rabbits in all experimental groups was in association with body weight gain of rabbits rather than feed intake.
Similarly, Onbasilar and Onbasilar (2007) found that groups having 5 rabbits/cage showed higher mean food: gain ratio than those held in cages with lower density (1 or 3 rabbits/cage). Rabbits less than 2 kg and less than 11 weeks of age showed a better growth and food: gain ratio in 1400 cm2 than 840 cm2 of floor area.
Also, Grace and Olorunju (2005) found that feed conversion ratio was poorer at higher densities (16.7 and 20 rabbits m-2) than at lower densities (6.7, 10, 13.3 rabbits m-2). Trocino et al. (2004) reported that food efficiency was better (p<0.05) in the groups having 625 cm2 floor area/rabbit than in groups having 825 cm2 floor area/rabbit. Also, Di Meo et al. (2003) observed that feed conversion was with more favourable values in rabbits housed in low-density. High cage density may decrease the possibilities for movement and had measurable adverse effects on the welfare of young rabbits (Onbasilar and Onbasilar, 2007).
On the other hand, some investigators found that stocking density had no effect on the growing rabbit performance (Neto et al., 2007; Villalobos et al., 2008; Szendro et al., 2009). Meanwhile, in NZW rabbits allocated as 1, 3 and 5 rabbits/cage to obtain three different cage density groups, 4200, 1400 and 840 cm2 floor area/rabbit, respectively. Onbasilar and Onbasilar (2007) found that the group having 5 rabbits per cage had significantly higher food:gain ratio (p<0.01) than other groups during the experiment.
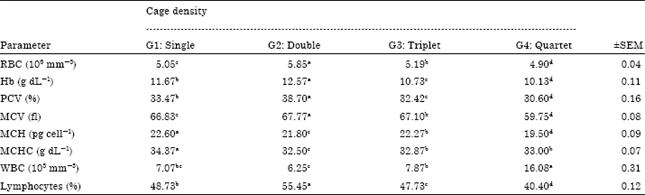
| Table 7: | Effect of cage density on hematological parameters of growing rabbits at the end of the experiment |
 | |
| Values within the same row having different superscripts are significantly different at p≤0.05 | |
Blood parameters
Hematological parameters: Results in Table 7 show that hematological values of Hb, RBC, lymphocytes, PCV and MCV of rabbits in all housed groups are within the normal range of rabbits, being significantly (p<0.05) the highest in doubled housed rabbits. Meanwhile values of MCH and MCHC were the highest significantly (p<0.05) in singly housed rabbits. Interestingly to note that quartet housed rabbits showed significantly (p<0.05) the highest WBC count (16.08x103 mm-3) as compared to other groups, being higher than the normal range of WBC in rabbits and lower PCV values (30.60%), being lower than the normal range of control rabbits (Mitruka and Rawnsley, 1977) or rabbits caged at different densities (Yakubu et al., 2008). The present results indicated good hematological parameters of singly housed rabbits as well as socially housed rabbits, except those in quartet group.
The situation in which an animal cannot adjust to its environment can result in reduced welfare for that animal (Mench, 1992) and may equally lead to health-related problems. According to Ovuru and Ekweozor (2004), hematological parameters can help in understanding the adaptability of the species to its rearing environment.
Although Yakubu et al. (2008) found no significant differences in WBC, lymphocytes of rabbits kept under four stocking densities, the high WBC noticed in this study by increasing density more than 3 rabbits/cage could be indicative of stress which elicits a defense response. The present study showed marked improvement in RBC, Hb, PCV and MCV for doubled housed rabbits and in MCH and MCHC for single housed rabbits. Similarly, Yakubu et al. (2008) found higher average PCV, Hb concentration, RBC and MCV for rabbits stocked at 10 and 14.3 compared to their counterparts raised at 20 and 25 rabbits m-2. The best erythrocytic variables were associated with a significantly higher (p<0.01) body condition score in rabbits stocked at 10 followed by those at 14.3, 20 and 25 rabbits/m2 corresponded to 2, 3, 4 and 5 rabbits/cage (50x40x30 cm). However, rabbits stocked at 20 and 25 rabbits m-2 appeared to be more stressed as indicated by the high neutrophil/lymphocyte ratio. They concluded that group-housing of rabbits at a density of 14.3 rabbits m-2 could guarantee and promote an improved welfare in a tropical environment. Aggressive behaviour was observed to be more frequent in the larger group sizes (Szendro et al., 2009).
In contrast to the present results, De la Fuente et al. (2004) found that PCV value was similar in rabbits stocked at 8 and 12 rabbits per cage. The differences between the two stocking densities, according to the authors were insufficient to improve rabbit welfare.
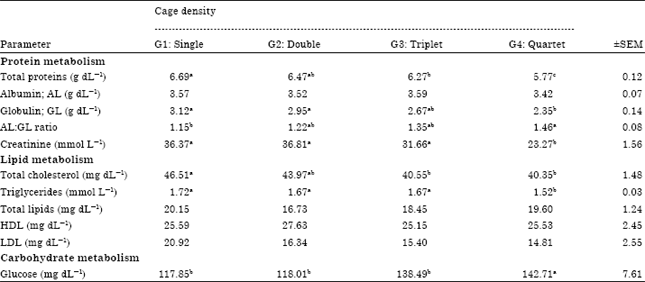
| Table 8: | Effect of cage density on concentration of some biochemicals in blood plasma of growing rabbits at the end of the experiment |
 | |
| Values within the same row having different superscripts are significantly different at p≤0.05 | |
Biochemical parameters: Results in Table 8 show that concentration of total protein, globulin and creatinine were significantly (p<0.05) the highest in singly housed rabbits, followed by doubled and triplet housed rabbits, respectively. Meanwhile, the lowest values were recorded in quartet housed rabbits, being within the normal ranges of total protein, globulin and creatinine in rabbits (Kalaba and Abdel-Khalek, 2010). However, albumin concentration was not affected significantly (p<0.05) by cage density. These results indicated normal protein metabolism and liver function of rabbits in all groups.
The observed increase (p<0.05) in cholesterol level by increasing cage density more than 2 rabbits/cage may suggest a general increase in lipid mobilization in singly or doubled housed groups. Serum cholesterol may also tend to rise with renal retention disease resulting in diminished removal of lipoproteins from the plasma, thus causing the concentration to increase markedly, (Ovuru and Ekweozor, 2004). In contrast to the present results, Perez et al. (1997) found that there were no statistically significant differences in total cholesterol values of isolated and grouped rats. Also, Onbasilar and Onbasilar (2007) observed that serum cholesterol level was similar among groups having 1, 3 and 5 rabbits/cage.
The significant increase (p<0.05) in triglyceride level occurred only by increasing cage density more than 3 rabbits/cage. In the same way, Onbasilar and Onbasilar (2007) observed that serum triglyceride levels were similar for groups having 1, 3 and 5 rabbits/cage. The present results indicated that levels of total lipids, HDL and LDL in blood plasma were not affected significantly by cage density.
In accordance with the present results, Onbasilar and Onbasilar (2007) found that serum glucose level was higher in groups having 5 rabbits/cage than in groups of 1 and 3 rabbits/cage. Also, they found that serum cholesterol and triglyceride levels in different density groups of male and female rabbits to be similar.
Health condition and stress indicators: Results in Table 9 show that activity of AST and ALP was significantly (p<0.05) higher in quartet and triplet than in singly and doubled housed rabbits. However, activity of ALT was not affected significantly by cage density.
| Table 9: | Effect of cage density on enzyme activity and hormonal profile in blood plasma of growing rabbits at the end of the experiment |
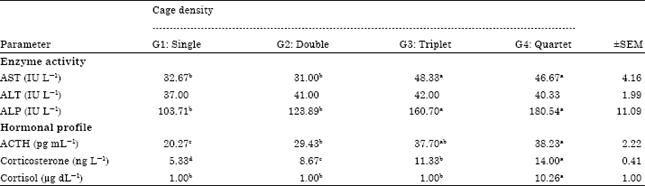 | |
| Values within the same row having different superscripts are significantly different at p≤0.05 | |
In the same line, hormonal concentration of ACTH and corticosterone showed gradually significant (p<0.05) increase by increasing cage density, being the highest in quartet housed rabbits, while cortisol concentration showed significantly (p<0.05) sharper increase only by increasing cage density up to 4 rabbits/cage. It is of interest to note that the trend of increase in ACTH was associated with that of corticosterone rather than that of cortisol.
According to the present results, increasing cage density led to marked increase (p<0.05) in ACTH level. The pronounced increase in ACTH level released from anterior pituitary is considered as the mean reason of increasing corticosterone and consequently cortisol level as a valid indicator for physiological stress. There are indications, however, that increased stocking density impacts negatively on rabbit welfare by increasing stress levels, as increased corticosterone levels have been reported by Onbasilar and Onbasilar (2007). In this respect, Onbasilar and Onbasilar (2007) observed also that plasma corticosterone levels of singly and 3 rabbits/cage were similar. However, corticosterone level of the group having 5 rabbits/ cage was higher (p<0.001) than those of groups having 1 or 3 rabbits/cage, indicating that the rabbits in cages with 5 animals had more stress. In mice, Barnard et al. (1994) showed a significant positive correlation between serum corticosterone level and group size. It is of interest to note that increasing plasma glucose level was positively associated with level of corticosterone and both are described as important indicators of stress as reported in chickens (Simon, 1984).
In contrast, Whary et al. (1993) reported that single and group housed female rabbits did not significantly differ in corticosterone level. Moreover, measuring baseline Glucocorticoid Metabolites (GCM) concentrations in feces is a useful tool to evaluate chronic stress and as a non-invasive indicator of stress (Buijs, 2011). The later authors found that cage size had no influence on GCM concentrations in feces of fattening rabbits kept in groups of eight, at seven different stocking densities between 5 and 20 animals m-2.
Young rabbits need more space since they are more active and perform more rapid locomotion than elders (Lehmann, 1987). Hoy (2008) reported that the minimum space per growing rabbit should be 700 cm2/rabbit in groups up to 5 rabbits and 600 cm2/rabbit in groups of more than 5 rabbits with a stocking density of 40 kg m-2. In the semi-humid tropics it was concluded that the optimum stocking density for rabbits is 13.3 rabbits m-2 (Grace and Olorunju, 2005) and allocation of 1 or 3 rabbits per cage had no measurable adverse effects on the welfare of male and female young rabbits (Onbasilar and Onbasilar, 2007). In the present study, floor area was 2500, 1250, 830 and 630 cm2/rabbit and 4, 8, 12 and 16 rabbits m-2 for densities of 1, 2, 3 and 4 rabbits/cage, respectively. However, acceptable values of growth performance of rabbits and without stress (free movement and no effects on the welfare of young rabbits) up to 12 week of age were obtained under the experimental conditions of this study with 830 cm2/rabbit in groups up to 3 rabbits with a stocking density of 24 kg m-2.
The viability rates in the present study were 100, 94.4, 92.6 and 88.9% for cage density of 1, 2, 3 and 4 rabbits/cage, respectively. Most mortality cases were due to lethal and serious injuries in ear and back of dead animals and occurred at the last weeks of the experimental period. The onset of the aggressiveness was observed during the last weeks of rearing in the higher group size that need a longer time to growth. In this respect, Villalobos et al. (2008) mentioned that rabbits housed at the highest density tended to show a higher incidence of ringworm (68.9 vs. 39.4%; p = 0.075), a higher injured animals (16.8 vs. 3.03%; p = 0.12) and a higher mortality (20.5 vs. 9.63; p = 0.043). These results may suggest the opportunity to raise even the slow growing rabbits with low group size (Paci et al., 2008). These findings seem to confirm that rearing young rabbits in mixed sex groups up to 3 rabbits/cage can be carried out without a major problem (Morisse and Maurice, 1997).
Although, a high cage density attenuates production costs, this might negatively influence growth rate and increase aggressive acts of animals (Maertens and de Groote, 1984; Bigler and Oester, 1996).
CONCLUSION
Based on the obtained results, increasing cage density more than 4 rabbits per cage with floor area of 2500 cm2, corresponding to a stocking density of 16 animals m-2 (i.e., 32 kg m-2 at 12 weeks of age) could induce stress effects in term of increasing levels of ACTH, corticosterone and cortisol as well as some disturbances in physiological response of rabbits. Therefore, 4 rabbits/cage (50x50x30 cm) could be an acceptable threshold for good growth performance without any adverse effects on welfare of California rabbits kept under the system of intensive production in Egypt.
REFERENCES
- Allain, C.C., L.S. Poon, C.S.G. Chan, W. Richmond and P.C. Fu, 1974. Enzymatic determination of total serum cholesterol. Clin. Chem., 20: 470-475.
CrossRefPubMedDirect Link - Barnard, C.J., J.M. Behnke and J. Sewell, 1994. Social behaviour and susceptibility to infection in house mice (Mus musculus): Effects of group size, aggressive behaviour and status-related hormonal responses prior to infection on resistance to Babesia microti. Parasitology, 108: 487-496.
Direct Link - Bauch, K. and W. Seitz, 1985. Determination of creatinine in the urine as a reference value of substances excreted by the kidney. Z Gesamte Inn. Med., 40: 201-205.
PubMedDirect Link - Neto, A.C., J.F. Lui, L.R.B. Dourado, J.A.F. Zanato, E.P. Filho, N.C. Garrafoni and L.P.G. da Silva, 2007. Effect of stocking density on the performance of growing rabbits. Biotemas, 20: 75-79.
Direct Link - CoE, 2004. Working party for the preparation of the fourth multilateral consultation of parties to the european convention for the protection of vertebrate animals used for experimental and other scientific purposes (ETS 123). Proceedings of the 8th Meeting of the Working Party, September 22-24, 2004, Strasbourg.
Direct Link - Di Meo, C., G. Stanco, G. Piccolo, S. Taranto, M.P. Gazaneo and A. Nizza, 2003. Productive performance of rabbits according to pre-weaning solid feed and milk intake. growing rabbits. Ital. J. Anim. Sci., 2: 51-58.
Direct Link - Doumas, B.T., W.A. Watson and H.G. Biggs, 1971. Albumin standards and the measurement of serum albumin with bromcresol green. Clin. Chim. Acta, 31: 87-96.
CrossRefPubMedDirect Link - EFSA, 2005. The impact of the current housing and husbandry systems on the health and welfare of farmed domestic rabbit. EFSA J., 267: 1-31.
CrossRefDirect Link - Fossati, P. and L. Prencipe, 1982. Serum triglycerides determined colorimetrically with an enzyme that produces hydrogen peroxide. Clin. Chem., 28: 2077-2080.
CrossRefPubMedDirect Link - Frings, C.S. and R.T. Dunn, 1970. A colorimetric method for determination of total serum lipids based on the sulfo-phospho-vanillin reaction. Am. J. Clin. Pathol., 53: 89-91.
PubMed - Garcia, A.I., J.C. de Blas and R. Carabao, 2005. Comparison of different methods for nitrogen and amino acid evaluation in rabbit diets. Anim. Sci., 80: 169-178.
Direct Link - Hoy, S.T., 2008. Guidelines for minimum standards on rabbit housing in Germany. Proceedings of the 9th World Rabbit Congress, June 10-13, 2008, Verona, Italy, pp: 1183-1187.
Direct Link - Kind, P.R.N. and E.J. King, 1954. Estimation of plasma phosphatase by determination of hydrolysed phenol with amino-antipyrine. J. Clin. Pathol., 7: 322-326.
CrossRefPubMedDirect Link - Lambertini, L., G. Vignola and G. Zaghini, 2001. Alternative pen housing system for fattening rabbits: Effects of group density and litter. World Rabbit Sci., 9: 141-147.
Direct Link - Grace, T.I.E. and S.A.S. Olorunju, 2005. Effect of stocking density on performance of growing rabbits in semi-humid tropics. Tropicultura, 23: 19-23.
Direct Link - Mbanya, J.N., B.N. Ndoping, R.T. Fomunyam, A. Noumbissi, E.S. Mbomi, E.N. Fai and A. Teguia, 2004. The effect of stocking density and feeder types on the performance of growing rabbits under conditions prevailing in Cameroon. World Rabbit Sci., 12: 259-268.
Direct Link - Morisse, J.P. and R. Maurice, 1994. Welfare and the intensive production of rabbits. Rev. Sci. Technol., 13: 131-152.
PubMedDirect Link - Morisse, J.P. and R. Maurice, 1997. Influence of stocking density or group size on the behaviour in fattening rabbits kept in intensive conditions. Applied Anim. Behav. Sci., 54: 351-357.
CrossRef - NRC., 1996. Guide for the Care and Use of Laboratory Animals. 7th Edn., National Academy Press, Washington, DC., USA., ISBN-13: 9780309053778, Pages: 140.
Direct Link - Onbasilar, E.E. and I. Onbasilar, 2007. Effect of cage density and sex on growth, food utilization and some stress parameters of young rabbits. Scand. J. Lab. Anim. Sci., 34: 189-195.
Direct Link - Ovuru, S.S. and I.K.E. Ekweozor, 2004. Haematological changes associated with crude oil ingestion in experimental rabbits. Afr. J. Biotechnol., 3: 346-348.
CrossRefDirect Link - Paci, G., C. Mozzoni, G. Preziuso, M. D'Agata and C. Russo, 2008. Outdoor Rearing System for Fattening Rabbits: Effect of Group Size. Proceedings 9th World Rabbit Congress, June 10-13, 2008, Verona, Italy, 1603-1607.
Direct Link - Perez, C., J.R. Canal, E. Dominguez, J.E. Campillo, M. Guillen and M.D. Torres, 1997. Individual housing influences certain biochemical parameters in the rat. Lab Anim., 31: 357-361.
PubMed - Reitman, S. and S. Frankel, 1957. A colorimetric method for the determination of serum glutamic oxalacetic and glutamic pyruvic transaminases. Am. J. Clin. Pathol., 28: 56-63.
CrossRefPubMedDirect Link - Rommers, J. and R. Meijerhof, 1998. Effect of group size on performance, bone strength and skin lesions of meat rabbits housed under commercial conditions. World Rabbit Sci., 6: 299-302.
Direct Link - Sainio, E.L., T. Lehtola and P. Roininen, 1988. Radioimmunoassay of total and free corticosterone in rat plasma: Measurement of the effect of different doses of corticosterone. Steroids, 51: 609-622.
PubMedDirect Link - Simon, J., 1984. Effects of daily corticosterone injection upon plasma glucose, insulin, uric acid and electrolytes and food intake pattern in the chicken. Diabetes Metab., 10: 211-217.
PubMed - Szendro, Z., Z. Matics, I. Nagy, M. Odermatt and Z. Gerencser et al., 2009. Examination of growing rabbits housed in pens without or with platform. Proceedings of the 16th International Symposium on Housing and Diseases of Rabbits, Furbearing Animals and Pet Animals, Celle, May 13-14, 2009, Germany, pp: 3-12.
- Trinder, P., 1969. Determination of glucose in blood using glucose oxidase with an alternative oxygen acceptor. Ann. Clin. Biochem., 6: 24-27.
CrossRefDirect Link - Gornall, A.G., C.J. Bardawill and M.M. David, 1949. Determination of serum proteins by means of the biuret reaction. J. Biol. Chem., 177: 751-766.
CrossRefPubMedDirect Link