
A. Prabhu Britto
Center for Medical Electronics: Department of Electronics and Communication Engineermg,
Anna University, (Thennai 600 025 India
G. Ravindran
Faculty of Information and Communication Engineermg, Anna I-Tniversity, Chennai 600 025, India
Journal of Medical Sciences
Year: 2007 | Volume: 7 | Issue: 1 | Page No.: 1-18


ABSTRACT
This study offers insight into the fascinating realm of cytogenetics, introducing the fundamental concepts of this area. Cytogenetics is the study of the structure and function of chromosomes. The various materials and methods of cytogenetis are discussed and analyzed. From the fundamentals to the latest research activities, detailed information is obtained through this study. Automated detection and classification of banded chromosomes may help clinicians diagnose cancers and other genetic disorders at an early stage more efficiently and accurately. Automation aspects are also dwelt in detail. This study will be a valuable resource to researchers in Cytogenetics.
PDF Abstract XML References Citation
How to cite this article
A. Prabhu Britto and G. Ravindran, 2007. A Review of Cytogenetics and its Automation. Journal of Medical Sciences, 7: 1-18.
DOI: 10.3923/jms.2007.1.18
URL: https://scialert.net/abstract/?doi=jms.2007.1.18
DOI: 10.3923/jms.2007.1.18
URL: https://scialert.net/abstract/?doi=jms.2007.1.18
INTRODUCTION
Cytogenetics-the fusion of the science of cytology (study of cells) and the science of genetics (study of inheritance)-is the study of the structure and the function of chromosomes. It is also useful in the study of human chromosomes in health and disease. Chromosome specimen from the living cells of an organism can be examined under a light microscope and the images can be enhanced with stains and fluorescing probes. Chromosomes are basically identified by size, centromere location and the visible banding pattern. Defects in chromosomes can lead to abnormalities in the structure or function of that particular organism.
Chromosome studies are an important laboratory diagnostic procedure in prenatal diagnosis; in patients with mental retardation and multiple birth defects; in patients with abnormal sexual development and in some cases of infertility or multiple miscarriages. Cytogenetic analysis is also useful in the study and treatment of patients with malignancies and hematologic disorders.
The human being has 23 pairs of chromosomes, 22 pairs being autosomes for body structure and function and a pair of sex chromosomes which determine whether the child is male or female along with other characteristics (Trask, 2002; Therman and Susman, 1993; Tjio and Levan, 1956).
Some of the 22 homologous pairs and two sex chromosomes that make up the normal human complement of 46 chromosomes can be identified based on their sizes and position of the Centromere, while others can only be classified into groups, as they are similar (Grasselli, 1969). These findings set off many discoveries that associated specific chromosomal abnormalities with disease in the late 1950s and quickly established the central role of Cytogenetics in medicine.
The erstwhile prevailing dogma had held the chromosome count at 48 for more than 30 years till the geneticist Painter (1923) had reported his observations of testicular cells. In the ensuing years, technological advances that have combined innovations in molecular biology, chemistry and instrumentation have transformed human Cytogenetics.
Fleming and Arnold first observed human chromosomes in the 1880s (Trask, 2002). Only three years after Watson and Crick (1953) elucidated the structure of the DNA helix was the chromosome number established as 46. Vogel and Motulsky (1997) ascribe this delay to both technological and politico-social causes.
However, soon after the number 46 was firmly established, scientists readily applied the new cytogenetic technique to the investigation of phenotype-genotype correlations in humans and began to tap useful information from naturally occurring chromosomal rearrangements.
At the Paris Conference (1972), a system was proposed for identifying human chromosome bands and indicating various chromosome abnormalities. Telomeres, centromeres and a number of prominent bands are used as “landmarks”. A section of a chromosome between two landmarks is called a region and these regions are numbered 1, 2, 3 and so on in both directions, starting from the centromere. The bands within the regions are numbered according to the same rule. Thus, the first band in the second region of the short arm of chromosome 1 is 1p21 (Harnden, 1985). Yunis (1980) has presented a corresponding system for prophase bands.
The cytogeneticist does not actually look at the molecular level of the chromosome. By observing the banding and centromere locations, the cytogeneticist identifies chromosomes, ascertains the appropriate number and type of chromosomes; detects abnormalities in banding such as deletions, inversions and translocations.
CYTOGENETICS
The field of human Cytogenetics was launched by Tjio and Levan (1956). A suspension of human mitotic cells (Hsu, 1979), when added to a serendipitous addition of water (before the cells were fixed and dropped onto glass microscope slides) caused the chromosomes to spread apart from each other so that Tjio and Levan (1956) could accurately count the full complement of 46 human chromosomes. Ford and Hamerton (1956) confirmed the number 46 by independent investigations.
In chromosome analysis, the picture under consideration is made up of discrete objects, the majority of which form distinguishable disjoint areas in the picture. One of the earliest methods of chromosome analysis used boundary tracing method discussed by Ledley et al. (1965).
Caspersson et al. (1968) discussed development of staining protocols that produced highly reproducible patterns of dark and light bands along the length of each chromosome, which became the barcodes with which Cytogeneticists could easily identify chromosomes, detect subtle deletions, inversions, insertions, translocations, fragile sites and other more complex rearrangements and refine breakpoints.
The bands appeared only in metaphase chromosomes with typically 400-800 visible bands. The band-naming convention resolved by the Paris Conference (1972) reflected the levels of resolution with which chromosomes can be analyzed. Yunis (1981) has pointed out that in prometaphase (when chromosomes are in the very early stages of condensation) up to 2000 bands can be discerned.
Cytogenetic information moved from the bench to the clinic in the late 1960s with the discovery that fetal cells could be obtained through Amniocentesis and could be checked for chromosomal abnormalities.
Through the painstaking analysis of chromosome banding patterns thousands of chromosomal abnormalities have been found to be associated with inherited or de novo disorders, generating many leads to the underlying molecular causes of these disorders as pointed out by Trask (2002).
Cells used for chromosome imaging and analysis are taken mostly from amniotic fluid, blood sample and bone marrow. Kyan et al. (1999) discussed that karyotyping is the most common procedure for analyzing and classifying banded chromosomes from images of a metaphase cell.
The karyotyping procedure defined the number and arrangement, size and structure of the chromosomes and assigned each chromosome to one of the 24 human chromosome classes as discussed by Harnden et al. (1985).
CYTOGENETIC METHODS
Slide preparation: From a cytogenetic point of view one is interested only in cells at metaphase-and, to a much lesser extent, the prophase-because only at these stages the chromosomes are visible as separate entities and can yield information (Sandberg, 1980). So one tries to maximize the number of metaphases by intervening in the normal mitotic cell cycle a process called culturing. Besides, it is essential to stain the chromosomes in order to visualize the details of diagnostic importance.
CULTURING
Mitosis itself takes only such a small fraction of the total mitotic cycle time. Hence, only a negligible fraction of cells in a preparation will be found in metaphase even with cells known to be dividing frequently in vivo (like bone-marrow cells). By culturing in vitro, one tries to increase the mitotic index, i.e., the fraction of cells actually involved in mitosis and to arrest this process such that at the moment of slide preparation a maximum number of cells is in metaphase.
Although many cells can be cultured the cells most often used in routine postnatal diagnosis are lymphocytes. The reason for this is that these cells are easily available from peripheral blood and that they can be cultured by adding phytohaemagglutinin (PHA) as a so-called mitogen and subsequent incubation in nutrient medium (Hungerford et al., 1959). The PHA has the effect of transforming the peripheral lymphocytes into more primitive blast-like cells capable of re-entering the mitotic cycle. The mitotic cycle time resulting from culturing is mostly between 12 and 72 h.
An essential step in counteracting the tendency of mammalian chromosomes to crowd together is the exposure of the cells to a hypotonic saline or other solution before fixation, e.g., 0.1 M KCl at 37°C for 10 to 20 min. This treatment will result in swelling of the metaphase cells and ready dispersion of the chromosomes. In direct preparations, i.e., without culturing, colchicines can be added to the hypotonic solution thereby combining the steps of metaphase arresting and dispersion. After fixation, the suspension is transferred to a microscope slide.
Staining: After the fixation, a preparation is made by dropping the cell suspension on a slide which is subsequently air dried. Then the slide is stained, nearly always with one of the following band techniques: G, Q, R, T, C or N.
| G: | G-banding, the most commonly used form of pretreatment after which Giemsa staining is usually applied. |
| Q: | The predecessor of the G-banding, the quinacrine-mustard stain. It has the advantage that no pretreatment is required, but the disadvantage being visible only in fluorescence microscopy with ultra-violet excitation. |
| R: | Reverse banding, i.e., light bands where G or Q show dark ones and vice-versa, by employing a pretreatment different from the one used in G-banding; |
| T: | Telomere banding, a congener of R-banding, in which the genetically inert telomeres are strongly stained. |
| C: | The so-called constitutive heterochromatin that can be visualized around the centromeres and in the distal part of the q-arm of the Y chromosome, employing Giemsa staining as in G-banding but with a different pretreatment. Because this procedure shows variations among individuals it can be used as a chromosome marker, e.g., 1qh+ indicating a C-band wider than normal on the q-arm of chromosome 1. |
| N: | The so-called nucleolar organizers, i.e., the stalks of acrocentric chromosomes. |
The distinct staining procedures other than G-banding are employed to make suspect aberrations more clearly visible. Like the culturing process, the preparation and each staining process also requires strict adherence to a given “recipe” because the results will otherwise show poor reproducibility.
METAPHASE FINDING
In the manual procedure, to locate the pro- and metaphase cells, the slide is scanned with low magnification (between x16 and x25) under the microscope.
When properly focused, the pro- and meta- phases are easily visualized because they show a very characteristic pattern of a cluster of a few dozen objects (the chromosomes) that differ from the other cells in size as well as in shape. For estimation of numerical abnormalities, metaphase quality is sufficient if the chromosomes are just countable.
For structural abnormalities, in some cases it is sufficient that the metaphases are just karyotypable but, in other cases, the elongatedness, the straightness and the degree of spreading of the chromosomes are more important. Sometimes, even the complete absence of touching and overlapping chromosomes is required. If the metaphase found is approved for analysis, it can be switched to high magnification (x100).
KARYOTYPING
Essentially the process of karyotyping consists of the following steps:
| • | Iolating metaphase and non-metaphase objects in the field of view; |
| • | Cunting the isolated chromosomes and labeling them according to length and centromere position; |
| • | Translating the chromosomes to the desired positions in the final karyogram and subsequently rotating them, until their main axes are vertical and their p-telomere is pointing upward; |
| • | Revising the resulting karyogram according to the banding patterns, in search for aberrations and (if they are present) determining their nature. |
It should be noted that karyotyping is necessary only structural aberrations are to be observed. However, the steps of locating, isolating and counting are always necessary even if the investigation is limited to numerical abnormalities.
OBJECT ISOLATION
In a manual system, the isolation of the metaphase in the field of view and the subsequent isolation of its components (the chromosomes) is performed purely visually. If the purpose is to estimate the numerical abnormalities, the process stops here with simply counting the chromosomes. If on the other hand the analysis requires a karyotype, a photographic step is necessary at this stage. A disadvantage of this step is the delay introduced by developing the film and making the prints. Besides, it confines further analysis to the photographic prints unless the metaphases are relocated again.
The prints are always of low quality than the original microscopic image because of the limited reflective contrast range of photographic paper as compared with a luminescent original. This apart, a photographic rendition is always confined to one focus plane whereas in the original image slight adjustments in focus may render some additional information.
CHROMOSOME CLASSIFICATION AND MANIPULATION
In the manual procedure, classification and manipulation cannot be distinguished as separate processes. The chromosomes are cut out of the photographic print with a pair of scissors and ordered, i.e., classified on a blank karyogram form. On the form, 47 vspaces are indicated; 44 for the autosomes, 2 for the X chromosomes and one for the Y chromosome. Besides, a few extra spaces allow for numerical abnormalities.
As pointed out before, the preliminary ordering is by length and centromere position but a trained cytotechnician will immediately take the banding patterns into account. In this way, the ordering not only results in a classification of the chromosomes but even in their identification, i.e., a classification into classes with only one member or at most two members for identical autosomes. If structural abnormalities are present they are also found in the same process, again using the banding pattern as a guide. It should be noted that even in the counting process, a skilled cytotechnician will employ some classification especially in the case of touching or overlapping chromosomes.
QUANTITATIVE METHODS
One of the most important applications of quantitative methods in cytogenetics has been the measuring of the DNA content of nondividing nuclei; for instance, in differentiated or malignant cells or in sperm. In spectrocytophotometry (which has been used for over 30 years) the light absorption of nuclei or chromosomes is determined (Patau, 1952). This has been done most successfully on stained nuclei, the stain most often used being Feulgen (Mendelsohn, 1966).
The light absorption of individual chromosomes or chromosome bands can be done in the same way (Drets and Seuanez, 1973; Drets, 1978). Drets and Monteverde (1987), Drets et al. (1990) have demonstrated that automated computerized scanning methods will play an increasingly important role in the analysis of nuclear and chromosome structure.
AUTOMATED CYTOGENETIC METHODS
In the field of Biological Pattern Recognition, Chromosomes were among the first objects to be studied using automated means. The contributing reasons for automating the process of chromosome analysis are:
| • | It is sufficiently straightforward |
| • | It is well defined to be a practicable proposition |
| • | It is sufficiently monotonous |
| • | The flow of cells for chromosome analysis is ever increasing and |
| • | The possibilities of increasing output by employing additional staff are limited. |
Since the 1980s, a series of semi-automatic cytogenetic analysis systems have been made commercially available with the ability to perform automatic metaphase finding or interactive karyotyping or both automatic metaphase finding and karyotyping (Lundsteen et al., 1992a).
In the 1980s, metaphase finding was done usually at night and hence a speed of 60 min per slide was acceptable. Later, there were two kinds of metaphase finders, viz., the fast finders that scan in less than 10 min per slide and the slow finders that take 30 to 90 min per slide to scan (Lundsteen and Martin, 1989). The false negative rate was about 20 to 30% whereas the false positive rate was about 0 to 50%. Metaphase finders could also rank the located objects (metaphases) for analysis according to their suitability or quality.
Manual karyotyping is time-consuming and expensive and had been the main challenge for automation over the years (Lundsteen and Piper, 1989; Piper and Lundsteen, 1987).
It took more than 30 min to produce a cut and paste karyotype in the traditional way but most laboratories found them important for control and documentation processes (Lundsteen et al., 1987; Lundsteen and Piper, 1989). All systems could handle banded material and the time taken for producing a karyotype was approximately 3 min for the fastest systems (Korthof and Carothers, 1991).
Lundsteen and Piper (1989) described two different approaches for interactive karyotyping. In the first approach, the operator points to the chromosomes and assigns the corresponding numbers (1 to 22 and X and Y). The system will then arrange the chromosomes in the karyotype. In the second approach, the system classifies the chromosomes automatically and the operator can make corrections if there is any classification error done by the system.
Lundsteen et al. (1991) have described another approach called multiple cell karyotyping. Here the operator relocates and counts a metaphase but lets the machine performs the karyotype of the metaphase automatically without any interactions while the next metaphase is relocated and counted. This process continues until a sufficient number of metaphases are counted and karyotyped. In this approach the machine and the operator work in parallel and time is saved.
Lundsteen et al. (1992b) also discussed a method of automatic assessment of band resolution or the number of bands of the metaphase/karyotype. The resolution reflects the accuracy by which breakpoints of structural chromosomal rearrangements may be determined and hence higher the resolution, the more exact is the cytogenetic diagnosis.
Visually searching for diagnosable chromosomes using a microscope and manually performing karyotyping is a labor-intensive and time-consuming process. Therefore, a computer-assisted system that can identify metaphase spreads, segment (touching or connected) chromosomes, define paired chromosomes (karyotyping) and analyze (or classify) band patterns of chromosomes would be a quite useful tool in clinical genetics laboratories to help clinicians detect and diagnose diseases more accurately and efficiently (Graham and Piper, 1994).
However, owing to the variation of cell culturing conditions, chromosome staining and microscope illumination, it is quite difficult to obtain clear microscopic chromosome images in a genetics clinical laboratory. Automatic segmentation and classification of chromosomes in noisy images have been a long-standing difficulty or technical challenge in the development of a computer-assisted system. A large number of novel techniques have been investigated by a number of research groups around the world over the last two decades.
Since the 1980s, automated chromosome detection and classification have attracted great research interest. Several studies have been conducted to develop computer-assisted chromosome detection and classification systems as well as to evaluate and improve their performance (Fig. 1).
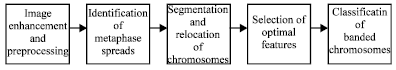 | |
| Fig. 1: | Illustration of a computerized system for automated detection and classification of banded chromosomes (Figure Courtesy: Wang et al., 2005) |
A computer-assisted system usually includes four processing steps:
| • | Image enhancement, |
| • | Chromosome segmentation (detection) and alignment, |
| • | Feature computation and selection and |
| • | Hromosome classification. |
Owing to the noisy nature of the chromosome images, various image enhancement techniques were tested and used to enhance the image before performing detection of metaphase spreads and classification of banded chromosome patterns. The purpose of this pre-process is to improve image contrast, reduce noise, correct for rotation and overlapping of chromosomes (Wang et al., 2001; Anderson et al., 2000; Wu et al., 2002).
A number of image processing techniques such as labeling, edge detection, size and shape measurement were applied in the computer-assisted systems to segment and define diagnosable chromosomes (Guimaraes et al., 2003). Once the chromosomes are segmented from the background pixels, the computer-assisted system computes a set of features. Different types of image features including texture, numerical, morphological features, density profile and frequency-domain features sampled from the results of wavelet or Fourier transformation have been investigated and compared to optimally represent chromosomes (Dudkin and Denissov, 1993).
Because the location and size of the centromere were important parameters to distinguish one chromosome from another, a number of algorithms added location and size information in the feature pool to the overall measurements and characterization of each chromosome (Piper and Granum, 1989). The computed features are often joined together to produce an initial feature vector. A feature selection process is applied to remove the redundant features and generate a small and optimal feature vector. After aligning randomly distributed chromosomes in karyotyping, computer-assisted schemes compared each testing feature vector to the feature vectors representing known (standard) chromosomes stored in a reference library and assign the testing chromosome to one of the 24 known chromosome categories.
A statistical model or a machine learning classifier based on an optimal feature vector or pixel value distribution is often trained and implemented in the last stage of a computer-assisted system in an attempt to automatically detect and diagnose subtle abnormal patterns (or distortion) of individual chromosomes or a cluster of banded chromosomes (Errington and Graham, 1993; Stanley et al., 1998).
AUTOMATION ASPECTS
Once the manual methods for slide preparation, metaphase finding and karyotyping are done, the possibilities for automation in each of these processes are examined. To avoid confusion, it is necessary to distinguish clearly among various definitions of automation (Rutovitz and Granum, 1981):
| • | The use of special equipment to enhance the capacity of the cytogeneticist, e.g., to identify and locate abnormality and variation of chromosome structure; |
| • | The extraction of better quantified information and more carefully controlled statistics; |
| • | The use of a machine to economise on effort and increase operator throughput, essentially to reduce costs. |
AUTOMATED METAPHASE FINDING
If the number of metaphases in a slide is low, it becomes very important not to miss any. Often several slides of one patient have to be scanned, in order to determine the fraction of metaphases originating from different cell lines with sufficient reliability at the cost of a considerable amount of viewing time. Automatic metaphase finding could generate considerable savings here. But even if one is not interested in detecting distinct cell lines, automated metaphase finding is attractive since it has the advantage of providing the metaphases most suitable for analysis according to objective criteria.
In automated metaphase finding, the positions of the metaphases that have been found are retained and some Figure 1 of merit is given to each one, which reflects the overall degree of contraction and straightness of the chromosomes and the estimated fraction of touching and overlapping ones. It should be noted that the Figure 1 of merit also depends on the requirements imposed by the subsequent analysis. After the whole slide has been scanned or a sufficient number of metaphases has been found (each with a sufficiently high Figure 1 of merit) the positions of the metaphases are ranked in descending order of Figure 1 of merit for further analysis at higher magnification mostly with a x100 (oil immersion) objective. To this end, the metaphases have to be relocated, requiring that their positions are known with a precision of 100 μm because the field of view of a x100 objective is about 200 μm in diameter.
OPTICAL METHODS
In one of the earliest attempts to automate metaphase finding, the optically Fourier transformed image was scanned for increased high frequency components that might be indicative for metaphases Although the method seemed to be successful, no further developments have been reported. Only one similar approach has been reported more recently, in which the frequency component produced by the separation of the chromatids was specifically analysed (Hutzler, 1981). The approach appears useful only in situations where very large numbers of metaphases must be analysed.
IMAGE FRAME ANALYSIS METHODS
The most common approach to metaphase finding is based on scanning the normal microscopic image using a television camera as a light sensor. After scanning process, each image frame is analysed by more or less conventional image processing techniques such as contour analysis (Castleman and Melnyk, 1976) or particle count in the whole image (Ledley et al., 1972) or in subdivisions of it (Green and Cameron, 1972; Van Daele et al., 1979). The method generally considered the most successful so far in this context is by comparing the area of a cluster of particles of a predefined size to the sum of their individual areas utilizing specialized hardware (Vrolijk et al., 1980). However, each of these methods requires the microscope stage to move and come to a complete standstill again before the next image can be acquired and analysed. For mechanical reasons, the settling of the stage and the automatic focus control take a relatively large amount of time, often longer than required to process the previously acquired image in parallel.
Besides, the distinct image frames must have an overlap of a size comparable with that of the individual metaphases. In practice, this requirement involves scanning the image approximately twice as in manual metaphase finding. For these reasons, the overall scanning speed is in the order of 0.1 mm2 sec-1 which is equivalent with a scanning time in the order of one hour per slide.
CONTINUOUSLY MOVING IMAGE ANALYSIS METHODS
If the television camera is replaced by a linear array of Charge-coupled Devices (CCD), the stage is allowed to move in a continuous fashion perpendicular to the CCD array. These systems have mostly been developed as stand-alone devices in the context of detection of mutations (Green et al., 1977; Le Go, 1982). Their scanning speed is higher than that of television based systems by more than one order of magnitude, i.e., in the order of 3 mm2 sce-1.
PERFORMANCE ASPECTS
Nowadays, automated metaphase finding is employed in a number of institutions on a day-to-day basis. A problem with the systems actually employed remains that their false-positive and false-negative rates apparently depend strongly on the details of the slide preparation process and the diagnostic purpose (Bresser, 1984). In most cases, adjustment of algorithm parameters is sufficient to obtain the original performance again. Essentially, a Receiver Operator Characteristic (ROC) analysis is required to optimize the metaphase selection criteria (Swets and Pickett, 1982).
In pre-and post-natal diagnosis, where only a limited number of metaphases are required, the suitability for high-resolution analysis of a limited number of found metaphases is most important. However, in the diagnosis of malignancies it is essential to miss as few metaphases as possible, involving a shift of the work point on the ROC-curve from strict to lax. A severe limitation of the present systems is that they only perform well on one single type of slides (mostly from blood lymphocyte cultures), in which metaphases are relatively abundant. Adaptation of the systems to another type of slides (e.g., from bone-marrow) presents serious problems because it apparently requires more than only adjusting the algorithm parameters.
AUTOMATED KARYOTYPING
In the next paragraphs, the various steps involved in the automation of the karyotyping process are discussed. It appears that none of these steps has led as yet to total automation, because errors requiring operator intervention are likely to occur. But even to enhance operator efficiency, one has to pay special attention to the actual implementation of the interactions.
METAPHASE RELOCATION
In karyotyping, the metaphases selected (manually or automatically) must be examined at a magnification sufficient to view all details. In practice, this simply is the highest possible magnification for a light microscope, generally attained by utilizing an x100 oil-immersion objective. The automatic relocation requires a microscope scanning stage under computer control such as in metaphase finding. But if the re-examination at higher magnification itself is also to be performed automatically, the positioning requirements are much stricter. Only if the accuracy of the repositioning is matched with that of the size determination, no part of the metaphase will disappear from the field of view.
RESOLUTION ASPECTS
In a visual system slight adjustments in focus may render some additional information but in an automated system (as in photography) focusing is limited to a fixed optimum and in this case it is determined by an auto-focus algorithm. The digitization of the microscope image does not affect the contrast range, provided the illumination is controlled such that it matches the sensitivity range of the photo-sensor used. But the computer image is degraded with respect to the original for several reasons (Oosterlinck, 1977):
| • | Sensor itself produces noise, mainly of electronic origin; |
| • | Digitization into distinct picture elements involves convolution of a small image area with the point spread function of the optical and sensor systems; |
| • | Digitization into distinct grey-values produces noise. |
The number of grey-values used has increased from 8 in the earliest systems (Ledley, 1964; Butler et al., 1964) to 64 a few years later (Neurath et al., 1970). The latter number was definitely sufficient for the unbanded preparations analysed at the time. In banded chromosome analysis, 64 gray-levels are generally considered just sufficient and in accordance with the signal-to-noise ratio of the widely used vidicon television cameras, which is about 30:1. On the one hand, higher gray-value resolution does not seem necessary in view of the ability of a human observer to discriminate between adjacent gray-values (adjacent also in the spatial sense). But on the other hand, higher gray-value resolution used by various researchers, or its inverse, the size of the discrete picture elements has shown relatively little variation. In most cases, a spatial frequency in the order of 5 to 10 pixels/μm was used, approximating the one required by the sampling theorem applied to the microscope resolution (Shannon and Weaver, 1949; Harms and Aus, 1984).
In the earliest systems developed for chromosome analysis, the problems of relocation, changing magnification and focus control were eliminated from the karyotyping process by introducing a photomicrographic step (Ledley, 1964; Butler et al., 1964). On the photographic film, the metaphases could be rendered at predefined positions and in focus. Next the film could be scanned using a flying-spont scanner.
Also in later systems, either film based or employing a television camera for direct scanning of the metaphases, the caesura (division) between metaphase finding and chromosome analysis remained (Neurath et al., 1966; Mendelsohn, 1966; Wald et al., 1970). Only recently, the development of microscope systems utilizing a single high-magnification objective with wide field of view has been reported (Young et al., 1982; Shoemaker et al., 1982). However, the resolution of these systems is as yet limited to about 0.5 μm, precluding their use in karyotyping.
OBJECT ORDERING
In an automated system, the manual ordering process cannot simply be mimicked. The most important reason appears to be that, at least at this moment, a human observer is far more able than an automated classifier to see through all kinds of distracting factors accumulated in previous stages. These factors among others are:
| • | The biological variability; |
| • | Variations in culturing and staining, resulting in variable contraction, spreading and contrast; |
| • | Sensor and digitization noise; |
| • | Variations in repositioning, magnification, illumination and focusing resulting in different representations of the same original image in the computer. |
Even if the last category of variations could be completely eliminated, the preceding ones are sufficient to preclude complete identification with the present level of automation. Especially the biological variability poses serious problems when analyzing chromosomes for aberrations, the nature of which generally is not known beforehand. Essentially, the analysis then requires pattern recognition algorithms classifying the chromosomes with such a high level of confidence that the aberrations are immediately recognized as such. Classification of, or-more modestly-differentiation between distinct aberrations is a still more complicated problem. Only if the aberrations are restricted beforehand to a limited number of well-distinguishable ones, their automated recognition seems feasible (Bille et al., 1980). Therefore, automated systems intended for clinical analysis of aberrations should always be open-ended, i.e., permit interactive amendments in the produced karyogram.
A basic problem in the automated analysis of metaphase images is in the difficulty to isolate the chromosomes as separate entities. Unlike the human observer who immediately sees distinct objects in an image, an automated system appears severely handicapped because it never processes the image as a whole simultaneously. It has to overcome this handicap by applying combinations of elementary so-called image segmentation techniques with great perseverance. Some of the techniques developed for image segmentation in general (or chromosome isolation in particular) are skeletonisation (Hilditch and Rutovitz, 1972), boundary analysis (Gallus and Regliosi, 1974; Groen, 1977), convex hull analysis (Rutovitz et al., 1978) and syntax-directed or parsing methods (Ledley et al., 1965).
These techniques were mainly developed to be used on well-spread metaphases in order to delineate the chromosomes accurately from the image background especially at their end-points and centromeres. In spite of the rich collection of techniques presently available for automated object isolation, persistent problems remained; for instance, with fuzzy morphology and with touching and overlapping chromosomes. In an interactive system, these situations often demand operator actions that require a high skill and consume a lot of time. Now that increasing numbers of metaphases of decreasing quality are involved in the clinical analysis of bone-marrow preparations, the automation of these actions becomes increasingly important.
CLASSIFICATION
The aim of automatic classification is to place the individual chromosomes at their proper positions in the karyotype. Before the banding techniques were introduced, the classification was mainly based on length and centromeric index. This led to error rates between 10% and 35% when human intervention in the computation of these features was allowed (Neurath et al., 1975; Ing et al., 1975). But classification without any interaction led to much poorer results with an error rate in the order of 50% (Groen, 1976). It was only after the introduction of the banding techniques that the error rates of human and automated classification have become comparable, i.e., in the order of 3% (Granlund et al., 1976). This percentage only relates to the classification of isolated chromosomes, not to simultaneous classification of complete metaphases. The latter, which is the normal procedure during manual karyotyping shows an error rate of only 0.1% for lymphocyte preparations (Lundsteen et al., 1975; Lundsteen and Granum, 1979; Lundsteen et al., 1980). But this procedure has so far resisted automation. At present, the automated classifiers of isolated chromosomes are incorporated into commercially available systems, in which they provide a good first guess for a karyogram (Joyce-Loebl, 1985).
However, the purpose of karyotyping is nearly always to analyze aberrations rather than normal chromosomes. It would be ideal if the aberrations would also be classified automatically, but in view of the enormous number of possible aberrations, realization of this ideal does not seem likely. It would mean a substantial progress already if any deviation from the normal karyotype were indicated automatically. In many cases, the actual process of karyotyping would become no longer necessary. But if the automatic indications then are used properly, little attention will be paid any more to the remaining part of a metaphase. This implies that such automatic indications would require a very low (if not zero) false negative rate.
In another approach to karyotyping, the problems associated with chromosomes that are missing or that cannot be identified because of bad metaphase quality are avoided. It has been suggested to perform a composite karyotyping in these cases on multiple metaphases simultaneously (Castleman et al., 1973; Granlund et al., 1976). Computer assistance is almost indispensable in editing such composite karyograms. Because of the limited display capacities of standard television-based systems, it has been suggested to implement the editing like a spreadsheet program, i.e., with horizontal and vertical scroll functions (Lundsteen, 1986). If a display size of 512x512 pixels is considered sufficient for the display of a single karyogram, doubling the screen’s resolution and physical size would allow at least four cells to be viewed simultaneously. If multiple cell lines are present in a preparation, an extra complication arises but the potentialities of comparing the homologous chromosomes among cells increases.
THE ROLE OF IMAGE PROCESSING IN AUTOMATED CYTOGENETICS
Image segmentation: In the past decades, the analysis of visible mutations in chromosomes has become increasingly important for medical applications such as the diagnosis of some heritable genetic disorders (both post- and prenatally) and the study and diagnosis of mutagenesis and carcinogenesis. One of the most exciting and rapidly progressing areas of research at present is the application of cytogenetics to the diagnosis and study or malignant neoplasias. For the other application areas of chromosome analysis, systems have been developed with varying degrees of automation and cost-effectiveness. Some systems only provide assistance for the manual procedures, others hardly require any interaction. In the development of these systems, a trend is visible towards utilizing general-purpose components (both hardware and software) wherever possible. With the advent of advanced personal computers, automated systems have come within the reach of nearly every cytogenetic centre. Especially in the area of cancer cytogenetics, it appears necessary to develop new programs or adapt existing ones devised for the other areas of cytogenetics.
Image enhancement: Although a number of computer assisted systems have been developed to automatically detect and classify metaphase chromosomes (spreads), their performance (i.e., the specificity) is still relatively low. For example, an early system developed at the Medical Research Council (Scotland) and Lawrence Berkeley Laboratory (California, USA) could achieve 0.98 detection sensitivity at the cost of a high false-positive rate of 5.5 (Mascio et al., 1998). To improve the performance of automated detection and classification of chromosomes in noisy and low light level images, researchers (since the early 1990s) have been working to improve the quality of the images hoping that high-resolution display and visualization of chromosome band patterns with improved signal-to-noise ratio could make image processing (segmentation) and pattern recognition (classification) methods more effective (Wu and Castleman, 1996).
Owing to cell culture, staining and imaging (lighting) conditions, image enhancement becomes a desirable preprocessing step before performing chromosome segmentation and classification. The aim of image enhancement is to improve visibility of low-contrast chromosomes (or related features) while suppressing noise. For this purpose, after using traditional smoothing filters (i.e., Gaussian low pass and median filters) to reduce random noise (Weeks et al., 1993); differential operators (Jain, 1989); Laplacian pyramid (Anderson et al., 2000) are typically applied because they facilitate the extraction of important geometric features like chromosome edges and bands.
In addition, differential operators also sharpen the image by extrapolating its high-frequency information. Recently, a wavelet-based algorithm (multi scale differential operators) has been applied to enhance chromosome images (Wang et al., 2003). Using multi-scale differential operators (suited for the structural description of chromosome geometry) high-frequency features such as edges are well characterized. This algorithm improves the salient features of chromosome images (including the band patterns of chromosomes), facilitates the measurement of correlation of image features in the transform domain and provides high-frequency edge information along horizontal, vertical and diagonal directions. The disadvantage of the method is the increased memory requirement due to the over-complete representation (Wang et al., 2003). Based on a testing data set of G-banded cells, the classification error was reduced from 15.6% (using un-enhanced images) to 8.5% (using wavelet-based enhanced images), pointed out by Wu et al. (2002). Hence, image enhancement improves not only the display and visualization of chromosome images but also the recognition rate and accuracy of chromosome classification.
SEPARATION OF PARTIALLY OVERLAPPING CHROMOSOMES
Current computer-assisted systems (including commercial products) for automated chromosome classification are mostly interactive and require human intervention for correcting separation between touching and overlapping chromosomes (Carothers and Piper, 1994). Since in almost every metaphase image, partial touching and overlapping of chromosomes are a common phenomenon, finding solutions for automated separation of chromosomes is difficult yet vital. Early work in this area included applying a variety of segmentation methods, such as thresholding (Piper et al., 1980); region-growing (Gaybay, 1986); heuristic edge-linking (Liang, 1989) and fuzzy-logic based shape decomposition (Vanderheydt et al., 1981). Thresholding and region-growing methods adaptively use the local neighborhood of each pixel correlated to the linked chromosome for the separation. These methods generally do not depend on the shape of the chromosomes. As a result, they have often failed either in the cases where no separating path exists between chromosomes or in those cases where the separation path is ambiguous (Gaybay, 1986). Heuristic searching method tries to separate touching chromosomes by searching for a minima cost function determined by path characteristics of chromosomes. Experimental results have demonstrated that this method led to inferior results in cases of incomplete information (e.g., no clear separating path), as pointed out by Liang (1989). The fuzzy-logic based searching method works well in simple cases but fails in more complicated situations. In particular, it yields erroneous decompositions of single bended chromosomes and others where the contraction near the centromere is too sharp (Vanderheydt et al. (1981).
Owing of the limitation of the earlier work, several new techniques have been investigated and developed. One example is a knowledge-based chromosome contour searching method (Agam and Dinstein, 1997). In this method, an edge-preserving smoothing nonlinear filter is applied to remove random noise while preserving the edges of chromosomes. The contour tracking method based on a discrete curvature function is then applied to define the contours of the connected segments. In order to obtain smooth contours, a four-connected to eight-connected chain-code conversion is applied. After obtaining the tracked chromosome contours, a high-level noise removal is performed using prior knowledge about expected shapes. For example, assuming that individual chromosomes and clusters of chromosomes form shapes with long contours, high-level noise removal is achieved by deleting objects having relatively short contours. After all contour points are detected in one metaphase image each chromosome contour is scanned and checked using a series of knowledge-based hypotheses. In order to get satisfactory results, these hypotheses need to be sufficiently complex (which is a difficult part of the method). This method correctly separated 82% of the touching clusters of chromosomes in the data set used and among others, 11% were not separated and 7% were separated wrongly (Agam and Dinstein, 1997).
A novel recursive searching algorithm was developed and implemented in an automated karyotyping system (Popescu et al., 1999). The algorithm was designed using the concept of pale path and cross-section sequence graph (CSSG) to split touching chromosomes. The output of the process is a relabeled image depicting split chromosomes together with a collection of skeletal segments for each labeled region. The algorithm achieved 82% accuracy on the data set used and the three types of skeleton errors found were, missing fragments in the skeleton, extra-fragments in the skeleton and hole formation (Popescu et al., 1999).
Minimum entropy segmentation algorithm was also investigated to decompose (separate) groups of chromosomes that touch and overlap each other (Schwartzkopf et al., 2001). This algorithm uses nearest neighbor distances to estimate entropy from raw image data to accomplish minimum entropy segmentation by selecting cut lines between touched chromosomes without requiring pixel classification. Applying to a data set of chromosomes, the estimated accuracy of the algorithm was expected in the range of 70-80%. However, the biggest obstacle of using this algorithm in real automated system is its computation complexity and low efficiency, as the algorithm often takes several hours to segment one image (Schwartzkopf et al., 2002).
FEATURE SELECTION
Feature selection in developing a computer-assisted classification system can be regarded as a search, among all possible transformations (or extracted features), for the best sub-space that preserves class separability as much as possible in the lowest possible dimensional space. An optimal and small feature set is one of the important factors determining the performance and robustness of an automated classification system. Hence, a major research effort has gone into defining and searching for optimal features extracted from chromosome images. Owing to the small size and limited resolution of banded chromosomes, finding effective features from original images is quite difficult. As a result, certain kinds of pre-processing procedures (including image processing and transformation) are often used to enhance chromosome image features or generate new types of transformed image features.
Length of a single chromosome or a set of chromosomes in one cell is considered one of the most important features to classify chromosomes. Chromosome length gradually declines from class 1 to 22. Subtle variations among cells (such as preparation technique and image quality) affected the computational accuracy of chromosome length (Errington and Graham, 1993). To accurately detect the length of a chromosome, one research group applied Medial Axis Transformation (MAT) to extract and protect the skeleton of a chromosome. Using this transformation and the thinning algorithm, computer-assisted scheme can iteratively delete edge points of a region subject to constraints. This process does not remove end points, does not break connectedness or cause excessive erosion of that region. Then, two length related morphological features, relative length (the ratio of the length of the I-th chromosome to the total length of all 46 chromosomes in one cell) and centromeric index (the ratio of the length of the short arm to the whole length of a chromosome) are computed (Ryu et al., 2001). These two features provide a significant amount of chromosome delimiting capability (Stanley et al., 1998).
Since each of the chromosome classes possesses unique banding patterns, computing these banding patterns (or corresponding features) attracted extensive research interest. One of the simplest approaches to representing the banding pattern is using a density profile that computes the mean gray levels (pixel value) along perpendicular lines to the medial axis of a chromosome (Piper and Granum, 1989). Zimmerman et al. (1986) have demonstrated that an automated system relying primarily on the number of bands and their features could be useful tools in classification of chromosomes. Currently, from the density profile as many as 100 feature data can be sampled and extracted (Ryu et al., 2001). Because many of these features are redundant, it is required to compress the feature data with certain feature selection techniques (viz., knock out algorithm, outlined by Lerner et al., 1994). Ruan (2000) demonstrated that the optimal performance could be achieved using a vector with only 10 features computed from the density profile.
Surface features refer to the vector representation of a group of pixel value (intensity) based image statistics, such as intensity, localized mean and variance of a particular pixel location in the image, that have been tested in the classification of chromosomes. These features mildly resolve surface detail of chromosome bodies. In an attempt to further improve classification performance, local energy features were explored by researchers. The concept of local energy is based on physiological evidence suggesting that human visual system responds strongly to points in an image where phase information is highly ordered (Morrone and Burr, 1988). The local energy can be computed via a set of wavelet transform (Pudney et al., 1996). Kyan et al. (1999) demonstrated that combining intensity and local energy based surface features improved the performance of a Kohonen’s self-organizing feature map (SOFM) in classification of chromosomes. Corkidi et al. (1998) concluded that using similar roughness feature of surface-intensity achieved better performance than using classical texture features derived from co-occurrence matrices in chromosome classification.
Besides the features computed in the space domain, features in the frequency domain have also been explored to classify banded chromosomes. Sweeney et al. (1997) investigated and compared features extracted from wavelet and Fourier descriptors in chromosome classification. After computing density profile of each chromosome, the discrete wavelet transform (4-coefficient Daubechies wavelet basis) and discrete Fourier transform were applied to the density profile. Then, the transformed densitometric signals were equally sampled and used as analytic features. Testing results demonstrated that using Fourier transform based features could achieve 2.8% higher accuracy compared to using wavelet transform based features (Sweeney et al., 1997).
CLASSIFICATION OF CHROMOSOMES
In order to improve the performance of automated chromosome classification (including recognition of disordered chromosomes), artificial intelligence and machine learning methods have been widely used in the computer-assisted chromosome detection and classification systems. Among them, Artificial Neural Network (ANN) is the most popular tool owing to its capability of modeling the human brain decision making process to recognize objects based on incomplete or partial information, as well as its simple topographic structure and easier training process (Mitchell, 1997). A large number of different feature based and pixel value distribution based ANNs have been tested and evaluated in classification of banded chromosomes, which include supervised neural network architecture; viz., multi-layer neural networks (Wu et al., 1990; Delshadpour, 2003) and Hopfield network (Ruan, 2000); and unsupervised architecture; viz., nonlinear maps (Lerner et al., 1996), SOFM (Kyan et al., 1999) and mutual information maximization based training method (Mousavi et al., 1999).
Backpropagation training method is commonly used to train ANNs. In multi-layer feed-forward ANNs, the number of output neurons is often fixed (from 1 to 24), but the number of input neurons, hidden neurons, steepness of the activation function, learning rate, momentum term, number of learning iterations and upper bound of training error are programmable. Determining these training or optimization parameters is important for the performance and robustness of an ANN used in chromosome classification (Cho, 2000). However, studies indicated that ANN performance was slightly lower than that obtained using a simpler statistical method (viz., maximum likelihood Sweeney et al., 1993). In addition, training overfitting (including using an excessive number of input features, network neurons and training iterations) during ANN optimization substantially reduces the robustness of the ANN in chromosome classification. One study (Mitchell, 1997) using multi layer perception based ANN obtained 0% error rate in the training data set and 24.2% error rate in the testing data set. To increase ANN performance, another study demonstrated that by reducing the size (the number of neurons) of an ANN, its testing accuracy would increase from 75.8% to 88.3% (Delshadpour, 2003).
In order to improve the performance of traditional multi layer ANNs, a number of other more sophisticated neural networks have been proposed and tested in this area. A fuzzy Hopfield neural network is a combination model of neuro and fuzzy computing. Its main difference from the traditional ANN is that it holds fuzzy clustering capability and learning mechanism of acquiring knowledge about the targets (human chromosomes) from the noisy training samples. The network was designed to identify human chromosomes and assign each of them to one of the 24 human chromosome classes. In a test involving 100 human chromosomes, the fuzzy Hopfield neural network produces a very low unidentification rate of 3.33% (Ruan, 2000). In addition, some unsupervised nonlinear methods were tested and evaluated for the optimization of ANNs (Kyan et al., 1999; Lerner et al., 1996). However, Lerner et al. (1996) found that performance of unsupervised nonlinear learning methods was lower than a supervised nonlinear paradigm.
Besides classification tasks, ANN has been developed and tested to detect or recognize metaphase (chromosome) spreads from nuclei and artifacts in microscopic digital images acquired at 10 magnification power. An ANN involving 10 input neurons (representing 10 morphological, photometrical and textural features) was trained and optimized. Applying to a test data set, the ANN correctly classified 91% of the objects in each class (Cosio et al., 2001).
Although ANN is a powerful machine learning tool in pattern recognition and classification, its relatively poor robustness in detection and classification of abnormalities depicted on the complicated medical images (including chromosome images) and its black box type of optimization approach are the major disadvantages. To provide researchers and clinicians with a better understanding of the logic (or reasoning) in automated classification of chromosomes, a variety of knowledge-based ‘expert’ systems were developed and evaluated. Since clinical technicians are trained to recognize the chromosomes under non-ideal conditions, many researchers tried to record and apply or mimic the rules of manual karyotyping and diagnosis of chromosome irregularity into a knowledge-based automated classification system in an attempt to minimize the classification errors. Hence, researchers who worked with clinicians observed their diagnostic process, summarized and quantified the diagnostic rules and then converted these rules into the computer classification system (Wu et al., 1989; Lu and Yan, 1989; Ramstein et al., 1992). The system would then be trained on a bank of chromosome images, refining the rules as needed until the recognition rate was maximized. A major problem with such knowledge-based approach is the difficulty of converting karyotyping guidelines and intuitive notions (empirically diagnostic rules) into concrete rules that can be effectively programmed and applied in a computer-assisted scheme. Owing to this difficulty, the most popular knowledge-based classification system is a fuzzy logic rule-based system, which offers great promise for improving the recognition rate (Keller et al., 1995). One blind test on a data set distributed in three classes demonstrated 88% classification accuracy using an automated system involving six phases of fuzzy logic rules as observed by Sjahputera and Keller (1999).
Recent studies by Hoffbrand and Petlit (2000) have found that consistent chromosomal changes led to isolation of the genes involved in the pathogenesis of leukemia and other cancers. Detection of these consistent, recurrent chromosomal changes has allowed the division of patients into clinical groups which define their duration of remission and mean survival time (LeBeau and wley, 1984). Hence, using the chromosome imaging technique to detect chromosomal disorder provides a much more sensitive approach than other medical imaging techniques (i.e., x-ray radiographs and computer tomography) not only in detecting cancers or other genetic disorders at an early stage but also in monitoring the efficacy of patient treatment. Without a computer-assisted and reliable semi- or fully-automated detection and classification system, visually searching for and detecting these subtle chromosomal changes (disorders) is a labor-intensive and time-consuming process because of difficulties involved in the culture of primary tumor cells, low mitotic indices and poor chromosomal morphology. Moreover, only a small proportion of total acquired testing cells (metaphase spreads) are associated with cancers or tumors in each patient. The subjective evaluation of subtle chromosomal changes can also lead to errors and substantial inter or intra-reader variations.
Wang et al. (2005) point out that since the 1980s, a large number of research groups around the world have been working on developing computer-assisted chromosome detection and classification systems based on digitally acquired microscopic images. Initial tests based on the limited data sets demonstrated promising results in algorithm and system development. Despite the progress made over the last two decades, there are several limitations of the current computer-assisted chromosome classification systems.
First, these systems depend heavily on slide preparation, image enhancement process and the optical system that captures the images. The performance of the systems can be improved when the slides are well-prepared, the microscope has good optical quality and the camera can digitize the image with sufficient clarity and resolution.
Second, the performance of these systems is affected by the results of chromosome segmentation. Early studies found that a number of automated classification systems were somewhat successful in karyotyping the chromosomes under favorable imaging conditions. The typical case error rate was approximately 20% (Wu et al., 1989). If the chromosomes were touching, overlapping or deformed as shown in the majority of images acquired in the clinical laboratories, the classification error rate was substantially increased (Pantaleao et al., 2002).
Third, although there are several publicly available databases of chromosome images (i.e., Copenhagen data set, discussed in Delshadpour, 2003 and Sweeney and Musavi, 1993), current systems have not been tested and evaluated using a large and diverse independent data set. Many of the tests were performed using simulated data (Delshadpour, 2003) or a round-robin (leave-one-out) validation method (Sweeney and Musavi, 1993). Hence the robustness of these systems is largely unknown.
Fourth, although several commercialized software and systems have been developed, they are mostly semi-automatic products. To identify metaphase spreads, the scanning speed and accuracy of current commercial systems do not match the clinical service demand. Once metaphase spreads are visually identified, current computerized systems can help to partially pair the untouched chromosomes. The interaction of a skilled laboratory technician is required to check the results and manually complete the karyotyping (including correcting the mismatch of chromosome pairs).
DISCUSSION
Automated detection and classification of banded chromosomes may help clinicians diagnose cancers and other genetic disorders at an early stage more efficiently and accurately. However, developing such an automated system (including both a high-speed microscopic image scanning device and related computer-assisted schemes) was quite a challenging and difficult task. Since 1980s, efforts have been made to develop fast and more reliable methods to assist clinical technicians in performing this important and time-consuming task. A number of computer-assisted methods including classical statistical methods, artificial neural networks and knowledge-based fuzzy logic systems have been applied and tested. Based on the initial test using limited data sets encouraging results in algorithm and system development have been demonstrated. Despite all these significant initiatives and progress made over the last two decades, computer-assisted chromosome detection and classification systems have not been routinely accepted and used in clinical laboratories. Further research and development is needed, as pointed out by Wang et al. (2005) and they emphasize that further research is needed to develop and evaluate computer assisted systems for detection and classification of banded chromosomes in order to facilitate diagnosis of cancers (or other genetic diseases) and reduce diagnostic errors.
REFERENCES
- Agam, G. and I. Dinstein, 1997. Geometric separation of partially overlapping nonrigid objects applied to automatic chromosome classification. IEEE Trans. Pattern Anal. Mach. Intell., 19: 1212-1222.
Direct Link - Anderson, C.H., H. Greenspan and S. Akber, 2000. Image enhancement by nonlinear extrapolation in frequency space. IEEE Trans. Image Process., 9: 1035-1048.
Direct Link - Carothers, A. and J. Piper, 1994. Computer-aided classification of human chromosomes: A review. Stat. Comput., 4: 161-171.
Direct Link - Cho, J., 2000. Chromosome classification using backpropagation neural networks. IEEE Eng. Med. Biol. Maga., 19: 28-33.
Direct Link - Corkidi, G., L. Vega, J. Marquez, E. Rojas and Ostrosky-Wegman, 1998. Roughness feature of metaphase chromosome spreads and nuclei for automated cell proliferation analysis. Med. Biol. Eng. Comput., 36: 679-685.
Direct Link - Cosio, F.A., L. Vega, A.H. Becerra, C.P. Melendez, G. Corkidi, 2001. Automatic identification of metaphase spreads and nuclei using neural networks. Med. Biol. Eng. Comput., 39: 391-396.
Direct Link - Dudkin, A.K and D.A. Denissov, 1993. Visual object recognition via hypothesis construction/ verification in chromosome analysis. Can. Conf. Elect. Comput. Eng., 2: 1200-1203.
Direct Link - Delshadpour, S., 2003. Reduced size multi-layer perception neural network for human chromosome classification. Proceedings of the 25th Annual International Conference on Engineering in Medicine and Biology Society, September 7-21, 2003, IEEE Xplore, pp: 2249-2252.
CrossRef - Errington, P. and J. Graham, 1993. Application of artificial neural networks to chromosome classification. Cytometry, 14: 627-639.
Direct Link - Guimaraes, L.V., A. Schuck and A. Elbern, 2003. Chromosome classification for karyotype composing applying shape representation on wavelet packet transform. Proceedings of the 25th Annual International Conference on Engineering in Medicine and Biology Society, September 17-21, 2003, IEEE Xplore, pp: 941-943.
CrossRef - Keller, J.M., P. Gader, O. Sjahputera, C.W. Caldwell and H-M.T. Huang, 1995. A fuzzy logic rule-based system for chromosome recognition. Proceedings of the 8th Annual IEEE Symposium on Computer-Based Medical Systems, June 9-10, 1995, IEEE Xplore, pp: 125-132.
Direct Link - Korthof, G. and A.D. Carothers, 1991. Tests of performance of four semi-automatic metaphase-finding and karyotyping systems. Clin. Genet., 40: 441-451.
Direct Link - Kyan, M.J., L. Guan, M.R. Amison and C.J. Cogswell, 1999. Feature extraction of chromosomes from 3D confocal microscope images. Int. Conf. Image Process., 2: 843-847.
Direct Link - Ledley, R.S., L.S. Rotolo, T.J. Golab, J.D. Jacobsen, M.D. Ginsberg and J.B. Wilson, 1965. FIDAC-Film Input to Digital Automatic Computer and Associated Syntax Directed Pattern Recognition System. In: Optical and Electro-optical Information Processing, Tippett, J.I. (Eds.). MIT Press, Cambridge MA., pp: 591-631.
- Lerner, B., H. Guterman, M. Aladjem, I. Dinstein and Y. Romem, 1996. Feature extraction by neural network nonlinear mapping for pattern classification. Proceedings of the 13th International Conference on Pattern Recognition, August 25-29, 1996, IEEE Xplore, pp: 320-324.
Direct Link - Lerner, B., M. Levinstein, B. Rosenberg, H. Guterman, L. Dinstein and Y. Romem, 1994. Feature selection and chromosome classification using a multi layer perception neural network. Proceedings of the World Congress on Computational Intelligence, June 27-July 2, 1994, Orlando, FL., USA., pp: 3540-3545.
CrossRef - Lundsteen, C., A.M. Lin and E. Granum, 1975. Visual classification of banded human chromosomes: Karyotyping compared with classification of isolated chromosomes. Proceedings of the Asilomar Workshop on Automation of Cytogenetics, November 30-December 2, 1975, Engineering Foundation, Pacific Grove, pp: 110-116.
- Lundsteen, C., T. Gerdes, J. Maahr, 1991. Automated multiple-cell karyotyping: A clinical feasibility study. Clin. Genet., 39: 338-346.
Direct Link - Lundsteen, C., J. Maahr and T. Gerdes, 1992. Automatic Assessment of the quality of G-banded metaphases. A preliminary study. J. Radiat. Res., 33: 152-158.
Direct Link - Mascio, L.N., B.K. Yuen, W.P. Kegelmeyer, K. Matsumoto, J. Briner and A.J. Wyrobek, 1998. Advances in the automated detection of metaphase chromosomes labeled with fluorescence dyes. Cytometry, 33: 10-18.
Direct Link - Morrone, M.C. and D.C. Burr, 1988. Feature detection in human vision: A phase-dependent energy model. Proc. R. Soc. Lond. B, 235: 221-245.
Direct Link - Mousavi, P., R.K. Ward and P.M. Lansdorp, 1999. Feature analysis and classification of chromosome 16 homologs using fluorescence microscopy image. IEEE Can. Conf. Electr. Comput. Eng., 2: 841-846.
Direct Link - Pantaleao, C.H.Z., F.M. Azevedo, E.T. Pereira, M.C.M. Ribeiro and J.L.B. Marques, 2002. Development of a computerized system for cytogenetic analysis and classification. Proceedings of the 2nd Joint 24th Annual Conference and the Annual Fall Meeting of the Biomedical Engineering Society, October 23-26, 2002, IEEE Xplore, pp: 2211-2212.
CrossRef - International Congress of Human Genetics, 1971. Paris Conference (1971): Standardization in Human Cytogenetics. Birth Defects Original Article Series Vol. 8, The National Foundation, New York.
Direct Link - Pudney, C.J., M.J. Robins, B.J. Robins and P.D. Kovesi, 1996. Surface detection in 3D confocal microscope images via local energy and ridge tracing. J. Comput. Assist. Microsc., 8: 5-20.
Direct Link - Popescu, M., P. Gader, J. Keller, C. Klein, J. Stanley and C. Caldwell, 1999. Automatic karyotyping of metaphase cells with overlapping chromosomes. Comput. Biol. Med., 2: 61-82.
Direct Link - Ramstein, G., M. Bernadet, A. Kangoud and D. Barba, 1992. Chromosome: A rule-based image analysis system for chromosome classification. Proceedings of the Annual International Conference on Engineering in Medicine and Biology Society, October 29-November 1, 1992, IEEE Xplore, pp: 926-927.
Direct Link - Ruan, X., 2000. A classifier with the fuzzy Hopfield Network for human chromosomes, intelligent control and automation. Proceedings of the 3rd World Congress on Intelligent Control and Automation, June 28-July 2, 2000, IEEE Xplore, pp: 1159-1164.
CrossRef - Ryu, S.Y., J.M. Cho and S.H. Woo, 2001. A study for the feature selection to identify giemsa-stained human chromosomes based on artificial neural network. Proceedings of the 23rd Annual International Conference on Engineering in Medicine and Biology Society, October 25-28, 2001, Istanbul, Turkey, pp: 691-692.
Direct Link - Schwartzkopf, W., B.L. Evans and A.C. Bovik, 2001. Minimum Entropy segmentation applied to multi-spectral chromosome images. Int. Conf. Image Process., 2: 865-868.
Direct Link - Schwartzkopf, W., B.L. Evans and A.C. Bovik, 2002. Entropy estimation for segmentation of multi-spectral chromosome images. Proceedings of the 5th Southwest Symposium on Image Analysis and Interpretation, April 7-9, 2002, Sante Fe, NM., USA., pp: 234-237.
CrossRef - Sjahputera, O. and J.M. Keller, 1999. Evolution of a fuzzy rule-based system for automatic chromosome recognition. Proc. IEEE Int. Conf. Fuzzy Syst., 1: 129-134.
Direct Link - Stanley, R.J., J.M. Keller, P. Gader, C.W. Caldwell, 1998. Data-driven homologue matching for chromosome identification. IEEE Trans. Med. Image., 17: 451-462.
Direct Link - Sweeney, N., R.L. Becker and B. Sweeney, 1997. A comparison of wavelet and Fourier descriptors for a neural network chromosome classifier. Proceedings of the 19th Annual International Conference on Engineering in Medicine and Biology Society, October 30-November 2, 1997, Chicago, IL., USA., pp: 1359-1362.
CrossRef - Trask, B.J., 2002. Human cytogenetics: 46 chromosomes, 46 years and counting. Nat. Rev. Genet., 3: 769-778.
Direct Link - Wang, Y.P., Q. Wu, K.R. Castleman and Z. Xiong, 2001. Image enhancement using multi scale differential operators. Proceedings of the International Conference on Acoustics, Speech and Signal Processing, May 7-11, 2001, IEEE Xplore, pp: 1853-1856.
CrossRef - Wang, Y.P., Q. Wu, K.R. Castleman and Z. Xiong, 2003. Chromosome image enhancement using multi scale differential operators. IEEE Trans. Med. Imag., 22: 685-693.
Direct Link - Wang, X., B. Zheng, M. Wood, S. Li, W. Chen and H. Liu, 2005. Development and evaluation of automated systems for detection and classification of banded chromosomes: Current status and future perspectives. J. Phys. D: Applied. Phys., 38: 2536-2542.
Direct Link - Weeks, A.R., H.R. Myler and H.G. Wenaas, 1993. Computer-generated noise images for the evaluation of image processing algorithms. Opt. Eng., 32: 982-992.
Direct Link - Wu, Q., P. Suetens and A. Oosterlinck, 1990. Chromosome classification using a multi-layer perception neural net. Proceedings of the 12th Annual International Conference on Engineering in Medicine and Biology Society, November 1-4, 1990, IEEE Xplore, pp: 1453-1454.
Direct Link - Wu, Q. and K.R. Castleman, 1996. Multi scale image enhancement of chromosome banding patterns. Proc. SPIE, 2825: 796-804.
Direct Link - Wu, Q., Y.P. Wang, Z. Liu, T. Chen, K.R. Castleman, 2002. The effect of image enhancement on biomedical pattern recognition. Proceedings of the 2nd Joint 24th Annual Conference and the Annual Fall Meeting of the Biomedical Engineering Society, October 23-26, 2002, IEEE Xplore, pp: 1067-1069.
CrossRef