
Arunrat Chaveerach
Department of Biology, ,Khon Kaen University, Khon Kaen, 40002 Thailand
Nattapong Srisamoot
Department of Biochemistry, Faculty of Science, ,Khon Kaen University, Khon Kaen, 40002 Thailand
Suporn Nuchadomrong
Department of Biochemistry, Faculty of Science, ,Khon Kaen University, Khon Kaen, 40002 Thailand
Nison Sattayasai
Department of Biochemistry, Faculty of Science, ,Khon Kaen University, Khon Kaen, 40002 Thailand
Prapansak Chaveerach
Department of Veterinary Public Health, Faculty of Veterinary Medicine,Khon Kaen University, Khon Kaen, 40002 Thailand
Alongkoad Tanomtong
Department of Biology, ,Khon Kaen University, Khon Kaen, 40002 Thailand
Krit Pinthong
Biology Program, Faculty of Science and Technology, Surin Rajabhat University, Surin, 32000 Thailand
Journal of Biological Sciences
Year: 2008 | Volume: 8 | Issue: 2 | Page No.: 278-287


ABSTRACT
The genetic relationship of 20 Carnivora species in Thailand was determined based on sequence analysis of the Internal Transcribed Spacer (ITS) region of ribosomal DNA. Aligned sequences of the complete ITS region obtained from the 20 taxa and two primate outgroups resulted in 890 characters with 710 variable sites. Genetic distances and a phylogenetic tree were constructed from comparisons of ITS sequences using the Neighborjoining method. The dendogram demonstrates that the 22 taxa can be clearly grouped in six clusters: Mustelidae, Ursidae, Canidae, Felidae, Viveridae and Hylobatidae. Of these clusters, the 20 Canivora species are clustered together and the superfamilies Caniformia and Feliformia can be separated apart, whereas the outgroup Hylobatidae is segregated from the canivora. In superfamilies Caniformia, the families Mustelidae, Ursidae and Canidae are clustered together. In superfamilies Feliformia, the family Felidae is clustered with Viverridae. The phylogenetic tree of Viverridae species does not completely match the classification based on morphological characters. The Paradoxurinae, Arctictis binturong was grouped into the Viverrinae while the other Paradoxurinae, Paradoxurus hermaphroditus, Paguma larvata and Arctogalidia trivirgata are clustered together.
PDF Abstract XML References Citation
How to cite this article
Arunrat Chaveerach, Nattapong Srisamoot, Suporn Nuchadomrong, Nison Sattayasai, Prapansak Chaveerach, Alongkoad Tanomtong and Krit Pinthong, 2008. Phylogenetic Relationships of Wildlife Order Carnivora in Thailand Inferred from the Internal Transcribed Spacer Region. Journal of Biological Sciences, 8: 278-287.
DOI: 10.3923/jbs.2008.278.287
URL: https://scialert.net/abstract/?doi=jbs.2008.278.287
DOI: 10.3923/jbs.2008.278.287
URL: https://scialert.net/abstract/?doi=jbs.2008.278.287
INTRODUCTION
In Thailand, the mammalian order Carnivora includes 6 families and has been classically divided into two monophyletic superfamilies, Carniformia and Feliformia (Eisenberg, 1989; Wozencraft, 1989; Wyss and Flynn, 1993). Caniformia has usually been organized into the families Canidae, Ursidae and Mustelidae while Feliformia has been partitioned into the families Viveridae, Felidae and Herpestidae (Eisenberg, 1989; Flynn and Nedbal, 1998). Despite numerous efforts, however, evolutionary relationships within and among the diverse families of living Carnivora species remain controversial. Habitat loss has occurred violently throughout Southeast Asia over the past 20 years and some of these carnivore species are vulnerable to population pressures and habitat fragmentation. Forest destruction has negatively affected wild animals such as carnivores. It reduces habitat for wild animals and causes population fragmentation due to the loss of genetic heterogeneity and thus they become vulnerable to environmental change and risk extinction. Molecular genetic data for Carnivora in Thailand, such as phylogenetic relationships, is directly needed for conservation.
During the past decades, the phylogenetic relationships among the Carnivora have been addressed by several studies that employed both morphological and molecular techniques. Early efforts included comparative karyology (Wurster-Hill and Centerwall, 1982; Modi and O’Brien, 1988), cross-species chromosome painting (Tian et al., 2004), albumin immunological distance (Collier and O’Brien, 1985), comparative morphology (Salles, 1992), allozyme electrophoresis (O’Brien et al., 1987; Pecon-Slattery et al., 1994) and two-dimensional protein electrophoresis (Pecon-Slattery et al., 1994). More recently, efforts to resolve phylogenetic relationships have focused on the nuclear DNA sequence (Flynn et al., 2005; Sato et al., 2006; Zhang et al., 2006) and mitochondrial genome (Lopez et al., 1994; Janczewski et al., 1995; Johnson et al., 1996; Uphyrkina et al., 2002; Johnson et al., 2004; Flynn et al., 2005; Koepfli et al., 2006). In more recent studies, sequences from two other nuclear genes, Interphotoreceptor Retinoid-Binding Protein gene (IRBP) and recombination-activating gene 1 (RAG 1), have also been applied in phylogenetic analyses (Sato et al., 2003, 2004; Yoder et al., 2003; Yu et al., 2004). However, few analyses have included information from Internal Transcribed Spacer (ITS) sequence data.
The Internal Transcribed Spacer (ITS) of nuclear ribosomal DNA (rDNA) is one of the most extensively sequenced molecular markers (Alvarez and Wendel, 2003). The two internal transcribed spacers, ITS-1 and ITS-2, are located between genes encoding the 5.8, 18 and 26 sec nuclear ribosomal RNA (nrRNA) subunits (Baldwin, 1992). The ITS-1 and ITS-2 spacers, in addition to the 5.8 sec nrRNA are referred to as the ITS region (Baldwin, 1992). Individually, ITS-1 and ITS-2 are around 300 basepairs (bp) in length and the 5.8 subunit is almost invariant in length making the ITS region variant in varies species and several factors make the ITS region valuable for use in phylogenetic analyses (Baldwin et al., 1995). Moreover, the genetic relationships within wildlife order Carnivora in Thailand have never been addressed using the sequence of ITS region.
In this study, we analyzed the sequence of internal transcribed spacer regions to determine the phylogenetic relationships among some wildlife Carnivora in Thailand.
MATERIALS AND METHODS
Sample collections and DNA extraction: Blood samples of 20 Carnivora species and primate outgroups (Hylobates lar and Hylobates agilis) were taken from Northern, Northeastern and Southern regions of Thailand in 2003-2004 (Table 1). Genomic DNA was isolated from blood samples using protinase K digestion and treatment with phenol/chloroform (Sambrook et al., 1989). The quality and quantity of extracted DNA was checked by 0.8% agarose gel electrophoresis and spectrophotometry.
Polymerase chain reaction amplification and sequencing: The complete ITS region of each species was amplified with primers ITSI (5’-TCGTAACAAGGTTTCCGTAGGT-3’) and ITSII (5’-GTAAGTTTCTTCTCCTCCGCT-3’) (Tsai et al., 2004). The ITS amplification reaction consisted of 20 ng DNA extract, 1.5 mM MgCl2, 1X buffer, 2.0 mM dNTP mix, 0.075 mM ITSI and ITSII primers and 0.5 U AmpliTaq DNA PRISMTM big dye Terminator Cycle Sequencing Ready Reaction Kit (Perkin Elmer).
| Table 1: | Twenty Carnivora species and two primate outgroups, their systematic classification, Fig. 1 lane number, source of collection and ITS length |
 | |
| polymerase (Invitrogen, USA) in a final volume of 25 μL. Amplification was completed in a thermalcycler (9700, GeneAmp® PCR system, Applied Biosystem, USA) with the following cycling parameters: 94°C for 5 min, 40 cycles of 94°C for 45 sec, 55°C for 45 sec, 72°C and a final extension of 10 min at 72°C. Amplification products of the correct size were verified on 1% agarose gels. The sequencing reactions were performed by using ABI | |
The ITSI primer was used as sequencing primer for the ITS amplification. Reactions were then electrophoresed on an ABI 377 automatic sequencer (Perkin Elmer, Applied Biosystem, USA).
DNA sequence alignment and phylogenetic analysis: Genetic relationships were determined using the program MEGA version 2.1 (Tamura et al., 2007). The genetic distance matrix was calculated by the two-parameter method of Kimura (1980) and then was used to construct a phylogenetic tree using the Neighbor-Joining method (NJ) (Saitou and Nei, 1987) with interior branch tests of 1000 replicates (Sitnikova et al., 1995).
RESULTS AND DISCUSSION
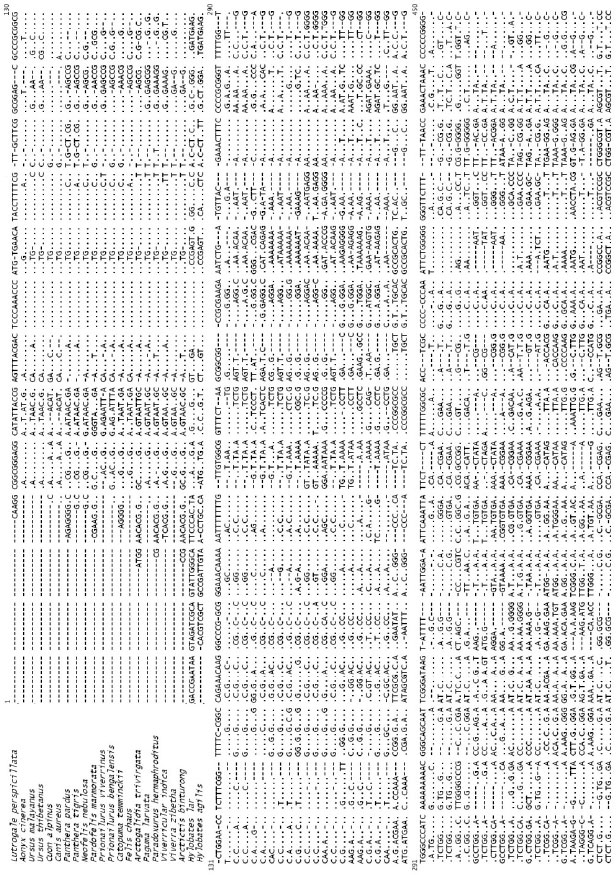
The primers (ITSI and ITSII) were used for PCR and sequencing. The PCR product of the 20 Carnivora species and two primate outgroups were analyzed by agarose gel electrophoresis and a single fragment (approximately 750 bp in length) shown (Fig. 1). The nucleotide sequences were further determined. The length of the ITS region in Carnivora species varied from 713 (Viverra zibetha) to 775 bp (Catopuma temminckii). ITS regions of the outgroups were 699 bp in Hylobates agilis and 720 bp in Hylobates lar (Table 1). ITS sequences of the 20 Carnivora species and two primate outgroups were aligned and resulted in 890 characters with 710 variable sites (79.78%) as show in Fig. 2.
Genetic distances among the 22 taxa ranged from 0.05 between Ursus malayanus and Ursus thibetanus to 0.93 between Hylobates lar and Viverricular indica according to the two-parameter method of Kimura (1980). A genetic distance matrix is shown in Table 2. Among the 20 Carnivora species, the range of genetic distances was from 0.05 between Ursus malayanus and Ursus thibetanus to 0.89 between Cuon alpinus and Paradoxurus hermaphroditus.
The dendrogram constructed from comparisons of ITS sequences using the Neighbor-Joining method (NJ)demonstrate that the 22 taxa can be clearly grouped in six clusters: Mustelidae, Ursidae, Canidae, Felidae, Viveridae and Hylobatidae. Of these clusters, the 20 canivora species are clustered together and the superfamilies Caniformia and Feliformia can be separated apart, whereas the outgroup Hylobatidae is segregated from the canivora with 100% bootstrap value (Fig. 3). In superfamilies Caniformia, the families Mustelidae, Ursidae and Canidae are clustered together with 76% bootstrap support. In superfamilies Feliformia, the family Felidae is clustered with Viverridae with 98% bootstrap support. The representative species in families Canidae (Canis aureus and Cuon alpinus), Ursidae (Ursus thibetanus and Ursus malayanus) and Mustelidae (Lutrogale perspicillata and Aonyx cinerea), are clustered together. In family Viverridae, the viverrinae, Viverra zibetha and Viverricular indica are clustered together attaching with Arctictis binturong of Paradoxurinae, while the other Paradoxurinae, Paradoxurus hermaphroditus, Paguma larvata and Arctogalidia trivirgata are clustered together. In family Felidae, the Felinae, Prionailurus bengalensis, Prionailurus viverrinus, Felis chaus and Catopuma temminckii are clustered together without Pardofelis marmorata. Moreover, Pardofelis marmorata produces a sister species to the Pantherinae, Neofelis nebulosa and these sister species clustered with Panthera tigris and Panthera pardus.
The ITS sequence has been widely used for phylogenetic analyses, especially in plants (Tsai et al., 2004). In the present study, the genetic relationships among Carnivora species in Thailand have been determined by using the ITS region including ITS1, 5.8 sec ribosomal DNA and the ITS2 region. As shown in Fig. 2, the ITS regions are highly variable (79.78%). The numerous variable sites of ITS region reflect the genetic diversity of Carnivora species. Interspecific variations in ITS regions among Carnivora species were very high as indicated by the range of genetic distances from 0.05 to 0.89.
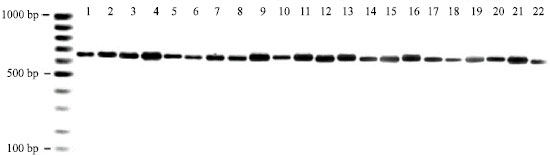 | |
| Fig. 1: | Gel electrophoresis of the amplified ITS region of 20 Carnivora species and two primates outgroups. Lanes are numbered according to the species list shown in Table 1 |
 | |
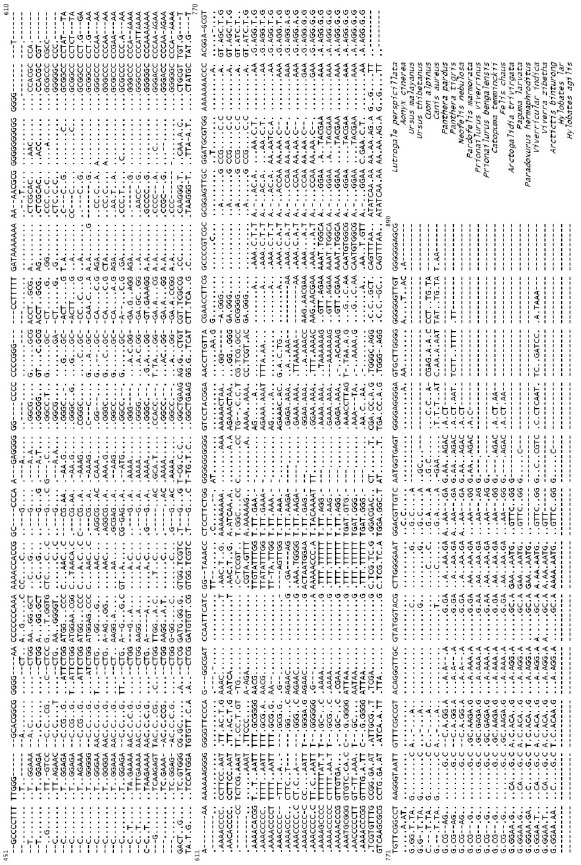 | |
| Fig. 2: | Sequence comparison of ITS regions from 20 Carnivora species and two primate outgroups in Thailand. Dots (·) indicate the same nucleotides and dashes (-) are introduced to gap |
| Table 2: | Genetic distances of the ITS sequence among twenty Carnivora species and two primate outgroups according to the two-parameter method of Kimura |
 | |
| (1) L. perspicillata, (2) A. cinerea, (3) U. malayanus, (4) U. thibetanus, (5) C. alpinus, (6) C. aureus, (7) P. pardus, (8) P. tigris, (9) N. nebulosa, (10) P. marmorata, (11) P. bengalensis, (12) P. viverrinus, (13) C. temminckii, (14) F. chaus, (15) A. trivirgata, (16) P. larvata, (17) P. hermaphroditus, (18) V. indica, (19) V. zibetha, (20) A. binturong, (21) H. lar and (22) H. agilis | |
 | |
| Fig. 3: | A dendrogram of the twenty Carnivora species and two primate outgroups constructed from sequences comparisons of the ITS region using the Neighbor-Joining (NJ) method |
Based on morphological data, the classification of the mammalian order Carnivora in this study should group the five families namely Canidae, Ursidae, Mustelidae, Viveridae and Felidae (Eisenberg, 1989; Wozencraft, 1989; Wyss and Flynn, 1993). Thus, the phylogenetic tree of Carnivora species deduced from the ITS sequence completely matches the classification based on morphological characters. Furthermore, the two monophyletic superfamilies Carniformia and Feliformia can be separated apart, which supports molecular data previously reported by Yu et al. (2004). In superfamilies Caniformia, the family Ursidae was depicted as the closest lineage to the Canidae followed by the Mustelidae. In contrast, the phylogenetic of the Caniformia constructed from the first intron of TTR gene (Flynn and Nedbal, 1998), the combining phylogenetic information (Bininda-Emonds et al., 1999) and the sequence of the TTR gene and the combination of IRBP and TTR gene data sets (Yu et al., 2004) demonstrated that the Ursidae was positioned as the sister group of the Mustelidae, followed by the Canidae. Moreover, the IRBP data placed the Ursidae as a sister group of the Mustelidae and Canidae clade (Yu et al., 2004). Based on the average genetic distances between groups (Table 3), however, the Mustelidae posses equal genetic distance (0.40) to the Ursidae and Canidae. Present results suggest that the superfamilies Feliformia, family Felidae and Viverridae are clustered together and completely separated into two groups. The phylogenetic tree of the Viverridae species deduced from the ITS sequence, however, does not completely match the classification based on morphological characters (Eisenberg, 1989; Flynn and Nedbal, 1998). The Paradoxurinae, Arctictis binturong was grouped into the Viverrinae, clustered with 47% bootstrap support, while the other Paradoxurinae, Paradoxurus hermaphroditus, Paguma larvata and Arctogalidia trivirgata are clustered together with 97% bootstrap value. However, the combining phylogenetic information form Bininda-Emonds et al. (1999) and the mitochondrial cytochrome b sequence data by Veron and Heard (2000) have reported the close genetic relationships of Paguma larvata and Arctictis binturong. In order to evaluate and maintain the biological diversity represented in the Viverridae, an improved understanding of the taxonomy and phylogeny of the viverrids is of major importance. Clarification of this phylogeny is also of great significance in understanding carnivore evolution, given that the viverrids retain many of the phylogenetically primitive characteristics of the first Feliformia. To date, the phylogeny of the Viverridae remains controversial (Wyss and Flynn, 1993; Flynn and Nedbal, 1998) and very few Viverrid species have been included In previous molecular phylogenetic studies (Veron and Heard, 2000).
| Table 3: | Average genetic distances within and between group of carnivora species and two primate outgroups |
 | |
However, recently their cytogenetics were studied by Tanomtong et al. (2005) with wild animal species of the subfamily Paradoxurinae in Thailand including Paguma larvata, Arctictis binturong, Paradoxurus hermaphroditus and Arctogalidia trivirgata and their results showed the number of diploid chromosomes as 44, 42, 42 and 40, respectively. Morover, Tanomtong et al. (2006) reported chromosome numbers of 38 for Viverra zibetha and 36 for Viverricular indica. These show the genetic diversity of the Viveridae species. In this study, the average genetic distances of Arctictis binturong to the other Paradoxurinae (0.24) is lower than the Viverrinae (0.25). These indicate the high relationships in the Paradoxurinae, although, Arctictis binturong was placed into the Viverrinae group, but is only a bridge for Viverinae and Paradoxurinae.
In family Felidae, the Felinae, Prionailurus bengalensis and Prionailurus viverrinus are more closely related to Felis chaus than Catopuma temminckii with 92% bootstrap support, agreeing with Bininda-Emonds et al. (1999), Mattern and McLennan (2000) and Pecon-Slattery et al. (2004), while Johnson and O’Brien (1997), Ortolani (1999) and Srisamoot et al. (2007) reported that Prionailurus bengalensis and Prionailurus viverrinus is more closely related to Catopuma temminckii than Felis chaus. However, based on present study, Prionailurus bengalensis and Prionailurus viverrinus (Asian leopard cat group) possessed the equal genetic distances (0.29) to those Catopuma temminckii and Felis chaus.
Astonishingly, the Felinae, Pardofelis marmorata was placed as a sister species to the Pantherinae with high bootstrap value (81%). Recently, it has been considered that Pardofelis marmorata should be placed in the subfamily Felinae (Bininda-Emonds et al., 1999; Mattern and McLennan, 2000; Pecon-Slattery et al., 2004; Srisamoot et al., 2007). From the cluster analysis of this study, Pardofelis marmorata was separated from the subfamily Felinae, which is contrary to morphological classification and the above other studies. However, the separation of Felidae into two groups of big cats (Pantherinae) and small cats (Felinae) is generally supported by most studies. Moreover, a clear size dichotomy does seem to exist in Felidae and the shape and size of Pardofelis marmorata is according to Felinae (Bininda-Emonds et al., 2001). Based on our study, we found a close relationship between Pardofelis marmorata and Neofelis nebulosa with low genetic distance (0.17), according to the phylogenetic tree recently constructed by Bininda-Emonds et al. (1999), Ortolani (1999) and Srisamoot et al. (2007). Support for monophyletic groups composing the Felidae species is abundant from morphological characters (Neff, 1982; Salles, 1992; Peters and Hast, 1994) as the separation of Felidae into three groups of big cats, medium cats and small cats. Therefore, in order to resolve the genetic relationships between the Carnivora species, especially in Felidae properly, it is necessary to study larger samples, which are most difficult for wildlife studies. Thus, these results suggest that genetic analysis based on the sequence of ITS region has a good capacity for the study of genetic relationships, especially in Carnivora species.
ACKNOWLEDGMENTS
Some parts of this study were supported by a research grant from the Thailand Zoological Park Organization under the Royal Patronage of His Majesty the King.
REFERENCES
- Alvarez, I. and J.F. Wendel, 2003. Ribosomal its sequences and plant phylogenetic inference. Mol. Phylogenet. Evol., 29: 417-434.
CrossRefPubMedDirect Link - Baldwin, B.G., 1992. Phylogenetic utility of the internal transcribed spacers of nuclear ribosomal DNA in plants: An example from the compositae. Mol. Phylogenet. Evol., 1: 3-16.
CrossRefDirect Link - Baldwin, B.G., M.J. Sanderson, J.M. Porter, M.F. Wojciechowski, C.S. Campbell and M.J. Donoghue, 1995. The ITS region of nuclear ribosomal DNA: A valuable source of evidence on angiosperm phylogeny. Ann. Missouri Bot. Garden, 82: 247-277.
Direct Link - Bininda-Emonds, O.R.P., J.L. Gittleman and A. Purvis, 1999. Building large trees by combining phylogenetic information: a complete phylogeny of the extant Carnivora (Mammalia). Biol. Rev., 74: 143-175.
Direct Link - Bininda-Emonds, O.R.P., D.M. Decker-Flum and J.L. Gittleman, 2001. The utility of chemical signals as phylogenetic characters: An example from the felidae. Biol. J. Linn. Soc., 72: 1-15.
Direct Link - Collier, G.E. and S.J. O`Brien, 1985. A molecular phylogeny of the felidae: Immunological distance. Evology, 39: 473-487.
Direct Link - Flynn, J.J. and M.A. Nedbal, 1998. Phylogeny of the Carnivora (Mammalia): Congruence vs incompatibility among multiple data sets. Mol. Phylogenet. Evol., 9: 414-426.
CrossRefDirect Link - Flynn, J.J., J.A. Finarelli, S. Zehr, J. Hsu and M.A. Nedbal, 2005. Molecular phylogeny of the Carnivora (Mammalia): Assessing the impact of increased sampling on resolving enigmatic relationships. Syst. Biol., 54: 317-337.
CrossRef - Janczewski, D.N., W.S. Modi, J.C. Stephens and S.J. O`Brien, 1995. Molecular evolution of mitochondrial 12S RNA and cytochrome b sequences in the pantherine lineage of felidae. Mol. Biol. Evol., 12: 690-707.
Direct Link - Johnson, W.E., P.A. Dratch, J.S. Martenson and S.J. O`Brien, 1996. Resolution of recent radiations within three evolutionary lineages of felidae using mitochondrial restriction fragment length polymorphism variation. J. Mammal. Evol., 3: 97-120.
CrossRef - Johnson, W.E. and S.J. O’Brien, 1997. Phylogenetic reconstruction of the Felidae using 16SrRNA and NADH-5 mitochondrial genes. J. Mol. Evol., 44: S98-S106.
CrossRefDirect Link - Johnson, W.E., J.A. Godoy, F. Palomares, M. Delibes, M. Fernandes, E. Revilla and S.J. O’Brien, 2004. Phylogenetic and phylogeographic analysis of iberian lynx populations. J. Hered., 95: 19-28.
Direct Link - Kimura, M., 1980. A simple method for estimating evolutionary rates of base substitutions through comparative studies of nucleotide sequences. J. Mol. Evol., 16: 111-120.
CrossRefDirect Link - Koepfli, K., S.M. Jenks, E. Eizirik, T. Zahirpour, B.V. Valkenburgh and R.K. Wayne, 2006. Molecular systematics of the hyaenidae: Relationships of a relictual lineage resolved by a molecular supermatrix. Mol. Phylogenet. Evol., 38: 603-620.
Direct Link - Lopez, J.V., N. Yuhki, R. Masuda, W. Modi and S.J. O'Brien, 1994. Numt, A recent transfer and tandem amplification of mitochondrial DNA to the nuclear genome of the domestic cat. J. Mol. Evol., 39: 174-190.
CrossRefDirect Link - Mattern, Y.M. and A.D. McLennan, 2000. Phylogeny and speciation of felids. Cladistics, 16: 232-253.
CrossRef - Ortolani, A., 1999. Spots, stripes, tail tips and dark eyes: Predicting the function of carnivore colour patterns using the comparative method. Biol. J. Linn. Soc., 67: 433-476.
CrossRef - Pecon-Slattery, J., W.E. Johnson, D. Goldman and S.J. O’Brien, 1994. Phylogenetic reconstruction of South American felids defined by protein electrophoresis. J. Mol. Evol., 39: 296-305.
CrossRefDirect Link - Pecon-Slattery, J., A.J. Pearks Wilkerson, W.J. Murphy and S.J. O’Brien, 2004. Phylogenetic assessment of introns and SINEs within the Y chromosome using the cat family felidae as a species tree. Mol. Biol. Evol., 21: 2299-2309.
Direct Link - Peters, G. and M.H. Hast, 1994. Hyoid structure, laryngeal anatomy and vocalization in felids (Mammalia: Carnivora: Felidae). Z. Saugetierkunde, 59: 87-104.
Direct Link - Saitou, N. and M. Nei, 1987. The neighbor-joining method: A new method for reconstructing phylogenetic trees. Mol. Biol. Evol., 4: 406-425.
CrossRefPubMedDirect Link - Sambrook, J., E.F. Fritsch and T.A. Maniatis, 1989. Molecular Cloning: A Laboratory Manual. 2nd Edn., Cold Spring Harbor Laboratory Press, Cold Spring Harbor, New York, USA., ISBN-13: 9780879695774, Pages: 397.
Direct Link - Sato, J.J., T. Hosoda, M. Wolsan, K. Tsuchiya, M. Yamamoto and H. Suzuki, 2003. Phylogenetic relationships and divergence times among Mustelids (Mammalia: Carnivora) based on nucleotide sequences of the nuclear interphotoreceptor retinoid binding protein and mitochondrial cytochrome b genes. Zool. Sci., 20: 243-264.
Direct Link - Sato, J.J., T. Hosoda, M. Wolsan and H. Suzuki, 2004. Molecular phylogeny of Arctoids (Mammalia: Carnivora) with emphasis on phylogenetic and taxonomic positions of the Ferret-badgers and skunks. Zool. Sci., 21: 111-118.
Direct Link - Sato, J.J., M. Wolsan, H. Sizuki, T.Hosoda, Y. Yamaguchi, K. Hiyama, M. Kobayashi and S. Minami, 2006. Evidence from nuclear DNA sequences sheds light on the phylogenetic relationships of pinnipedia: Single origin with affinity to musteloidea. Zool. Sci., 23: 125-146.
Direct Link - Sitnikova, T., A. Rzhetsky and M. Nei, 1995. Interior-branch and bootstrap tests of phylogenetic trees. Mol. Biol. Evol., 12: 319-333.
CrossRefDirect Link - Srisamoot, N., A. Chaveerach, S. Nuchadomrong, N. Sattayasai, P. Chaveerach, A. Tanomtong and K. Pinthong, 2007. Genetic relationships among wild felidae in Thailand using AFLP markers. Pak. J. Biol. Sci., 10: 2639-2645.
Direct Link - Tamura, K., J. Dudley, M. Nei and S. Kumar, 2007. MEGA4: Molecular Evolutionary Genetics Analysis (MEGA) software version 4.0. Mol. Biol. Evol., 24: 1596-1599.
CrossRefPubMedDirect Link - Tanomtong, A., A. Sriphoom and R. Bunjongrat, 2005. Cytogenetic study on wild animal species of the subfamily Paradoxurinae in Thailand. Cytologia, 70: 249-255.
Direct Link - Tanomtong, A., A. Chaveerach and R. Bunjonrat, 2006. Comparative karyotypic studies on three species of the subfamily Viverrinae in Thailand. Cytologia, 713: 269-273.
CrossRefDirect Link - Tian, Y., W. Nie, J. Wang, M.A. Ferguson-Smith and F. Yang, 2004. Chromosome evolution in bear: Reconstructing phylogenetic relationships by cross-species chromosome painting. Chromosome Res., 12: 55-63.
Direct Link - Tsai, C.C., C.I. Peng, S.C. Huang, P.L. Huang and C.H. Chou, 2004. Determination of the genetic relationship of Dendrobium species (Orchidaceae) in Taiwan based on the sequence of the internal transcribed spacer of ribosomal DNA. Sci. Hort., 101: 315-325.
CrossRef - Uphyrkina, O., D. Miquelle, H. Quigley, C. Driscoll and S.J. O’Brien, 2002. Conservation genetics of far eastern leopard (Panthera pardus orientalis). J. Hered., 93: 303-311.
Direct Link - Veron, G. and S. Heard, 2000. Molecular systematics of the Asiatic Viverridae (Carnivora) inferred from mitochondrial cytochrome b sequence analysis. J. Zool. Syst. Evol. Res., 38: 106-198.
CrossRefDirect Link - Wurster-Hill, D.H. and W.R. Centerwall, 1982. The interrelationships of chromosome banding patterns in canids, hyena and felids. Cytogenet. Cell. Genet., 34: 178-192.
PubMed - Yoder, A.D., M.M. Burns, S. Zehr, T. Delefosse, G. Veron, S.M. Goodman and J.J. Flynn, 2003. Single origin of Malagasy carnivore from an African ancestor. Nature, 421: 734-737.
Direct Link - Yu, L., Q.W. Li, O.A. Ryder and Y.P. Zhang, 2004. Phylogeny of the bears (Ursidae) based on nuclear and mitochondrial genes. Mol. Phylogenet. Evol., 32: 480-494.
CrossRefDirect Link - Zhang, W., Z. Zhang, F. Shen, R. Hou, X. Lv and B. Yue, 2006. Highly conserved D-loop-like nuclear mitochondrial sequences (Numts) in tiger (Panthera tigris). J. Genet., 85: 107-116.
CrossRefDirect Link