
Salima Ouadfel
Department of Computer Science, University of Batna, Algeria
Mohamed Batouche
Computer Vision Group, LIRE Laboratory, University of Constantine, Algeria
Information Technology Journal
Year: 2007 | Volume: 6 | Issue: 2 | Page No.: 196-201


ABSTRACT
An artificial ants clustering algorithm (AntClust) is proposed in this study to resolve the segmentation problem. AntClust uses the self-organizing and autonomous brood sorting behavior observed in real ants. Ants move on a discrete array of cells represented the ants’ environment. Ants may move pixels that are scatted within the cells of the array can be moved from one cell to another. In this way, ants form clusters without the initial knowledge of the number of clusters and initial partition. Experimental results on synthetic and real images demonstrate the ability of AntClust to extract the correct number of clusters with good clustering quality compared to the results obtained from a classical clustering algorithm like K-means algorithm.
PDF Abstract XML References Citation
How to cite this article
Salima Ouadfel and Mohamed Batouche, 2007. AntClust: An Ant Algorithm for Swarm-Based Image Clustering. Information Technology Journal, 6: 196-201.
DOI: 10.3923/itj.2007.196.201
URL: https://scialert.net/abstract/?doi=itj.2007.196.201
DOI: 10.3923/itj.2007.196.201
URL: https://scialert.net/abstract/?doi=itj.2007.196.201
INTRODUCTION
Image segmentation is a fundamental task in a vision system. Its purpose is to subdivide an image into meaningful non-overlapping regions (Monga and Wrobel, 1987; Pal and Pal, 1993). Image segmentation can be viewed as a clustering problem, which aims to partition the image into clusters such that the pixels within a cluster are as homogenous as possible whereas the clusters among each other are as heterogeneous as possible with respect to a similarity measure.
Clustering algorithms can be divided into four main classes: partitioning methods, hierarchical methods, density-based clustering and grid-based clustering. Jain et al. (2000) for an extensive survey of clustering techniques. Several partitioning methods are provided in the literature; they can be classified as Hard or Fuzzy algorithms. In Hard clustering algorithms, the pixel is assigned to one cluster. Fuzzy algorithms can assign pixels to multiple clusters. The degree of membership in the clusters depends on the closeness of the pixels data point to the cluster center. The drawback of the most portioning algorithms is, prior knowledge of the number of clusters in the pixels is required and they have significant sensitivity to cluster center initialization.
For many years now, several papers have highlighted the efficiency of approaches inspired from the nature (Bonabeau and Theraulaz, 2000). In particular, a variety of algorithms inspired from the swarm intelligence observed from the ants‘ behaviors such food hunting and nest building have been introduced for solving several combinatorial optimization problems. In this respect ant algorithms have been recently emerged. In this field we found the Ant Colony Optimization (ACO) inspired from the foraging behavior of ant colonies and the ant based clustering algorithms based on the cemetery organization and brood sorting of ants (Handl, 2003).
Cemetery building is obtained when ants clean their nests and form piles by collecting corpses found within the nest. Brood sorting is widespread in ant colonies. Ants gather their larvae together according to the larva’s size. The basic principle of this sorting behavior is attraction between the items transported by the ant. Small clusters of similar items grow by attracting ants to deposit more items according to their type or their size. This positive feedback leads to formation of homogeneous clusters (Monmarche, 1999).
The first modelization of this ants’ behavior has been done by Deneubourg et al. (1991). In their model a population of simple ants are used to cluster objects together using simple local rules and without any central control. From this basic model, Lumer and Faieta (1994) introduced further developments and extend its application to clustering data objects. The LF algorithm’s basic principles are straightforward: ants and data objects are scattered randomly on a rectangular grid, which represents the environment of the ants. Ants move on the grid and probably pick up and drop data objects using a measure of similarity of two data objects and density of data objects within the ants’ local neighborhood. Both the Deuneubourg and LF algorithms have become well-known models that have been extensively used in different applications like data mining (Lumer and Faieta, 1994; Monmarche, 1999), graph-partitioning (Langham and Grant, 1999) and text-mining (Handl, 2003; Ramos and Merelo, 2002).
From these basic models, some works have been done concerning the setting of the parameters like the size of the grid which influence the convergence of the algorithm and the overall quality of the clustering obtained based essentially of visual observation (Handl, 2003; Ramos and Merelo, 2002; Monmarche, 1999).
Based on the existing works, we propose in this study AntClust a new ant-based clustering algorithm for image segmentation. In AntClust, ants are modeled by simple agents that randomly move on a discrete array. Pixels that are scatted within the cells of the array can be moved from one cell to another to form clusters. The pixels’ movement are Implemented indirectly through the ants’ movement. Each ant can picks up or drop a pixel according to a similarity function which measures the pixel’ similarity with the center of a cluster. In this way, ants dynamically cluster pixels into distinctive independent groups within which similar pixels are closely placed in the same cluster.
AntClust introduced new probabilistic rules for picking up or dropping pixels and also a local movement strategy is used to speed up the clustering convergence. Experimental results show that AntClust algorithm gives better clustering quality compared to those obtained from K-means algorithm.
Ant-based clustering algorithms are based upon the brood sorting behavior of ants. The pioneer of this work are Deneubourg et al. (1990, 1991) which apply it for tasks in robotics. This basic work has been modified by Lumer and Faieta (1994) to extend to numerical data analysis. In LF algorithm, the data is randomly dispersed onto a two dimensional grid. Each ant moves randomly around this grid picking and dropping the data items. The decision to pick up or drop an item is random but is influenced by the data items in the ant’s immediate neighborhood, thus causing similar items to be more likely placed together on the grid. The probability of dropping an object increases with high densities of similar objects in the neighborhood. In contrast, the probability of picking an object increases with low-density neighborhoods and decreases with high similarity among objects in the surrounding area.
The probability of picking Pp and dropping Pd are given by
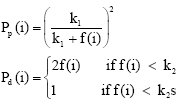 | (1) |
with
 | (2) |
r (i) is the position of the data item i on the grid and f (i) is a measure of the average dissimilarity of object ii to the other objects j present in its neighborhood. α is the scale of the dissimilarity and its value is crucial to the successful execution of this algorithm.
Lumer and Faieta (1994) have introduced the notion of a short-term memory within each agent. Each ant remembers a small number of locations where it has successfully dropped an item. And so, when picking a new item this memory is consulted in order to bias the direction in which the ant will move. Thus, the ant tends to move towards the location it last dropped a similar item.
Monmarche (1999) proposed AntClass which is a major extension of the LF algorithm. In AntClass, ants can load and drop more than an object in the same cell, forming heaps of objects. More, it is a hybridization of ant-based algorithm and the k-means algorithm.
ANTCLUST ALGORITHM
AntClust is a distributed algorithm that uses positive feedback to achieve the clustering of pixels. It is mainly based on the versions described in (Lumer and Faieta, 1994; Monmarche, 1999). A number of slight modifications have been introduced that improve the quality of the clustering and to speed up of the convergence.
In both LF and AntClass algorithms, the ants evolve of the discrete 2D board. The size of this grid should be selected in dependence of the data collection, as it otherwise impairs convergence speed. If the size is too small, the ants carrying data items will make everlasting move since they will never find an empty case to drop down them. This will consume large amount of computational time. Otherwise, if the size of the grid is too large, ants will make idle movement when no carrying data items before encountering an item data.
As far as we know these is not theoretical guideline to determine automatically the size of the board. For this reason, we replace the rectangular grid by a discrete array of N cells when N is the total number of pixels to be clustered. All cells of the array are connected to the nest of the ants’ colony in order to let the ants travel from one cell to another easily. During the algorithm ants are able to create, build or destroy existing clusters of pixels. A cluster is defined as a collection of two or more pixels. As in (Monmarche, 1999), a cluster is spatially located in a single cell, which makes the identification of clusters easily unlike in the LF algorithm where spatial patterns of objects car touch each other.
Initially the N pixels {p1, ….., pN} to be clustered are placed on the array such that each array cell can only occupied by one pixel. Each ant ai from a colony of K ants {a1, …., aK} picks up a randomly chosen pixel from its cell and returns to his nest. After this initialization phase, the clustering phase starts. During an iterative process, one ant is selected randomly; it performs a number of movements between its nest and the array and decides with a probabilistic rule whether or not to drop its pixel. If the ant becomes free, it searches for a new pixel to pick up. The ant has knowledge of a list of the locations of all pixels not being carried by other ants. The ant randomly selects a pixel from this list of free pixels and probabilistically decides whether or not to pick up that pixel. In the case of no decision, the ant continues its search until a successful operation occurs. This process is repeated for all ants. The stopping criterion of the algorithm is the number of iteration fixed by the user at the beginning.
The main AntCluster algorithm is presented in Fig. 1.
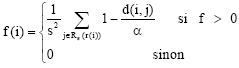
On the array, each ant ai may possibly picks up a pixel pi from a cell ck or drop it in the cell ck according to the similarity function f, which represents the average distance between the pixel pi and others pixels pj in the cell ck. It is used to determine when should pixel pi leave from others pixels. The similarity function is defined by:
(3) |
where d (pi, pj) is determined by the contrast between two pixels pi and pi in terms of gray level and is defined as:
(4) |
NG is the number of the gray levels in the image. α represents the mean distance between all pixels and is defined by
(5) |
The value of α can be calculated before the clustering process.
The function f (.) gives its maximum response when d (pi, pj) tend to 0.
In the following, we will explain in detail the heuristic and the exact mechanism for picking and dropping a pixel.
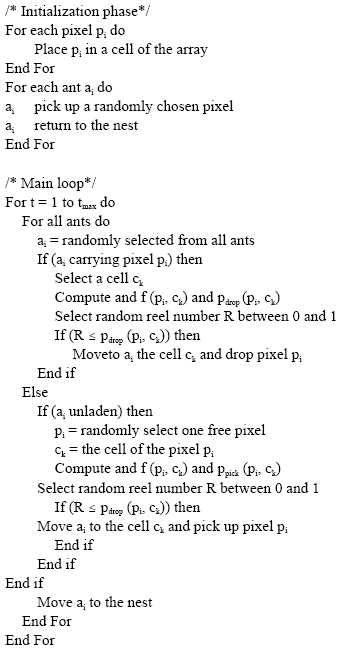 | |
| Fig. 1: | The AntClust algorithm |
Picking up a pixel: When the ant is not carrying any pixel, it searches for a possible pixel to pick up. This search is guide by an index table that contains all free pixels (not transported by the ants). This index table is function of the similarity between the gray level of the pixel and the cluster where it is located, such that the most dissimilar pixels, which are the most farthest from the center of theirs clusters are in the top of the index table. Three cases have to be considered: if the considered pixel pi is alone in its cell ck, if it has one pixel with it in the same cell and if there is some others pixels with it in the cell. In the first case, the ant picks up it automatically. In the second case, we have an invalid cluster with only two pixels; the ant will destroy this cluster by picking up the considered pixel with a probability q. In the third case, the ant has a high probability to pick up the pixel if its similarity with all the pixels in the cluster is too low (tend to 0).
For picking decision the following probability ppickup (pi, ck) is used:
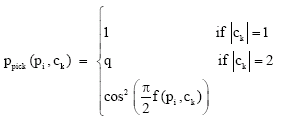 | (6) |
where q is a fixed parameter in [0, 1].
Dropping a pixel: Once an ant has picks up a pixel pi, it returns with it to the nest then it looks for an interesting new cell where it will drop it. For this purpose a modified version of the short-term memory introduced in (Lumer and Faieta, 1994; Monmarche, 1999) is used. Each ant remembers a small number of pixels that it has pick up and the cells where it has successfully dropped them. And so, when the ant is carrying a pixel, its memory is consulted in order to select a cell on which it could drop the pixel. It then evaluates locally the suitability of each of the memorized cells as dropping cell for the current carried pixel. For this, the similarity function f defined in Eq. 3 is applied to each cell and the best interesting cell ck is the one, at which the similarity function yields the higher value. Instead of just biasing the ants’ random walk as in (Lumer and Faieta, 1994; Monmarche, 1999). The ant directly moves from the nest to this cell. The decision whether to drop the pixel is taken probabilistically. The probability for pdrop (pi, ck) dropping the pixel is given in equation:
(7) |
EXPERIMENTAL SETUP
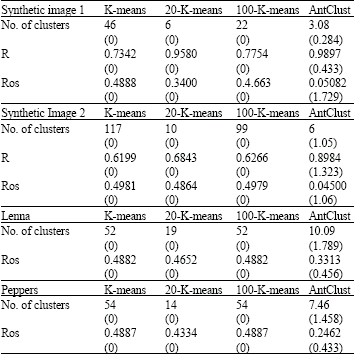
The AntClust algorithm was tested on synthetic and real images presented in Fig. 2 and 3. Synthetic images are used because the correct classification and the exact number of classes are known in advance. We can so evaluate the ability of the ant-clustering algorithm to find the correct number of clusters. Moreover, we can evaluate the partition computed by AntClust with the known correct partition.
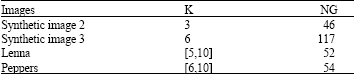
Table 1 resume the characteristic of each image like the number of clusters (K), the number of the gray levels (NG). The optimal range of the number of clusters for real images are taken from (Turi, 2001).
| Table 1: | Characteristics of test images |
 | |
| Table 2: | Values of the parameters of AntClust |
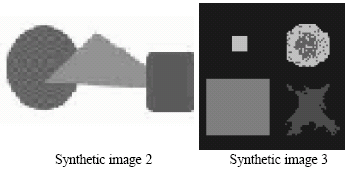 | |
| Fig. 2: | Synthetic test images |
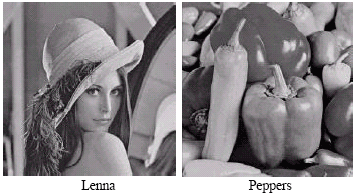 | |
| Fig. 3: | Real test images |
Table 2 summarized all ants setting used in our experimentations for all test images. Theses setting were selected because they gave good results in preliminary tests.
The quality of the clustering obtained by AntClust is compared to a classical clustering algorithm; the well-known K-means Algorithm. For this purpose, we initialize K-means with a number of cluster equal to the number of gray levels, with 20 and 100 clusters. Starting from a random partitioning, the algorithm repeatedly computed the centers of the clusters and reassigns each pixels to the cluster whose the center is closer to it in term of gray levels.
In order to formally evaluate the quality of the clustering obtained from the two algorithms AntClust and K-means on the test images, we used the Rand index and the Rosenberger’s measure (Rosenberger, 1999). The first of the two measures make use of the correct clustering which is known only for synthetic images. They are defined as follows:
The rand index R: It determines the degree of pixels (in term of pairwise co-assignments) that are correctly classified according to a segmented image seg and the reference image ref. It is defined as
(8) |
where a, b, c and d are parameters computed for each couples of pixels pi and pj as following: if cref (i), cref (j), cseg (i) and cseg (j) are the labels of clusters of pi and pj in reference image and the segmented one, we have
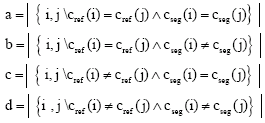 | (9) |
R takes its value in the interval [0,1] and is to be maximized.
The Rosenberger’s measure (Rosenberger, 1999): It combined inter-cluster and inter-cluster disparities. It is defined by the following equation
(10) |
The global intra-region disparity ![]() quantifies the homogeneity of each class in the segmented image (seg). is defined as:
quantifies the homogeneity of each class in the segmented image (seg). is defined as:
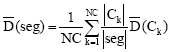 | (11) |
And
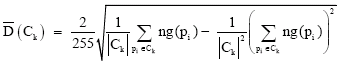 | (12) |
where NC is the number of clusters, ng (pi) is the gray level of the pixel pi
Similarly, the global inter-classes disparity ![]() measures the disparity between the classes. It is given by:
measures the disparity between the classes. It is given by:
(13) |
where qk is the number of classes cj that are neighborhood of the cluster ck. The disparity between two clusters is defined by the following equation:
(14) |
where ![]() is the centroid of cluster Ci and NG is the total gray levels present in the image to be segmented. A good clustering minimized the Rosenberger’s measure.
is the centroid of cluster Ci and NG is the total gray levels present in the image to be segmented. A good clustering minimized the Rosenberger’s measure.
RESULTS
Table 3 gives the means and standard deviation over 50 runs obtained for each of the two measures from the two clustering algorithms on synthetic and real images. Additionally, it gives the average number of clusters. The AntClust algorithm was simulated during 4500 iterations and the number of iterations of the Kmeans algorithm was set to 10.
As can be seen, AntClust algorithm outperforms the three versions of the K-means algorithm, both in terms of correct number of clusters, of rand index and of Rosenberg’s measure. In general the K-means algorithm over estimated the number of clusters which tends to be equal to the number of the gray levels present in the image to be segmented when the number of clusters gives to the algorithm is two high.
The results of Table 3 shows K-means and AntClust algorithms on synthetic and real images.
| Table 3: | K-means and AntClus algorithms on synthetic and real images |
 | |
CONCLUSION
In this study, a new warm-based algorithm for image segmentation is presented by simulating the behavior of brood sorting of ants. In AntClust, each pixel is placed on a discrete array, which represent the environment of the ants. Each ant may pickup a pixel or drops a pixel according to a similarity function that measures the degree of the similarity of a pixel with others pixels in the cluster. In AntClust, we proposed new probabilistic rules for picking and dropping pixels moving and a local moving strategy that have salient effect in fastening the clustering process. Experimental results on synthetic and real images demonstrated the ability of AntClust to extract the correct number of clusters and to give better clustering quality compared to those obtained from a classical clustering algorithm like K-means.
REFERENCES
- Deneubourg, J.L., S. Aron, S. Goss and J.M. Pasteels, 1990. The self-organizing exploratory pattern of the argentine ant. Dans J. Insect Behav., 3: 159-168.
Direct Link - Deneubourg, J.L., S. Goss, N. Franks, A. Sendova-Franks, C. Detrain and L. Chretien, 1991. The dynamic of collective sorting robot-like ants and ant-like robots. Proceedings of the 1st International Conference on Simulation of Adaptive Behavior on from Animals to Animats, September 24-28, 1990, Paris, France, pp: 356-363.
- Jain, A.K., R.P.W. Duin and J. Mao, 2000. Statistical pattern recognition: A review. IEEE Trans. Pattern Anal. Machine Intell., 22: 4-37.
CrossRefDirect Link - Langham, A.E. and P.W. Grant, 1999. Using competing ant colonies to solve k-way partitioning problems with foraging and raiding strategies. Lecture Notes Comput. Sci., 1674: 621-625.
Direct Link - Pal, N.R. and S.K. Pal, 1993. A review on image segmentation techniques. Pattern Recog., 9: 1277-1294.
CrossRefDirect Link