
Effendi Tri Bahtiar
Faculty of Forestry, Bogor Agricultural University, Kampus IPB Darmaga-Bogor, West Java, Indonesia
Arinana
Faculty of Forestry, Bogor Agricultural University, Kampus IPB Darmaga-Bogor, West Java, Indonesia
Naresworo Nugroho
Faculty of Forestry, Bogor Agricultural University, Kampus IPB Darmaga-Bogor, West Java, Indonesia
Dodi Nandika
Faculty of Forestry, Bogor Agricultural University, Kampus IPB Darmaga-Bogor, West Java, Indonesia
Asian Journal of Scientific Research
Year: 2014 | Volume: 7 | Issue: 4 | Page No.: 501-512


ABSTRACT
There are fluctuations of air temperature and relative humidity which make a cyclic loop every day. These fluctuations are caused by the sunrays radiation and earth surface energy. Sinusoidal equations are developed in this study to estimate the effect of both sunrays radiation and earth surface energy to the daily cycle of air temperature and relative humidity. A dummy variable is applied to represent the presence of sunrays radiation. The effect of this daily cycle to wood creep behavior is also studied. The wood samples which tested in this study are cut from the purlin of a 17 years old low cost house in Cibeureum Village, Bogor, West Java, Indonesia and identified as Saninten wood. Wood is more capable in resisting short term loading than long term loading. The deflections of wood beam under sustained load consist of initial deflection and creep deflection. Initial deflections immediately happen after load applied, while creep deflections is time dependent deflection as the result of viscous flow under long term loading and wood reaction to the surrounding condition (moisture content, temperature and relative humidity). Creep deflection is highly correlated with the logarithm of load duration. The creep deflection is increasing in decreasing rate as with the loading time for all of load level. The daily cycle of air temperature and relative humidity have opposite effect to the additional creep deflection. Air temperature has positive correlation with creep deflection, while relative humidity has negative correlation. Total additional creep deflection is superposition of both air temperature and relative humidity effects. The multiple regression analysis with logarithm transformation for load duration and sinusoidal transformation for daily cycle of air temperature and relative humidity are satisfactory fitted the empirical creep deflection data (R2 = 82.52-96.00%). This study succeed determining the daily fluctuation of temperature and relative humidity effects toward creep deflection by mathematical equation in regular room condition without controlling the surrounding condition.
PDF Abstract XML References Citation
Received: March 13, 2014;
Accepted: April 24, 2014;
Published: June 25, 2014
How to cite this article
Effendi Tri Bahtiar, Arinana, Naresworo Nugroho and Dodi Nandika, 2014. Daily Cycle of Air Temperature and Relative Humidity Effect to Creep Deflection
of Wood Component of Low-cost House in Cibeureum-Bogor, West Java, Indonesia. Asian Journal of Scientific Research, 7: 501-512.
DOI: 10.3923/ajsr.2014.501.512
URL: https://scialert.net/abstract/?doi=ajsr.2014.501.512
DOI: 10.3923/ajsr.2014.501.512
URL: https://scialert.net/abstract/?doi=ajsr.2014.501.512
INTRODUCTION
Wood is like another material, made from infinite amount of atoms. Indeed wood is a solid material, its constituent atoms are never in steady state but always be vibrating and moving. The vibration and movement are influenced by environmental parameter fluctuation, thus the solid body (wood) will react to the environmental changes. As the material in general, wood will expand when heated and will contract when cooled. The amount of expansion or contraction of each one unit change in temperature is expressed by the coefficient of linear thermal expansion. In addition to temperature changes, changes in the dimensions of wood can be caused by relative humidity changes in the surrounding air. Wood is hygroscopic material, thus easily absorbs and releases water vapors. Wood moisture content is increasing at high relative humidity thus its dimension is swelling, whereas at low relative humidity wood releases its water content to the surrounding thus its dimension shrink. The fluctuation in surrounding temperature and humidity lead wood moisture content changes which in turn affect to its strength and stiffness. Dry wood is commonly stronger and stiffer than the wet one. Dimensional changing due to temperature and relative humidity affected to cross sectional area of wood beam which subsequently affecting to its moment of inertia. Dimensional expansion increases the moment of inertia, thus the beam will be more capable in resisting bending deflection.
Wood is more resistant in holding short term loading than long term loading. Long term loading create additional deformation which is called creep deformation. Total deformation in long term loaded wood beam is resultant of three components namely elastic deformation, delayed-elastic deformation and viscous deformation (Bodig and Jayne, 1982). Elastic deformation arises directly when the load applied and spontaneously recovered after unloaded; delayed-elastic deformation need more time to be recovered; while viscous deformation is residual deformation which become permanent even though the beam have been unloaded already. Creep deflection in wood beam is also influenced by its moisture content (Kretschmann, 2010), load level (Gowda et al., 1996; Leivo, 1992, Clouser, 1959; Hoffmeyer, 1990), load duration (Bazant and Meiri, 1985; Hoffmeyer, 1990), surrounding temperature and relative humidity (Aoki et al., 1998; Gowda et al., 1996; Leivo, 1992).
Effect of long term loading to beam deflection is commonly analyzed by creep testing. Creep testing should be conducted in steady state environmental parameter to avoid effect of temperature and relative humidity fluctuation (Aoki et al., 1998; Leivo, 1992), so it needs high energy and a special insulated room to meet this requirement. It is impossible to make the environmental condition become steady state in a regular room. The effect of temperature and relative humidity changes on creep deformation may calculated by mathematical equation in this research thus the creep testing could be conducted in regular room condition.
Temperature and relative humidity fluctuated in a day and repeated in the following day. The minimum temperature and maximum humidity are reached at several times after daybreak, whereas maximum temperature and minimum relative humidity are happened at several times after mid-day in a sunny day. There is time lag between solar radiation and earth surface reaction. Incoming solar radiation reaches its maximum at noon when the orientation of earth surface perpendicular to the sunrays, while the surface energy output is increasing all day long and decreasing throughout the night. Resultant of input solar radiation and output energy make temperature become maximum and minimum at afternoon and early morning, respectively. This phenomenon is repeated daily which created a closed loop of cycle. The wood dimension is changing when the surrounding air temperature and relative humidity change, thus the daily cycle of air temperature and relative humidity should be related to the additional deformation in wood creep testing. This study discussed the effect of daily cycle of temperature and relative humidity to creep deflection of wood component of low-cost housing in Cibeureum Village, Bogor, West Java-Indonesia. Sample was cut from roof component namely purlin which was chosen from 17 years old house.
METHODS
Creep testing was conducted for wood samples which cut from the purlin component of 17 years old low cost housing in Cibeureum Village, Bogor, West Java-Indonesia. The creep testing was conducted for 15 samples (3 replications for each load levels). The sample dimensions were 2x2x30 cm and applied by sustained load in center point loading bending configuration for 330 h. The span was 28 cm and the load levels for each sample were 10, 20, 30, 40 and 60 kgf. The deflection measurements were noted in every 30 min in the first night, 1 h in the next day, 2 h in the 2nd night, 3 h in the 2nd day, 4 h in the 3rd night and day and 6 h in the next rest periods. During the creep testing, the air temperature and relative humidity were measured. The creep testing was conducted in sheltered room which had natural air circulation. The air temperature and relative humidity data was plotted in Cartesian diagram with time as the absis and fitted by sinusoidal equation to create the best daily cycle model. The creep deflection data for each load level were fitted by logarithm of load duration and the sinusoidal function of daily cycle of air temperature and relative humidity, thus the effects could be calculated by t-student test.
RESULTS AND DISCUSSION
Model for daily cycle of air temperature and relative humidity: The air temperature and relative humidity are changing time by time during 24 h. There is different phenomenon of the fluctuation in the night and in the day. In a day time, the temperature and relative humidity fluctuation are influenced by direct sunrays radiation, while there is not any sunray during the night. At the night, temperature and relative humidity mainly be influenced by output energy of earth’s surface. During the night, the earth’s surface releases its calor energy which was absorbed during the day before the corresponding night. There is not any additional solar energy during the night, thus the air temperature will decrease after the sunset and the decrement continues until the early morning. The relative humidity is commonly related to the air temperature, thus it has similar daily cycle model. Based on the harvested data during this creep testing period, a sinusoidal model was developed Eq. 1:
| (1) |
Where:
| y | : | Temperature (°C) or relative humidity (%) |
| x | : | Time of measurement |
| k1 | : | Phase of sine wave equation |
| a, b | : | Constant and coefficient of regression |
| ε | : | Residual |
The phase of sine wave equation (k1) was calculated by iteration method based on Eq. 1 which minimizing the sum square of residual thus maximizing the coefficient of determination (R2). The k1 estimation was done used the data which measured during the night only in purpose to avoid the sunrays radiation effect. The graph of relationship between k and R2 was shown in Fig. 1a.
 | |
| Fig. 1(a-b): | |
As shown in Fig. 1a, the best estimations of the phase of sine equation model for earth surface energy effect to temperature and relative humidity were 7.45 and 3.1, respectively, thus the Eq. 1 could be modified become Eq. 2 for Temperature (T) and Eq. 3 for relative Humidity (H):
| (2) |
| (3) |
During daytime every day, the sunrays release solar radiation into the earth. The solar radiation gives additional calor energy to the earth’s surface thus the temperature increasing during daytime since early morning until late afternoon. Including the influence of solar radiation during the daytime, sinusoidal equation models were developed for daytime and night time (Eq. 4 and 5). Those equations were suitable within assumption that the earth surface absorbs calor energy during the daytime was in a similar quantity with the energy released during the night:
| (4) |
 | |
| Fig. 2(a-b): | Earth surface energy and sunrays radiation effect to the daily cycle of temperature and relative humidity, (a) Single and (b) Resultant effect |
| (5) |
A dummy variable (z) was applied for Eq. 4 and 5. The dummy variable represented the presence of solar radiation. Since there is not any solar radiation at night, the dummy variable value is 0 (zero) at the night and 1 (one) at the daytime. Similar as k1, estimation of k2 and k3 were done by iteration method which maximizing the coefficient of determination (R2) and the results were shown in Fig. 1b. As seen on Fig. 1b, the sine equations of sunrays radiation for both temperature and relative humidity had the same best estimated phase value that was 5.2. Then, the regression procedure was done and the equation results were Eq. 6 and 7. The Eq. 6 and 7 were drawn become Fig. 2:
| (6) |
| (7) |
The measurement of air temperature and relative humidity was conducted at 25 April-10 June 2013 in Bogor, West Java-Indonesia. During that period, the sunrise was at around 05:56 and the sunset was at around 17:45. Solar radiation was indirectly affected toward air temperature. There was time lag between sunrise and air temperature reaction. The air temperature and relative humidity started to react to sunrays radiation about 52 min after sunrise. The temperature was still decreasing in the morning thus the minimum temperature was reached at 52 min after sunrise (Fig. 2). Since the infrared radiation was absorbed by the air in very low level, the heat was generally transferred from earth’s surface to the air through conduction and convection mechanisms. Earth absorbed infrared radiation and converts it to thermal energy, thus its surface was warmer than the surrounding air. The heat was transferred by conduction process from the warmer earth to the cooler atmosphere which in contact with the surface. Air is not heat conductor material, so the convection mechanism warmed the rest of the atmosphere not in contact with the surface. The warmer air climbed up and then its place was replaced by the cooler one where it continued in the convection process. In addition to conduction and convection, the green house effects also play important role in increasing the air temperature: earth’s surface reflects some sunrays radiation which can be trapped and absorbed by atmosphere or reradiated back to the earth. All of those mechanisms delivered the time lag between sunrise and air temperature reaction. Soon after the sunrise, the sunrays radiation started. The earth surface was directly heated by the short wave sunrays radiation because short wave could easily penetrate to earth surface without much absorption by the atmosphere. Since the air didn’t absorb the short wave sunrays radiation, it need more time for air temperature to increase. The air temperature was still decreasing until 06:48. The sunrays radiation exceeded the earth surface energy release at 06:48 thus the minimum temperature was happened at that time.
The maximum effect of sunrays radiation was happened at 12:48 (Fig. 2a), but the maximum temperature was at 13:30 (Fig. 2b) when the resultant of sunrays radiation and surface energy reached its maximum. There was 42 min daily time lag between maximum sunrays radiation and air temperature. Since the sunrays radiation decreased after reached its maximum, the air temperature was decreasing until the sunset. Soon after the sunset, the air temperature was still increasing in a low rate because the earth surface energy release which was known as long wave radiation (infra-red) was still trapped in the atmosphere. This increment period was lengthen by the convection mechanism and will be ended at 22:30 when the night air temperature reached its maximum value and decreased afterwards. During the night, from 22:30 until 05:56 the air temperature was decreasing because the net radiation reached negative value. The earth surface released calor energy to the air while it didn’t absorb any sunrays radiation anymore. The earth surface became cooler. The warmer air near the earth surface was replaced by the cooler one from the above by convection mechanism because of the differences of its specific gravity. The fluctuation of this daily cycle of temperature was shown in Fig. 2b.
The relative humidity commonly had negative correlation with the air temperature especially during the daytime period when the fluctuation was mainly influenced by sunrays radiation. The curve for daily cycle of relative humidity was shown in Fig. 2b. Minimum relative humidity was happened almost at the same time when the air temperature reached its maximum. The time lag between minimum relative humidity and maximum temperature was only about 12 min. During the night the fluctuation of relative humidity was influenced by convection mechanism and released earth surface energy.
| Table 1: | Parameters of daily cycle of temperature and relative humidity according to Eq. 6 and 7 |
 | |
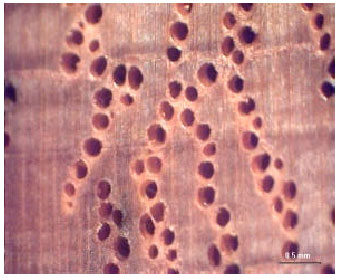 | |
| Fig. 3: | Saninten (Castanopsis sp.) Wood sample, identified from the anatomy of cross sectional area |
The cooler air which contains higher moist was flew down replacing the warmer one near the surface at the night. Maximum relative humidity was at 03:00. Some estimated parameter points of daily cycle of air temperature and relative humidity were shown in Table 1.
Wood identification: A small piece of wood from the purlin of 17 years old house was cut in order to identify its species. The macroscopic photograph with 30X zoom of wood cross sectional area was analyzed. As shown in Fig. 3, there were some key features which lead the wood identification into Saninten (Castanopsis sp.). The color was brownish yellow; there were two ray cells width; the parenchyma arrangement looked like the fish net and the pores were grouped in radial and diagonal arrangement. Comparing this features with photograph and description in code for wood identification in the field (Mandang and Pandit, 2002) it was concluded that the wood species was Saninten (Castanopsis sp.).
Saninten wood is commonly strong and moderately durable. According to Indonesian Code for Wood Building Construction (Peraturan Konstruksi Kayu Indonesia/PKKI NI-5 1961) (DPU, 1978) the average specific gravity value of Saninten wood is 0.76 and categorized in strength class II and durability class III. Takahashi and Kishima (1973) had conducted a graveyard test to identify the durability of 65 wood species from South East Asian and it was reported that the durability of saninten wood was categorized as resistant-moderately resistant (class 2-3). Saninten wood was widely used by Indonesian people for construction material such as purlin, rafters, beams, pole, or plank.
Creep testing: There are two types of deflection in wood beam which applied long term loading, namely initial and creep deflection. When the load applied to the beam, initial deflection occurred immediately. The time delay between load application and the resulted initial deflection is not virtually seen. Creep or long term deflections are time dependent deflection as the result of viscous flow (creep) under sustained load and wood reaction to the surrounding condition (moisture content, temperature and relative humidity). The material’s viscous flow of deflection under stress is called creep deflection. As with the time, the tension side and compression side of the beam gradually become longer and shorter, respectively. The shortening compression side and the lengthening tension side result a more value of curvature which magnify the deflections over time. Creep deflection in wood beam is also influenced by its moisture content. Kretschmann (2010) reported that green wood beam under sustained load may occur 4-6 times the initial deformation as it dries under load. The National Design Specification for Wood Construction (NDS) (AWC, 2012) addresses that there is estimated additional time-dependent deflection for wood beam under sustained load which is 1.5 times initial deflection for seasoned wood and 2.0 times of initial deflection for unseasoned wood. So, the total deflection in long term loaded beam design can vary from initial deflection to as much as three times the initial deflection.
Creep testing was conducted for 330 h. The deflections were measured during the creep testing and the data was analyzed by regression analysis based on Eq. 8 and the summary results were presented in Table 2:
| (8) |
Where:
| y | : | Deflection |
| x | : | Time of measurement |
| : | Daily cycle of temperature (Eq. 6) |
| Ĥ | : | Daily cycle of relative humidity (Eq. 7) |
| a, b, c, d | : | Constant and coefficient of regression |
| ε | : | Residual |
| Table 2: | Summary of regression analysis result based on Eq. 8 models |
 | |
 | |
| Fig. 4(a-c): | (a) Observed and estimated deflection of Saninten wood in creep testing, (b) Effects of load duration and (c) Effect of daily cycle of air temperature and relative humidity |
As seen on Table 2, beside the loading level, there were three other variables which significantly affected to the wood deflection on creep testing for each given load, namely load duration and daily cycle of air temperature and relative humidity. The observed data and estimated calculation were plotted in the graph in Fig. 4a. It was reasonable that the deflection curve for beam which resisted higher load level was above the lower ones (Fig. 4a). The higher load level applied to the beam would resulted more deflection value. This phenomenon was general characteristic of creep behavior regardless of the material type. Barbara (2000) conducted creep testing for hard fiberboard beam, chipboard beam and box section beam; Gowda et al. (1996) did creep testing for pine wood, spruce wood, glulam, Laminated Veneer Lumber (LVL) and I-beam; Leivo (1992) did creep testing for sawn timber, nail plate joints and trusses. They reported similar result that deflection on sustained loaded beam was higher for higher load level. Clouser (1959) reported that a load less than 45-60% of short-time ultimate load (calculated based on its modulus of rupture) didn’t cause failure in the beams during testing period. Hoffmeyer (1990) also reported: if the load level was kept bellow the proportional limit, the elasticity and strength did not influenced by long-term loading thus the failure due to creep should not occur. If the wood beam was applied by more than 60% of its short-time ultimate limit, the failure could be occurred. It needed more time for the lower load level to gain the failure of the beam than the higher one.
Load duration was significantly affected to the creep deflection. If the beam loaded by longer loading time, the creep deflection become higher as with the time. The creep deflection curved was following the logarithm function of load duration (Fig. 4b). The rate of increasing of creep deflection became lower for longer period of loading. Some researchers also found the similar report. Bazant and Meiri (1985) found that the strain of spruce wood in creep testing was fitted by time function in logarithm scale. Hoffmeyer (1990) also noted that stress level until failure had a linear relation with time in logarithm scale according to Madsen study in 1947 and 1951. These curves were called “The Madison Curve” and still widely used today to describe the long-term behavior of wood in sustained load. The logarithm scale of time was also found in this study. Figure 4b showed that the effect of load duration in creep testing on Saninten wood samples were in logarithm scale of load duration. As seen on Table 2, the logarithm of load duration significantly influenced to the creep deflection of all samples. The creep deflection increased in a slower rate over time.
The creep deflection curves in Fig. 4a were not smooth. There were daily fluctuations of the creep deflection. These fluctuations were caused by the daily cycle of air temperature and relative humidity. As seen on Table 2, the daily cycle of temperature and relative humidity significantly affected to the creep deflection. This phenomenon matched with all of the load levels, except for the highest level (60 kgf). Effects of daily cycle of air temperature and relative humidity were graphed in Fig. 4c. There were additional deflections as the effect of air temperature and relative humidity fluctuations. At around 06.08, when the air temperature reached its minimum, the deflections were in minimum value. As the sunrays radiation started heating the earth surface, the air temperature slowly increased and the deflection began to increase too. The maximum values of temperature and relative humidity related deflection were happened approximately at 16.45. It was about three hours after the maximum temperature and minimum relative humidity. From 16.45-18.48 there was a small change in additional deflection due the small increasing of air temperature because the long wave energy was still trapped in the atmosphere; meanwhile, the relative humidity was increasing. The superposition of increasing air temperature and increasing relative humidity in the surrounding caused the wood beam additional deflection almost in steady state condition during this period (16.45-18.48) because temperature commonly had opposite effects to the creep deflection compared to relative humidity. Wood creep deflection had positive correlation with its surroundings air temperature while it had negative correlation with relative humidity. During the night (18.48-03.00), the deflection was decreased in higher rate because the temperature was decreasing and the relative humidity was increasing. At 03.00-05.56 the decreasing rate of deflection was lower than before because the relative humidity began to decrease.
Fluctuations in the surrounding temperature and relative humidity greatly affected to the rate and total creep deformation due the changes in the moisture content of the wood. Aoki et al. (1998) reported an accelerated testing of the drying cycle using pressure reduction equipment. Aoki et al. (1998) conducted the creep testing in strictly controlled environmental chamber to perform the accelerated cycle of temperature, relative humidity and dew condensation. According to this report, the beam deflection caused by 25% of its fracture load was increases approximately 10 times the amount of initial deflection. Creep deformation of beam can be considerable due the repeated moisture and drying which is caused by humidity and temperature changes, even when the applied load is small. Leivo (1992) also conducted one year creep testing in two constants relative humidity (30 and 90%) and it was reported some conclusion i.e., (1) The variations in humidity have a greater effect than load duration did on the creep of the nail plate joint, (2) The creep of sawn timber in fluctuated humidity are higher than in constant conditions. Gowda et al. (1996) had conducted a long term wood creep testing which carried low load level (2-7 MPa) in heated and non-heated (sheltered) environments. The data was collected in three years during 1992-1995 and it was reported that the relative creep in heated room is lower than in the shelter. The natural temperature fluctuations in sheltered environment contributed to the additional creep deflection, while in the heated room the temperature were maintained to be constant thus there was not any additional deflection. Compared to the other researches above, this study proposed the evaluation on daily fluctuation of temperature and relative humidity effect to the creep deflection by mathematical equation while the other researcher prefer to maintain the creep testing in controlled room. This study succeeded determining the effect of temperature and relative humidity toward creep deflection in regular room condition without controlling the surrounding condition.
CONCLUSION
The fluctuations of air temperature and relative humidity were influenced by sunrays radiation and earth surface energy which cyclically repeated every day. The sinusoidal equation model developed in this study satisfactory fitted the daily cycle of relative humidity (R2 = 62.09%), but the best sinusoidal equation for the daily cycle of air temperature had low coefficient of determination (R2 = 19.28%). The wood which was tested in this study was identified as Saninten species. The wood creep testing in non-treated natural environment room showed that all of measured variables in this study namely logarithm of load duration and daily cycle of relative humidity and air temperature were significantly affected to the creep deflection for most load level. The creep deflection increased by the time following the logarithm function of load duration. Relative humidity had negative correlation with additional creep deflection while air temperature had positive correlation. Total additional creep deflection was superposition of those two effects. Multiple regression with logarithm transformation for load duration and sinusoidal transformation for temperature and relative humidity succeed estimating the fluctuation of empirical creep deflection of wood for each load level (R2 = 82.52 - 96%).
ACKNOWLEDGMENT
The authors thank to the Directorate General of Higher Education, Ministry of National Education-The Republic of Indonesia which gave permission and support to conduct this study.
REFERENCES
- AWC, 2012. ASD/LRFD Manual: National Design Specification® for Wood Construction. American Wood Council, New York, USA., ISBN: 978-0-9827380-6-1, Pages: 110.
Direct Link - Bazant, Z.P. and S. Meiri, 1985. Measurements of compression creep of wood at humidity changes. Wood Sci. Technol., 19: 179-182.
CrossRefDirect Link - Takahashi, M. and T. Kishima, 1973. Decay resistance of sixty-five Southeast Asian timber specimens in accelerated laboratory tests. Tonan Ajia Kenkyu/South East Asian Stud., 10: 525-541.
Direct Link