
Siwatt Pongpiachan
SKLLQG, Institute of Earth Environment, Chinese Academy of Sciences, Xi�an, 710075, China
Kin Fai Ho
SKLLQG, Institute of Earth Environment, Chinese Academy of Sciences, Xi�an, 710075, China
Junji Cao
SKLLQG, Institute of Earth Environment, Chinese Academy of Sciences, Xi�an, 710075, China
Asian Journal of Applied Sciences
Year: 2014 | Volume: 7 | Issue: 5 | Page No.: 360-374


ABSTRACT
Carbonaceous compositions, water-soluble ionic species and trace gaseous species were identified and quantified in Hat-Yai city, Thailand. All samples were collected every 3 h consecutively from 21 h December 17th to 21 h December 20th at Site 1 (30 m agl), Site 2 (60 m agl) and Site 3 (125 m agl). The averaged concentration of OC was significantly higher at the Site 1 than those detected at Site 2 and 3 suggesting that anthropogenic activities at ground level might play a major role in governing air quality at ground level. The morning peak of carbonaceous compositions observed during the sampling period of 6-9 emphasized the main contribution of traffic emissions on OC/EC contents in Hat-Yai city. In this study, it was found that aged maritime aerosols from long-range transportation and/or biomass burning particles overwhelmed carbonaceous aerosols at the top of building. Whilst hierarchical cluster analysis and Pearson correlation analysis show some considerable influences of night-time tourism activities on carbonaceous contents at ground level, principal component analysis highlights the impacts of maritime aerosols, biomass burning and possibly agricultural waster burning particles at higher atmospheric layer.
PDF Abstract XML References Citation
Received: December 03, 2013;
Accepted: April 13, 2014;
Published: May 30, 2014
How to cite this article
Siwatt Pongpiachan, Kin Fai Ho and Junji Cao, 2014. Effects of Biomass and Agricultural Waste Burnings on Diurnal Variation and Vertical Distribution of OC/EC in Hat-Yai City, Thailand. Asian Journal of Applied Sciences, 7: 360-374.
DOI: 10.3923/ajaps.2014.360.374
URL: https://scialert.net/abstract/?doi=ajaps.2014.360.374
DOI: 10.3923/ajaps.2014.360.374
URL: https://scialert.net/abstract/?doi=ajaps.2014.360.374
INTRODUCTION
Carbonaceous aerosols, generally recognized as Organic Carbon (OC) and Elemental Carbon (EC) particles, have been intensively studied in the past decades because these atmospheric particles offer a wide range of impacts on both health and climate system (O’Brien and Mitchell, 2003; Penner et al., 1996; Shih et al., 2008). Carbonaceous aerosol is detrimental to human health, according to recent study on effects of fine carbonaceous particles containing high and low unpaired electron spin densities on lungs of female mice (Repine et al., 2008). As a consequence of concern over their existence in the atmospheric environment, several studies were conducted to investigate its influences on gas-particle partitioning of carcinogenic and/or mutagenic substances such as polycyclic aromatic hydrocarbons (PAHs), polychlorinated biphenyls (PCBs), polychlorinated dibenzo-p-dioxins and dibenzofurans (PCDD/Fs) and pesticides (Dachs and Eisenreich, 2000; Kaupp and McLachlan, 1999; Schummer et al., 2010; Simcik et al., 1998). These carbon-containing compounds are often referred to as Persistent Organic Pollutants (POPs) that are persistent to photochemical degradation, biological decomposition and chemical reactions (Jones and Voogt, 1999).
According to circumstances, there have been a growing number of studies focusing on the analysis of chemical compositions of carbonaceous aerosols collected at observatory sites around the world (Cao et al., 2004; Han et al., 2008; Na et al., 2004; Ram et al., 2008). During the last decade, more studies are concentrating on the application of OC/EC ratio as an indicator of primary and secondary carbonaceous particles (Pio et al., 2011; Yu et al., 2004; Zeng and Wang, 2011). In spite of the presence of numerous scientific publications regarding the diurnal variation of carbonaceous aerosols (Bhugwant et al., 1999, 2001; Grivas et al., 2012; Temesi et al. 2003), only a limited number of studies have been undertaken to simulate the vertical distribution of particulate OC/EC in the urban atmosphere (Minvielle et al., 2004; O’Brien and Mitchell, 2003). Furthermore, the knowledge of OC/EC compositions in tropical aerosols is extremely rare. According to our best knowledge, there are only three studies under the topic of carbonaceous aerosols in Thailand collected at Phimai (central Thailand, Nakhon Ratchasima province), Hat-Yai city (southern region, Songkhla province) and Bangkok metropolitan (Li et al., 2013; Pongpiachan et al., 2009; Sahu et al., 2011). Unfortunately, there is no peer-reviewed paper published in international journals regarding both the vertical distribution and diurnal variation of OC/EC compositions in southern atmosphere of Thailand. Additionally, the impact of maritime aerosols on diurnal variation of carbonaceous aerosols in Southeast Asia has not been well investigated. Overall, the major aims of this research are to intensively evaluate the diurnal variations and vertical distributions of carbonaceous aerosols collected at the city center of Hat-Yai. Air samples were collected every 3 h for three days at three different levels (i.e., Site 1: 30 m; Site 2: 60 m; Site 3: 125 m above the ground level) at Novotel Centara Hat-Yai Hotel (Site 1) and Lee Gardens Plaza Hotel (Site 2 and 3) in December 17th-20th, 2007. Diurnal variation and vertical distribution of carbonaceous compositions in PM10 will be further discussed in detail.
METHODOLOGY
Sampling sites: It is well known that Hat-Yai is the largest metropolitan area in southern part of Thailand with a population of 157,359 (2008) in the city itself, occupying an area of 7,393 km2 on the eastern side of the Malaysian Peninsula. Hat-Yai is a business city located in the southern part of Thailand (7°1'N 100°28'E) adjacent to the Malaysian border, approximately 30 km away in the south of Gulf of Thailand. Hat-Yai is the largest city of Songkhla province, the largest metropolitan area in southern and third largest metropolitan area of the country. Although, the air quality levels in Hat-Yai are categorized as satisfactory in normal condition, the atmospheric concentrations of air pollutants exceeded the national air quality standard as a consequence of trans boundary pollution from uncontrollable forest fire in Indonesia (Quah, 2002) (Fig. 1). Hat-Yai city is categorized as tropical monsoon climate (Type Am) based on the Köppen climate classifications, with the 30 year average highest and lowest recorded temperature of 32.3°C (90.1°F) and 22.9°C (73.2°F), respectively. The 30-year average precipitation was recorded as 134.5 mm. Two observatory stations, namely Novotel Centara Hat-Yai Hotel (7°00'20.65"N 100°28'15.65"E) and Lee Gardens Plaza Hotel (7°00'21.39"N 100°28'15.94"E), were located in the center of Hat-Yai city encompassed by schools, business buildings including cloth and snack shops in Kim Yong market.
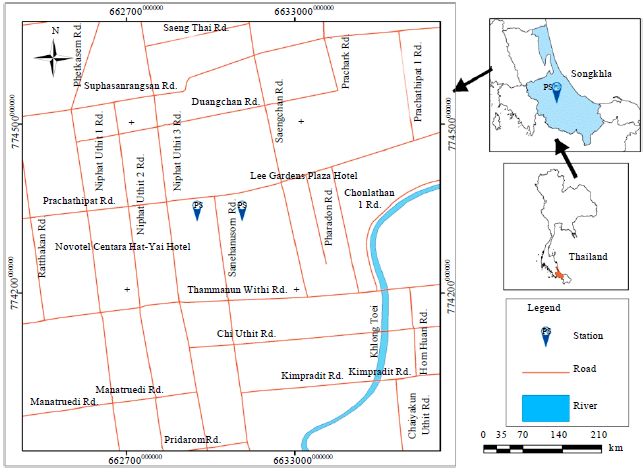 | |
| Fig. 1: | Description of air sample observatory sites |
Three different measurement sites were prudently selected according to its elevation. Site 1 was placed at Novotel Centara Hat-Yai Hotel at 30 m above building basement, whilst Site 2 and 3 were positioned at Lee Gardens Grand Plaza Hotel at 60 and 125 m above the ground level, respectively. Intensive monitoring campaigns were performed at all measurement sites concurrently from December 17th-20th 2007 in winter. The PM10 samples were collected every 3 h consecutively from 21 h December 17th to 21 h December 20th by using Graseby-Andersen High Volume Air Sampler. More detailed description of the air sampling method was provided in “Compendium Method IO-2.2. Sampling of ambient air for PM10 using an Andersen Dichotomous Sampler”.
Filter sample collection and meteorological data: In this study, Graseby-Anderson high volume air sampler (PM10-TE6001) was used to collect PM10 samples every 3 h consecutively with the flow rate of 1.132 m3 min-1. To avoid any contaminations, tweezers and aluminum foils were cleaned by dichloromethane (DCM) prior to use. All quartz fiber filters (47 mm Whatman quartz microfibre filters (QM/A)) were weighed gravimetrically on a microbalance Mettler Toledo AB204-S (Columbus (Ohio), USA) before and after sampling to quantify PM10 mass load. It is also worth to mention that all filters were pre-heated to 800°C for 3 h prior to use to avoid any potential contamination. During the intensive monitoring campaign, all filters were kept in refrigerator at 4°C to minimize the loss of volatile organics during sample preservation. Meteorological data including barometric pressure, temperature, humidity, rainfall, wind speed and direction, UV/solar radiation have been collected at all sampling sites on an hourly basis by using a cabled weather station with a versatile sensor suite, Davis Vantage Pro2. The positive sampling artifacts caused by adsorption of gas-phase carbonaceous components onto the filters during and/or sample collection was investigated by using field blank filters. However, the negative sampling artifacts due to the loss of volatile carbonaceous particles were not determined in this study. In addition, the vertical atmospheric temperature, pressure, relative humidity and wind speed profiles were monitored every six hours by using weather balloon coupled with radiosonde and carefully analyzed by research staff from meteorological department of Thailand.
OC/EC analysis: Procedures for OC/EC analysis including calibrations and QA/QC were conducted at the laboratory of the Department of Civil and Structural Engineering, Research Centre for Urban Environmental Technology and Management, The Hong Kong Polytechnic University, China. These procedures are essentially the same as described earlier by Cao et al. (2003). Generally, OC and EC were defined as sum of OC fractions and EC fractions (OC1+OC2+OC3+OC4) and EC fractions (EC1+EC2+EC3+OP) individually, based on the Interagency Monitoring to Protect Visual Environments Total Organic Carbon protocol (IMPROVE TOC) (Chow et al., 1993, 2001; Fung et al., 2002).
Trace gaseous and water soluble ionic species analysis: The CO Analyzer Model 300E (Teledyne Technologies Incorporated, USA) was selected to analyze ambient CO concentration in this study. Several features such as “microprocessor controlled for versatility”, “multi-tasking software for viewing test variables during operation” and “temperature and pressure compensation” were included in the instrument. The instrumental sensitivity for CO determination ranges from 0-1 ppm to 0-1,000 ppm with the instrumental detection limit of 0.04 ppm. The UV adsorption O3 Analyzer Model 400 E (Teledyne Technologies Incorporated, USA) provides analytical ranges of monitoring ozone of 0-100 ppb to 0-10 ppm with the instrumental detection limit of 0.6 ppb. Using the chemical characteristic of ozone which absorbs UV light, performed the calculation of ozone concentration. A chemiluminescence NO/NO2/NOx Analyzer Model 200E coupled with state-of-the-art microprocessor technology (Teledyne Technologies Incorporated, USA) was employed to monitor NO-NO2-NOx in this study. The analytical capability of Model 200E ranges from 50 ppb to 20 ppm with the instrumental detection limit of 0.4 ppb. Three-hour Water-Soluble Ionic Species (WSIS) in PM10 were also measured during the monitoring campaign.
RESULTS AND DISCUSSION
Diurnal variation of OC and EC: Diurnal variation of three-hourly PM10, TC, OC and EC are displayed in Table 1 and represent monitoring period of three days.
| Table 1: | Statistic description of concentrations of carbonaceous species and its percentage contribution in PM10 collected at Hat-Yai city |
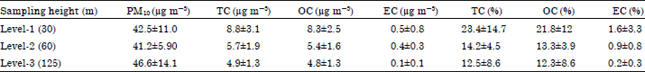 | |
During this observation period, the correlation coefficients (R) between OC and EC were highest at Site 1 (R = 0.80) followed by Site 2 (R = 0.60) and Site 3 (R = 0.070), respectively. The altitude decreasing pattern of R can be explained by numerous factors. Firstly, the photolysis and heterogeneous chemical reactions with trace gaseous species can be interpreted for this consequence. Since, there were no significant differences (p<0.05) between solar radiation measured at Site 1 (109.3±149.9 W m-2) vs. Site 2 (98.7±115.9 W m-2) and Site 2 vs. Site 3 (145.6±183.9 W m-2), it would be safe to assume that photolysis activities play a minor role in oxidizing carbonaceous aerosols and thus altering OC-EC correlations at higher altitude. Secondly, wind speed might influence the correlations between OC and EC due to the fluctuations in magnitude of dispersion occurred in different altitudes. Significant differences of wind speed (p<0.001) found in Site 1 (2.5±0.55 m sec-1) vs. Site 2 (3.5±0.94 m sec-1) and Site 2 vs. Site 3 (1.6±0.46 m sec-1) support this idea. Thirdly, the strength of individual emission sources varied with wind direction. Hence, significant differences of wind direction (p<0.001) detected at Site 1 (252±17°) vs. Site 2 (100±11°) and Site 2 vs. Site 3 (152±50°) emphasize the importance of emission sources on variation of R-values.
As illustrated in Fig. 2, the maximum OC and EC concentrations were detected during the observation period of 21:00-00:00 on 17/12/2007 at Site 1 when Hat-Yai city showed the highest vehicular density at these peak hours. Since, observatory sites are surrounded by restaurants and encompassed by night markets, it appears plausible to ascribe the highest content of carbonaceous aerosols from 21:00-00:00 as a mixture of traffic originated air pollutants. The overall declination of carbonaceous contents of all sampling sites was prominent after midnight of 17/12/2007. This can be explained by some small contributions of wet-depositions caused by irregular light shower rain occurred during the three days of monitoring campaign. The morning peak of OC and EC found during the sampling period of 06:00-09:00 reflected the crucial role of vehicular exhausts on carbonaceous contents in Hat-Yai city.
OC/EC ratios: Overall, the average OC/EC ratios observed in this study were 16.2±3.1, 13.5±4.0 and 48.0±13.0 for site 1-3, respectively. Site 3 averaged OC/EC ratio was significantly three times higher than those of Site 1 and 2 with the confidence level of 95%. These three-day averaged OC/EC ratios all were much higher than those of 1.1±0.9, 2.2, 2.4±1.1, 2.5, 2.6 and 2.9±2.7 detected at Chongju, South Korea (Lee and Kang, 2001), Thessaloniki, Greece (Terzi et al., 2010), Zhuhai, China (Cao et al., 2003), Beijing, China (He et al., 2001), Borgerhout, Belgium (Vercauteren et al., 2011) and Xi’an, China (Cao et al., 2005), respectively but somewhat close to the average ratio of 14.4±3.5 reported for Kosan, Korea (Kim et al., 2000). The existence of extremely high OC/EC ratios observed in Hat-Yai city can be interpreted as a consequence of the relatively low EC background in the coastal atmosphere coupled with the formation of Secondary Organic Carbon (SOC) during the long range transportation of maritime aerosols. It is also worth to mention that biomass and agricultural residue burnings play a significant role in enhancing the OC/EC ratios as previously mentioned in several reports (Cao et al., 2007; Goncalvesa et al., 2011; Pongpiachan et al., 2009). Since, Hat-Yai city is surrounded by numerous para-rubber sheet factories, it seems rationale to attribute the relatively high OC/EC ratios as a result of emissions derived from biomass-fired utilities using during the manufacturing process. It is also crucial to stress that open burning of rice straw after harvesting is a common practice in Thailand and other Asian countries and thus to some extent enhance the OC/EC ratios. In addition, the relative high OC/EC ratios detected at agricultural area of Korea, Kosan, support these interpretations.
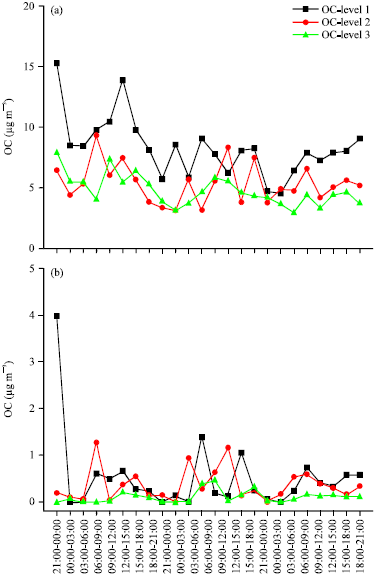 | |
| Fig. 2(a-b): | Diurnal variation of (a) OC and (b) EC in PM10 collected at Hat-Yai from 17/12/07 to 20/12/07 |
Impact of aerosol types on variation of SOC: Because of the geographic configuration of Hat-Yai city which possesses more than 50% of the surface area adjacent to coastal lines, it is curious to investigate the impact of maritime aerosol on the variation of carbonaceous compositions. For decades, the chemical characteristics of water-soluble ionic species in aerosols have been intensively studied in various parts of the world. Despite of differences in both meteorological constraints and emission sources, several studies concluded that Cl¯ and SO42¯ are major contributors of WSIS mostly found in maritime aerosols whilst K+ and NH4+ have tended to be the main compositions of those particles originated from biomass and agricultural waste burnings (Allena et al., 2004; Kocaka et al., 2007; Matsumoto et al., 1998; Osada et al., 2002; Park and Cho, 2011). Since, particulate NO3¯ is a good indicator of those aerosols derived from traffic emissions and other imperfect combustions of fossil fuels, one can take advantage of binary ratios between maritime and biomass burning WSIS to traffic exhaust originated NO3¯ to classify aerosol types. In order to categorize various types of air masses, the ratios of Cl¯/NO3¯, SO42¯/NO3¯, K+/NO3¯ and NH4+/NO3¯ were carefully employed by using the concept of outlier (i.e., the values lie within two standard deviations of the mean). For instance, those outliers of Cl¯/NO3¯, SO42¯/NO3¯, K+/NO3¯ and NH4+/NO3¯ can be considered as represents of maritime aerosols, biomass burning and agricultural waste burning particles, respectively.
Further estimation of secondary organic carbon in Hat-Yai PM10 was performed by using the concept of Na et al. (2004). The idea is based on the assumption that samples having the lowest OC/EC ratios contain almost exclusively primary carbonaceous compounds (Castro et al., 1999). For this study, OC/EC ratios of 6.0, 6.8 and 12.6, (the average of the three lowest OC/EC ratios), were employed to estimate the Secondary Organic Carbon (SOC) content of Hat-Yai PM10 at Site 1-3 sampling sites, respectively. The concentration of secondary Organic Carbon (OCsec) can be estimated using the subsequent equation:
| (1) |
where, (OC/EC)primary is the average value of the three lowest OC/EC ratios and OCtot is the total organic carbon.
By employing Eq. 1 to compute OCsec contents in Hat-Yai PM10, the percentage contributions of OCsec to OCtot were found to be 67.8±23.0, 56.7±27.6 and 66.8±23.2% for Site 1, 2 and 3, respectively. The total average value of OCsec at all levels was 63.8±24.6%. This average value is approximately 1.6 and 3.8 times higher than those observed in Kaohsiung (40.0%, Lin and Tai, 2001) and Birmingham, UK (17%, Castro et al., 1999), respectively but similar to those detected in Claremont, US PM2.5 (65%, Na et al., 2004).
As clearly illustrated in Table 2, the estimated percentage contributions of OCsec as categorized in maritime aerosol group by using the binary ratios of Cl¯/NO3¯ and SO42¯/NO3¯ are approximately 1.44 times higher than those of none-maritime aerosol group at the confidence level of 95%. Correspondingly, biomass burning originated aerosols as defined by the binary ratio of K+/NO3 is significantly 1.38 times higher than those of non-biomass burning group. In addition, the calculated percentage contribution of OCsec which is classified in agricultural waste burning aerosol group by applying the binary ratios of NH4+/NO3¯, is 1.33 times higher than those of non-agricultural waste burning group.
| Table 2: | Percentage contributions of carbonaceous compositions in maritime, terrestrial and biomass-burning aerosols as categorized by using the ratios of Cl¯/NO3¯, SO42¯/NO3¯, K+/NO3¯ and NH4+/NO3¯ |
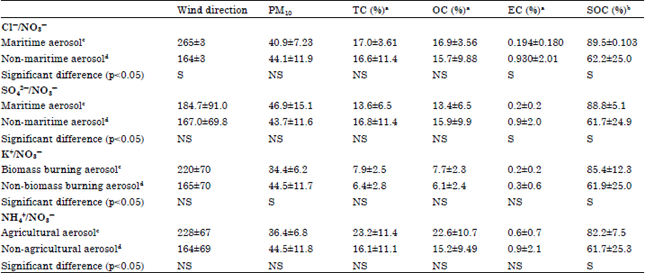 | |
| aPercentage of carbonaceous compositions in PM10, bPercentage mass of SOC in OC, cValue higher than the average plus two times of standard deviations, dValue lower than the average plus two times of standard deviations | |
Overall, this indicates the highly complicated mechanisms of SOC formation in the atmospheric environment of Hat-Yai city.
Correlation and cluster analysis: An average linkage (rescaled distance cluster combine) mode Hierarchical Cluster Analysis (HCA) was applied to the data matrix composed of 24 samples and 17 meteorological and chemical variables for all sampling sites. The construction of HCA includes 24 members which represent the sample collected at each sampling period (i.e., sample 1 for monitoring period of 21:00-00:00, 17/12/07 and sample 2 for monitoring period of 00:00-03:00, 18/12/07). The first cluster contains an association of sample 1, 2, 3, 8, 9, 10, 17, 18, 19, sample 1, 2, 3, 8, 9, 11, 16, 17, 18, 19, 24 and sample 1, 2, 3, 8, 9, 10, 11, 16, 17, 18, 19, 24 for Site 1, 2 and 3, respectively (Fig. 3a-c).
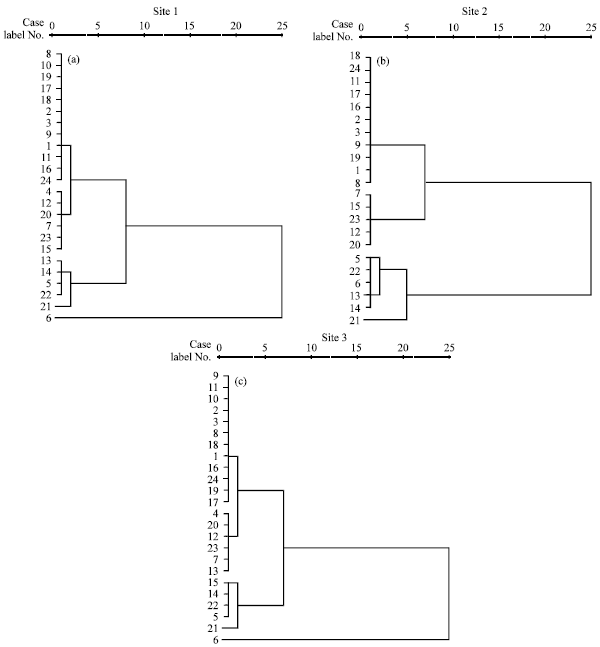 | |
| Fig. 3(a-c): | Hierarchical dendrogram of meteorological and chemical variables collected at (a) Site 1, (b) Site 2 and (c) Site 3 |
This distribution pattern reflects the impact of traffic emissions during the monitoring period of 18:00-21:00, 21:00-00:00 and 00:00-03:00 suggesting that nighttime tourism activities crucially play a major role in governing the air quality of Hat-Yai city. The second cluster which includes sample 4, 7, 12, 15, 20, 23 for Site 1, sample 7, 12, 15, 20, 23 for Site 2 and sample 5, 7, 13, 14, 15, 22 for Site 3, appears to be a group of samples associated with daytime anthropogenic activities, like release by vehicular exhausts, fossil fuel combustions from industrial activities, biomass and agricultural waste burnings. For Site 3, the association of sample 4, 12, 20 and 21 characterizes the third cluster. This last cluster indicates the morning activities (06:00-09:00) possibly related to the traffic emissions during the rush hour.
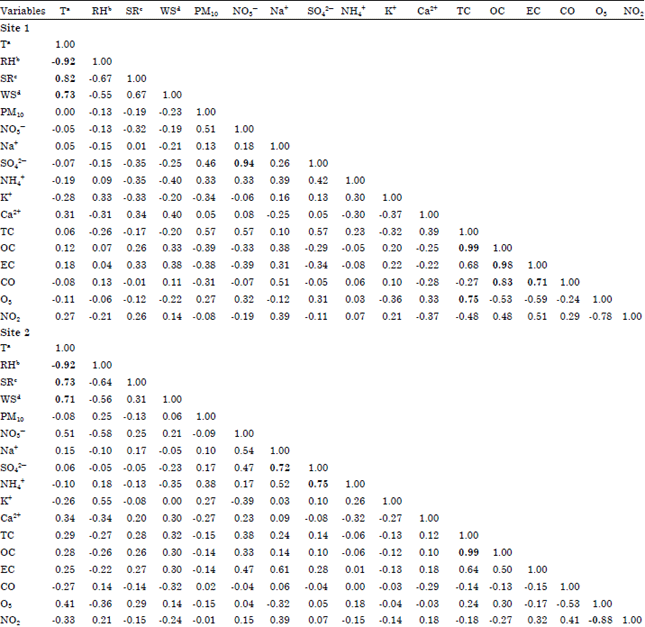
The strong Pearson correlation coefficients between TC and OC were observed at all altitudes with the R-values of 0.99 at all observatory sites (Table 3).
| Table 3: | Pearson correlation coefficients of meteorological parameters and chemical compositions in PM10 collected at Site 1-3 |
  | |
| aTemperature, bRelative humidity, cSolar radiation, dWind speed. Bold No. represents R-value higher than 0.70 | |
This emphasizes that carbonaceous compositions are overwhelmed by OC at all sampling altitudes and the contribution of EC can be considered as a minor of importance during the monitoring period. The relatively high correlation coefficients of SO42¯ vs. NO3¯ (R = 0.94), OC vs. CO (R = 0.83) and EC vs. CO (R = 0.71) measured at Site 1 emphasize the major influence of vehicular exhausts at ground level. On the contrary, the considerably strong correlations of SO42¯ vs. NH4+ (R = 0.75) and SO42- vs. Na+ (R = 0.72) indicate a shift in origin of sampled air to other non-vehicular sources, as also indicated in the change of wind distribution pattern observed at Site 2 (Fig. 4). Indeed, it may be seen that during the observatory period, most air samples of Site 2 originate from the east-to-southeast, whilst Site 1 exhibits the majority of air masses from west-to-southwest wind sectors.
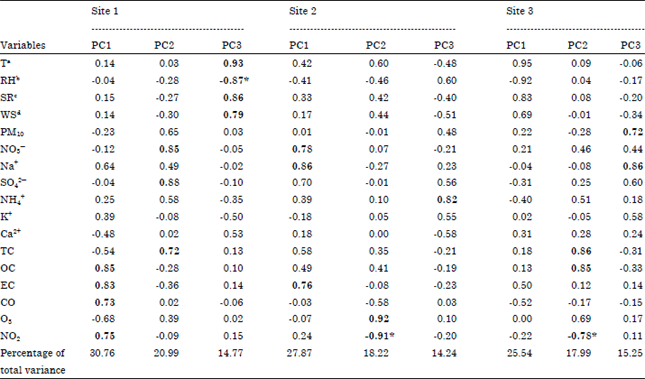
Principal component analysis: Table 4 displays the principal component patterns for Varimax rotated components of the carbonaceous composition data set at all sampling sites, coupled with WSIS and meteorological parameters. In order to enable further investigation of possible OC/EC emission sources at Site 1, a PCA model with three significant PCs, each representing 31, 21 and 15% of the variance, thus accounting for 67% of the total variation in the data, was computed. The first component (PC1) shows high loading on OC, EC, CO and NO2 with the correlation coefficients of 0.85, 0.83, 0.73 and 0.75, respectively. Since, urban area is a major source of CO and NO2 and thus the positive loading of these trace gaseous species coupled with OC and EC observed in PC1 can be attributed to vehicular exhausts. Significant positive correlations of TC, NO3¯, SO42¯ and PM10 were observed in PC2 indicating that vehicular road dust particles which were immediately conveyed to receptor close to ground level and/or soot particles emitted by and/or soot particles emitted by cooking fire from Chinese restaurants (i.e., wood combustion) are probably two main sources found in Site 1-PC2. There is no correlation between meteorological parameters and carbonaceous compositions which might imply that Site 1 is mainly governed by vehicular emissions rather than meteorological factors.
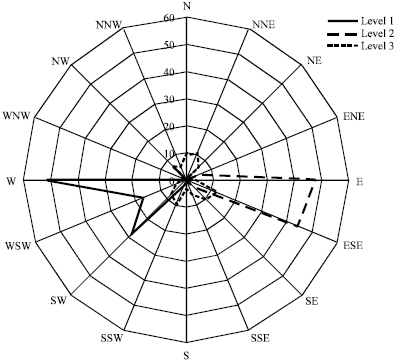 | |
| Fig. 4: | Percentage contributions of wind directions in Hat-Yai from 17/12/07 to 20/12/07 |
| Table 4: | Principal component analysis with Varimax rotation using meteorological parameters with carbonaceous compositions and other chemical parameters in PM10 collected at Site 1-3 |
 | |
| aTemperature, bRelative humidity, cSolar radiation, dWind speed. Bold No. represents R-value higher than 0.70 | |
A similar PCA was performed for Site 2 (Table 4). Three components were identified from the principal component matrix each representing 28, 18 and 14% of the variance, thus accounting for 60% of the total variance. PC1 shows high loading on Na+ (R = 0.86) followed by moderate loading on NO3¯ (R = 0.78), EC (R = 0.76) and SO42¯ (R = 0.70). Na+ is a typical biomarker of sea-salt aerosols whilst SO42- may have originated from both maritime and biomass burning aerosols. Hence, the relatively high loadings of EC coupled with Na+, SO42¯ and NO3¯ in PC1 can be attributed to both local traffic emissions and long-range transportation across over the sea. On the other hand, the principal component patterns for Varimax rotated components of Site 3 composed of three components which account for 59% for the variance. These represent similar variance with those seen for Site 1 and 2 and moreover PC1 (26% of variation) is almost identical to those of Site 2 (28% of variation) and Site 3 (31% of variation). The negative loadings on NO2 (R = -0.78) and positive loadings on TC (R = 0.86) and OC (R = 0.85) were observed in Site 3-PC2 which might imply that carbonaceous compositions detected in PC2 is probably originated from non-vehicular sources. It is also worth to mention that EC is to some extent positively correlated to air temperature (R = 0.95), solar radiation (R = 0.83) and wind speed (R = 0.69) but negatively associated to relative humidity (R = -0.92) as displayed in PC1. It would be reasonable to assume that an increase in wind velocity during the daytime promotes re-suspension of soot dust particles and light shower rain can significantly reduce EC contents during the observatory period.
CONCLUSION
An important day-to-night difference in the magnitude of tourism activities might have explained the large discrepancy observed between day and night time of carbonaceous composition levels in PM10 samples during the monitoring period. Despite of its moderate level of OC and EC contents, Hat-Yai PM10 contains relatively high OC/EC ratios indicating the strong influence of either aged particles derived from long-range transportation and/or biomass and agricultural waste burning aerosols. While traffic emissions play a major role in governing carbonaceous contents at ground level, wind speed and emission source type significantly influence OC and EC levels at higher altitudes. The concept of binary ratios using WSIS highlights the contribution of both maritime and biomass/agricultural waste burning aerosols on formation of SOC at the Southern coastal city of Thailand.
ACKNOWLEDGMENT
This study was performed with the approval of National Research Council of Thailand (NRCT). Also with acknowledged support from Institute of Earth Environment, Chinese Academy of Sciences (IEECAS) and National Institute of Development Administration (NIDA). The authors acknowledge Dr. Surat Bualert and Ms. Teeta Intasaen for their contributions on filed sampling and laboratory works.
REFERENCES
- Allen, G.A., A.A. Cardoso and O.G. da Rocha, 2004. Influence of sugar cane burning on aerosol soluble ion composition in Southeastern Brazil. Atmos. Environ., 38: 5025-5038.
CrossRefDirect Link - Bhugwant, C., M. Bessafi, E. Riviere and J. Leveau, 2001. Diurnal and seasonal variation of carbonaceous aerosols at a remote MBL site of La Reunion Island. Atmos. Res., 57: 105-121.
CrossRefDirect Link - Bhugwant, C., C. Helene, P. Bremaud, R. Stephane and J. Leveau, 1999. Diurnal variation of ozone due to chemical reactions on carbonaceous aerosols: Measurements and simulations at a tropical site. J. Aerosol Sci., 30: S533-S534.
Direct Link - Cao, J.J., S.C. Lee, K.F. Ho, X.Y. Zhang and S.C. Zou et al., 2003. Characteristics of carbonaceous aerosol in Pearl River Delta Region, China during 2001 winter period. Atmos. Environ., 37: 1451-1460.
CrossRefDirect Link - Cao, J.J., C.S. Lee, F.K. Ho, C.S. Zou and K. Fung et al., 2004. Spatial and seasonal variations of atmospheric organic carbon and elemental carbon in Pearl River Delta Region, China. Atmos. Environ., 38: 4447-4456.
CrossRefDirect Link - Cao, J.J., F. Wu, J.C. Chow, S.C. Lee and Y. Li et al., 2005. Characterization and source apportionment of atmospheric organic and elemental carbon during fall and winter of 2003 in Xi'an, China. Atmos. Chem. Phys., 5: 3127-3137.
CrossRefDirect Link - Cao, J.J., S.C. Lee, J.C. Chow, J.G. Watson and K.F. Ho et al., 2007. Spatial and seasonal distributions of carbonaceous aerosols over China. J. Geophys. Res., Vol. 112.
CrossRef - Castro, M.L., A.C. Pio, M.R. Harrison and T.J.D. Smith, 1999. Carbonaceous aerosol in urban and rural European atmospheres: Estimation of secondary organic carbon concentrations. Atmos. Environ., 33: 2771-2781.
CrossRefDirect Link - Chow, J.C., J.G. Watson, L.C. Pritchett, W.R. Pierson, C.A. Frazier and R.G. Purcell, 1993. The dri thermal/optical reflectance carbon analysis system: Description, evaluation and applications in U.S. Air quality studies. Atmos. Environ. Part A: Gen. Top., 27: 1185-1201.
CrossRefDirect Link - Chow, J.C., J.G. Watson, D. Crow, D.H. Lowenthal and T. Merrifield, 2001. Comparison of IMPROVE and NIOSH carbon measurements. Aerosol Sci. Technol., 34: 23-34.
CrossRefDirect Link - Dachs, J. and S.J. Eisenreich, 2000. Adsorption onto aerosol soot carbon dominates gas-particle partitioning of polycyclic aromatic hydrocarbons. Environ. Sci. Technol., 34: 3690-3697.
CrossRefDirect Link - Fung, K., J.C. Chow and J.G. Watson, 2002. Evaluation of OC/EC speciation by thermal manganese dioxide oxidation and the IMPROVE method. J. Air Waste Manage. Assoc., 52: 1333-1341.
PubMed - Goncalvesa, C., M. Evtyugina, C. Alves, M. Monteiro, C. Pio and M. Tome, 2011. Organic particulate emissions from field burning of garden and agriculture residues. Atmos. Res., 101: 666-680.
CrossRefDirect Link - Grivas, G., S. Cheristanidis and A. Chaloulakou, 2012. Elemental and organic carbon in the urban environment of Athens. Seasonal and diurnal variations and estimates of secondary organic carbon. Sci. Total Environ., 414: 535-545.
CrossRefDirect Link - Han, M.Y., W.Z. Han, J.J. Cao, C.J. Chow and G.J. Watson et al., 2008. Distribution and origin of carbonaceous aerosol over a rural high-mountain lake area, Northern China and its transport significance. Atmos. Environ., 42: 2405-2414.
CrossRefDirect Link - He, K., F. Yang, Y. Ma, Q. Zhang and X. Yao et al., 2001. The characteristics of PM2.5 in Beijing, China. Atmos. Environ., 35: 4959-4970.
CrossRefDirect Link - Jones, C.K. and D.P. de Voogt, 1999. Persistent Organic Pollutants (POPs): State of the science. Environ. Pollut., 100: 209-221.
CrossRefDirect Link - Kaupp, H. and S.M. McLachlan, 1999. Gas/particle partitioning of PCDD/Fs, PCBs, PCNs and PAHs. Chemosphere, 38: 3411-3421.
CrossRefDirect Link - Kim, Y.P., K.C. Moon and J.H. Lee, 2000. Organic and elemental carbon in fine particles at Kosan, Korea. Atmos. Environ., 34: 3309-3317.
CrossRefDirect Link - Kocaka, M., N. Mihalopoulosb and N. Kubilay, 2007. Chemical composition of the fine and coarse fraction of aerosols in the northeastern Mediterranean. Atmos. Environ., 41: 7351-7368.
CrossRefDirect Link - Li, C., C.S. Tsay, C.N. Hsu, Y.J. Kim and G.S. Howell et al., 2013. Characteristics and composition of atmospheric aerosols in Phimai, central Thailand during BASE-ASIA. Atmos. Environ., 78: 60-71.
CrossRefDirect Link - Lin, J.J. and S.H. Tai, 2001. Concentrations and distributions of carbonaceous species in ambient particles in Kaohsiung City, Taiwan. Atmos. Environ., 35: 2627-2636.
CrossRefDirect Link - Matsumoto, K., I. Nagao, H. Tanaka, H. Miyaji, T. Iida and Y. Ikebe, 1998. Seasonal characteristics of organic and inorganic species and their size distributions in atmospheric aerosols over the Northwest Pacific Ocean. Atmos. Environ., 32: 1931-1946.
CrossRefDirect Link - Minvielle, F., G. Cautenet, O.M. Andreae, F. Lasserre and G. Foret et al., 2004. Modelling the transport of aerosols during INDOEX 1999 and comparison with experimental data-1: Carbonaceous aerosol distribution. Atmos. Environ., 38: 1811-1822.
CrossRefDirect Link - Na, K., A.A. Sawant, C. Song and R.D. Cocker, 2004. Primary and secondary carbonaceous species in the atmosphere of Western Riverside County, California. Atmos. Environ., 38: 1345-1355.
Direct Link - O'Brien, M.D. and M.R. Mitchell, 2003. Atmospheric heating due to carbonaceous aerosol in northern Australia: Confidence limits based on TOMS aerosol index and sun-photometer data. Atmos. Res., 66: 21-41.
CrossRefDirect Link - Osada, K., M. Kido, C. Nishita, K. Matsunaga, Y. Iwasaka, M. Nagatani and H. Nakada, 2002. Changes in ionic constituents of free tropospheric aerosol particles obtained at Mt. Norikura (2770 m a.s.l.), Central Japan, during the Shurin period in 2000. Atmos. Environ., 36: 5469-5477.
Direct Link - Park, S.S. and Y.S. Cho, 2011. Tracking sources and behaviors of water-soluble organic carbon in fine particulate matter measured at an urban site in Korea. Atmos. Environ., 45: 60-72.
CrossRefDirect Link - Penner, E.J., C.C. Chuang and C. Liousse, 1996. The contribution of carbonaceous aerosols to climate change. Nucleation Atmos. Aerosols.
Direct Link - Pio, C., M. Cerqueira, M.R. Harrison, T. Nunes and F. Mirante et al., 2011. OC/EC ratio observations in Europe: Re-thinking the approach for apportionment between primary and secondary organic carbon. Atmos. Environ., 45: 6121-6132.
CrossRefDirect Link - Pongpiachan, S., K. Thamanu, K.F. Ho, S.C. Lee and P. Sompongchaiyakul, 2009. Predictions of gas-particle partitioning coefficients (Kp) of polycyclic aromatic hydrocarbons at various occupational environments of Songkhla province, Thailand. Southeast Asian J. Trop. Med. Public Health, 40: 1377-1394.
Direct Link - Quah, E., 2002. Transboundary pollution in Southeast Asia: The Indonesian fires. World Dev., 30: 429-441.
CrossRefDirect Link - Repine, E.J., K.O. Reiss, N. Elkins, R.A. Chughtai and M.D. Smith, 2008. Effects of fine carbonaceous particles containing high and low unpaired electron spin densities on lungs of female mice. Trans. Res., 152: 185-193.
CrossRefDirect Link - Ram, K., M.M. Sarin and P. Hegde, 2008. Atmospheric abundances of primary and secondary carbonaceous species at two high-altitude sites in India: Sources and temporal variability. Atmos. Environ., 42: 6785-6796.
CrossRef - Sahu, K.L., Y. Kondo, Y. Miyazaki, P. Pongkiatkul and N.T.K. Oanh, 2011. Seasonal and diurnal variations of black carbon and organic carbon aerosols in Bangkok. J. Geophys. Res., Vol. 116.
CrossRef - Schummer, C., E. Mothiron, R.M.B. Appenzeller, R. Wennig and M. Millet, 2010. Gas/particle partitioning of currently used pesticides in the atmosphere of Strasbourg (France). Air Q. Atmos. Health, 3: 171-181.
CrossRefDirect Link - Shih, S.T., H.C. Lai, F.H. Hung, Y.S. Ku and J.P. Tsai et al., 2008. Elemental and organic carbon exposure in highway tollbooths: A study of Taiwanese toll station workers. Sci. Total Environ., 402: 163-170.
CrossRefDirect Link - Simcik, F.M., P.T. Franz, H. Zhang and J.S. Eisenreich, 1998. Gas-particle partitioning of PCBs and PAHs in the Chicago urban and adjacent coastal atmosphere: States of equilibrium. Environ. Sci. Technol., 32: 251-257.
CrossRefDirect Link - Temesi, D., A. Molnar, E. Meszaros and T. Feczko, 2003. Seasonal and diurnal variation in the size distribution of fine carbonaceous particles over rural Hungary. Atmos. Environ., 37: 139-146.
CrossRefDirect Link - Terzi, E., G. Argyropoulos, A. Bougatioti, N. Mihalopoulos, K. Nikolaou and C. Samara, 2010. Chemical composition and mass closure of ambient PM10 at urban sites. Atmos. Environ., 44: 2231-2239.
CrossRefDirect Link - Vercauteren, J., C. Matheeussen, E. Wauters, E. Roekens and V.R. Grieken et al., 2011. Chemkar PM10: An extensive look at the local differences in chemical composition of PM10 in Flanders, Belgium. Atmos. Environ., 45: 108-116.
CrossRefDirect Link - Yu, S., L.R. Dennis, V.P. Bhave and K.B. Eder, 2004. Primary and secondary organic aerosols over the United States: Estimates on the basis of observed Organic Carbon (OC) and Elemental Carbon (EC) and air quality modeled primary OC/EC ratios. Atmos. Environ., 38: 5257-5268.
CrossRefDirect Link - Zeng, T. and Y. Wang, 2011. Nationwide summer peaks of OC/EC ratios in the contiguous United States. Atmos. Environ., 45: 578-586.
CrossRefDirect Link