
Aderonke A. Okoya
Institute of Ecology and Environmental Studies, Obafemi Awolowo University, Ile-Ife, Osun State, Nigeria
LiveDNA: 234.34449
Doyinsola Diisu
Institute of Ecology and Environmental Studies, Obafemi Awolowo University, Ile-Ife, Osun State, Nigeria
Trends in Applied Sciences Research
Year: 2021 | Volume: 16 | Issue: 1 | Page No.: 1-9


ABSTRACT
Background and Objective: Dyeing is the process of adding color to textile products. Many industries use dyes to color their products and thus produce wastewater containing organics with a strong color. This study investigated the use of sawdust and Periwinkle Shells (PS), agricultural wastes to produce adsorbents for Indigo dye adsorption from textile wastewater. Materials and Methods: This study compares the efficiencies of sawdust and PS-based chitosan modified sawdust activated carbons with Commercial Activated Carbon (CAC) and parameters such as dosage, time, initial concentration and pH were optimized. Dye concentrations were determined with UV-Visible spectrophotometer. Langmuir and Freundlich equilibrium models were used to explore adsorbate interaction with adsorbents. Results: Gravimetrical determination of sawdust char and chitosan yielded 4.20 and 68.50%, respectively from sawdust and PS. Rutherford backscattering spectrometric technique resulted in Carbon having highest percentage (42.87) among other elements such as O, Na, Mg, Al, Si, P, S, Cl, K, Ca and Fe. Fourier Transform Infra-Red (FTIR) spectra of chitosan and sawdust activated carbon showed the presence of the relevant functional groups. Optimum adsorption conditions used for the textile wastewater are 0.3 g of dosage, pH of 6 and time of 60 min resulting in optimum efficiencies of 26.83 and 18.5% for Sawdust Activated Carbon (SAC) and chitosan modified SAC respectively but are not significantly different. Conclusion: The study concluded that SAC can be an alternative adsorbent to expensive CAC for Indigo dye removal from aqueous solution while PS is a chitosan rich source.
PDF Abstract XML References Citation
How to cite this article
Aderonke A. Okoya and Doyinsola Diisu, 2021. Adsorption of Indigo-dye from Textile Wastewater onto Activated Carbon Prepared from Sawdust and Periwinkle Shell. Trends in Applied Sciences Research, 16: 1-9.
URL: https://scialert.net/abstract/?doi=tasr.2021.1.9
URL: https://scialert.net/abstract/?doi=tasr.2021.1.9
INTRODUCTION
Forests have played a vital role in the development of human habitation and wellbeing. The major marketable product of most forest is wood (timber), fuel-wood, pulp and paper providing an estimated timber equivalent of 3.4 billion cubic meters a year globally. After a 60% increase between 1960 and 1990, wood consumption worldwide fluctuated. In the 1990s global wood consumption rose no further largely due to efficient recycling of timber and paper recycling. In 2013, the production of wood particles in the form of pellets increased by 12% and attained about 20 million tonnes1. Wood industries produce large volumes of solid residues that must be utilized, marketed or properly disposed of. Heaps of wood residues are common features in wood industries throughout the year. In Nigeria, this residue is generally regarded as waste and this has led to open burning practices, dumping in water bodies or dumping in an open area which constitutes environmental pollution. Sawmills in Nigeria generated over 1,000,000 m3 of wood waste in 2010, while about 5000 m3 of waste were generated in plywood mills. Nigeria generates about 1.8 M tons of sawdust annually and 5.2 M tons of wood wastes2. The impact of improper disposal of sawdust on the environment affects both the aquatic and terrestrial ecosystems. Burning of sawdust releases greenhouse gases into the atmosphere that causing various health issues3. Recycling of these wood residues in Nigeria will reduce the pressure on ever decreasing forests and reduce environmental pollution.
Dyeing is the process of adding color to textile products like fibres, yarns and fabrics. Many industries like the textile industry use dyes to color their products and thus produce wastewater containing organics with a strong color4. Most of the industrial wastewaters are discharged into water bodies without sufficient or proper treatment hence, endangering all lives. Residual dyes in wastewater are stable and can exist in the water environment for a long time, causing aquatic ecosystem damage and water pollution5. Discharge of these dyes into water bodies may affects people who may use these waters for living purposes such as washing, bathing and drinking6. Once dyes are absorbed by humans, they tend to accumulate in the liver, kidneys, bones, heart and brain and then some pathogenic effects would occur7. It is therefore very important to assess the water quality for various uses, more so that 1.0 mg L–1 of dye concentration in drinking water could impart a significant color, making it unfit for human consumption8. Also, because a wide variety of dyes are ubiquitous in printing and dyeing wastewater and are characterized as poor biodegradability, high chroma and strong toxicity, the need for effective and economical treatment of wastewater containing a variety of dyes has become an inevitable requirement for cleaner production technology in the textile industries.
Several methods of dyes decontamination such as coagulation, filtration, oxidation, nano-filtration etc have been developed and these methods differ in their effectiveness and cost. Although no technology used today has universal application because removal of dyes depends upon their physical and chemical characteristics as well as the selected treatment method. Due to the low operating costs and high flexibility, adsorption is considered as one of the most effective technologies for pollutant management. Agricultural waste has loose and porous structures and contains functional groups such as the carboxyl group and hydroxyl group, so it can be invoked as biological adsorption material9. However, there is need to optimize the conditions for their application.
Hence, this study used sawdust as a resource rather than “waste” by developing it into adsorbents in the form of Sawdust Activated Carbon (SAC) and chitosan Modified Sawdust Activated Carbon (CMSAC). The adsorbents were compared with the commercially available activated carbon (CAC) under optimized conditions for indigo dye removal from textile effluent.
MATERIALS AND METHODS
Study area: The sawdust used for this study was collected from a wood processing company (Saw mill) in Ile-Ife, PS was obtained from backyard dumpsite in Uyo, Akwa-Ibom State, Nigeria, in January 2016 while wastewater was collected from a local textile industry in Osogbo in May, 2016 and commercial activated carbon (GAC F-300) was obtained from a chemical store in Osogbo in 2016.
Preparation of adsorbents
Carbonization of sawdust: The collected sawdust was washed to remove foreign debris and afterward sun-dried to constant weight and sieved with 300 μm mesh10. The 100 g of the sieved sawdust was placed in a crucible and put into a furnace (Carbolite RHF 1600). The furnace was set to 500°C and held at this temperature for 1 h 30 min. The charred sawdust was allowed to cool to room temperature in an air-tight crucible, after which it was weighed to determine the carbon yield from the expression11:
 | (1) |
Activation of sawdust char: The weighed sawdust char was soaked in 2% H2SO4 (v/v) and placed in a laboratory oven (DHG-9030) at a temperature of 110°C for 24 hrs to activate. The activated sawdust char was washed with distilled water till neutral pH and subsequently soaked in 2% NaHCO3 (w/v) to remove the residual acid. Afterward, it was oven dried at 110°C till constant weight, cooled at room temperature and stored in a desiccator till further use12.
Preparation of chitosan
Deproteinization of periwinkle shell: The collected PS was washed, sun-dried and ground into powdered form. The powdered PS was then deproteinized by adding 4% (w/v) KOH and stirred on a magnetic stirrer for 6 hrs at 80°C13.
Demineralization of deproteinized periwinkle shell: The deproteinized PS was poured into 250 mL conical flask and 100 mL of 3% (v/v) 1 M HCl was added. It was then placed on magnetic stirrer for 3 hrs at 30°C. After the stipulated time, the content was filtered and the residue was washed and tested with litmus paper until it is free of acid. The acid-free residue was then dried at 90°C for 1 h13,14.
Decolorization of demineralized periwinkle shell: The demineralized PS were decolorized by refluxing in acetone for 3 hrs at 60°C after which the content was filtered and dried. A snow white residue called chitin was obtained13,14.
Deacetylation of chitin: Sodium hydroxide (50% w/v) solution was added to the chitin in 250 mL capacity conical flask and placed on a magnetic stirrer at 30°C for 4 hrs. After which it was filtered. The residue, which is chitosan (2-acetamido-2-deoxy-β-D-glucose-N-(acetylglucos amine) was then washed and oven-dried at 90°C for 1 h15,16.
Determination of chitosan yield from periwinkle shell: The yield of chitosan extracted from PS was a deterministic factor for periwinkle as a good source of chitosan. The percentage chitosan yield was calculated using11:
 | (2) |
Preparation of chitosan gel: Chitosan (5 g) was slowly added to 100 mL of 10% (w/v) oxalic acid with constant stirring. The mixture was also heated to 50°C to facilitate mixing. A chitosan-oxalic acid mixture was formed (a whitish viscous gel).
Modification of sawdust activated carbon with chitosan gel: Sawdust Activated Carbon (SAC) was weighed (50 g) and slowly added to the chitosan gel (100 mL), it was agitated using a mechanical shaker operated at 200 osc min–1 for 24 hrs. The chitosan coated SAC was washed, dried and then soaked in 0.5% (w/v) NaOH solution for 3 hrs. It was then extensively rinsed with distilled water and dried in an oven at 102°C for 2 hrs, cooled at room temperature and stored in a desiccator10,11,13,14.
Characterization of the adsorbents: The elemental compositions of the adsorbents were determined using Rutherford backscattering spectrometric technique (1.7 MeV Tandem Accelerator). The surface morphologies were determined using Scanning Electron Microscope (SEM) and also the chemical functional groups were determined using Fourier transform infrared spectroscopy (FTIR- SHIMADZU-FTIR-8400S).
Simulation of indigo dye solution: Indigo (vat dye) is the adsorbate used in this study. It was purchased from a local market in Ile-Ife, Osun State. The stock solution of 500 mg L–1 was prepared from which other varying concentrations of 25, 50, 100, 125 and 250 mg L–1 was prepared.
Batch adsorption experiments on simulated indigo dye solution: Batch adsorption studies for the removal of indigo dye were carried out using SAC, Chitosan Modified Sawdust Activated Carbon (CMSAC) and Commercial Activated Carbon (CAC) as adsorbents. Simulated Indigo dye solution (10 mL) in different conical flasks were mixed with different adsorbents on a mechanical shaker at a speed of 500 rpm. Parameters such as initial Indigo dye concentration (25-250 mg L–1), adsorbent dosage (0.1-0.5 g), contact time (10-60 min), pH (3.0-11.5) were investigated. After the batch adsorption, the samples were filtered and the residual concentrations of dye in the filtrates were determined using UV Spectrophotometer (SHIMADZU-UV-2700). Equation 3 was used to determine the quantity of Indigo dye adsorbed and Eq. 4 was used to determine the adsorption efficiency. The optimum values obtained for contact time, pH and adsorbent dosage were used for the adsorption of textile industry wastewater whose initial concentration was determined using the Regression equation from the Calibration curve of the prepared dye solution. Initial concentration of the textile wastewater was also varied17:
 | (3) |
Where:
| Co and Ce | = | Dye concentration measured before and after adsorption (mg L–1) |
| V | = | Volume of aqueous solution (L) |
| W | = | Dry weight of the adsorbent (g) |
Where:
| Ci | = | Initial concentration of dye before adsorption (mg L–1) |
| Ce | = | Final concentration of dye solution in the filtrate after adsorption (mg L–1) |
Adsorption Isotherm: Equilibrium models and sorption isotherms were used to explore how the adsorbate interacts with the adsorbents. Langmuir and Freundlich adsorption isotherms were applied in this study to describe isotherms of Indigo dye sorption on SAC, CMSAC and CAC.
RESULTS AND DISCUSSION
Preparation and characterization of adsorbents: The yield of both the sawdust char and the chitosan were determined gravimetrically. The sawdust char and the chitosan extracted were expressed in percentage of the sawdust (4.20%) and the PS (68.50%), respectively as shown in Table 1.
Elemental composition of sawdust activated carbon: Table 2 shows the elemental composition of SAC. Carbon has the highest composition (42.87%) of the elements present. The presence of other elements such as O, Na, Mg, Al, Si, P, S, Cl, K, Ca and Fe can enhance the adsorption through different adsorption mechanism13.
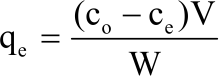
Determination of surface functional group of chitosan and sawdust activated carbon: The Fourier Transform Infra-Red (FTIR) spectra of chitosan and SAC are presented in Fig. 1 and 2, respectively. The figures show the IR spectrums of the chitosan extracted from PS and SAC and also highlight major stretching frequencies of the surface functional group present in both chitosan and SAC. In the chitosan, FTIR analysis affirms the presence of C-H stretching vibration as shown by the stretching frequency at 2918.84, 2519.62 and 2359.43 cm–1 peaks are due to O-H and =NH+- bonding extending recurrence while the extending recurrence at 1497.51 cm–1 was because of = NH. The bands at 875.10 and 666.51 cm–1 may be credited to isolate aromatic C-H and C-Cl (alkyl) extending frequencies (Fig. 1).
| Table 1: Yield of sawdust char and chitosan from sawdust and periwinkle shell | ||||
| Raw material | Raw weight (g) | Finished product | Weight of finished product (g) | Yield (%) |
| Sawdust | 100 | Sawdust char | 4.20±0.18 | 4.2 |
| Powdered periwinkle shell | 50 | Chitosan | 34.25±3.93 | 68.5 |
 |
| Fig. 1: | FTIR Spectrum of chitosan extracted from periwinkle shell |
 |
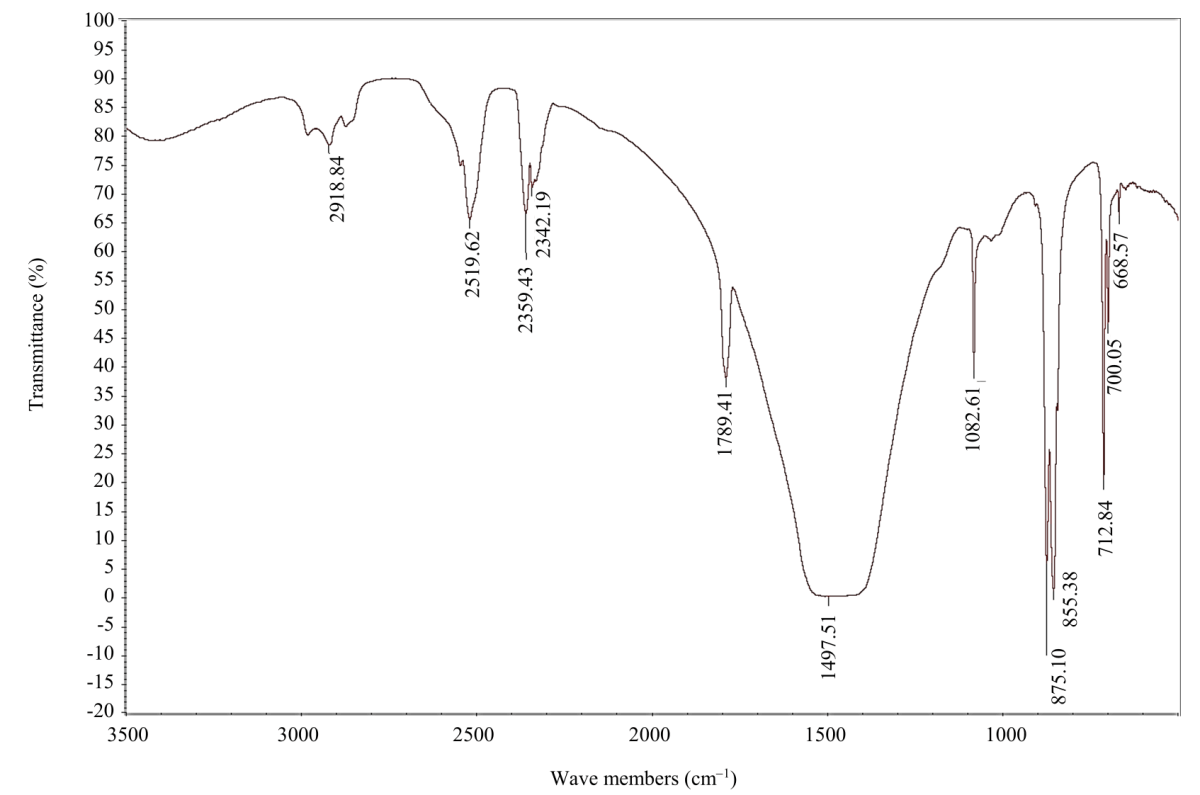
| Fig. 2: | FTIR spectrum of sawdust activated carbon |
 |
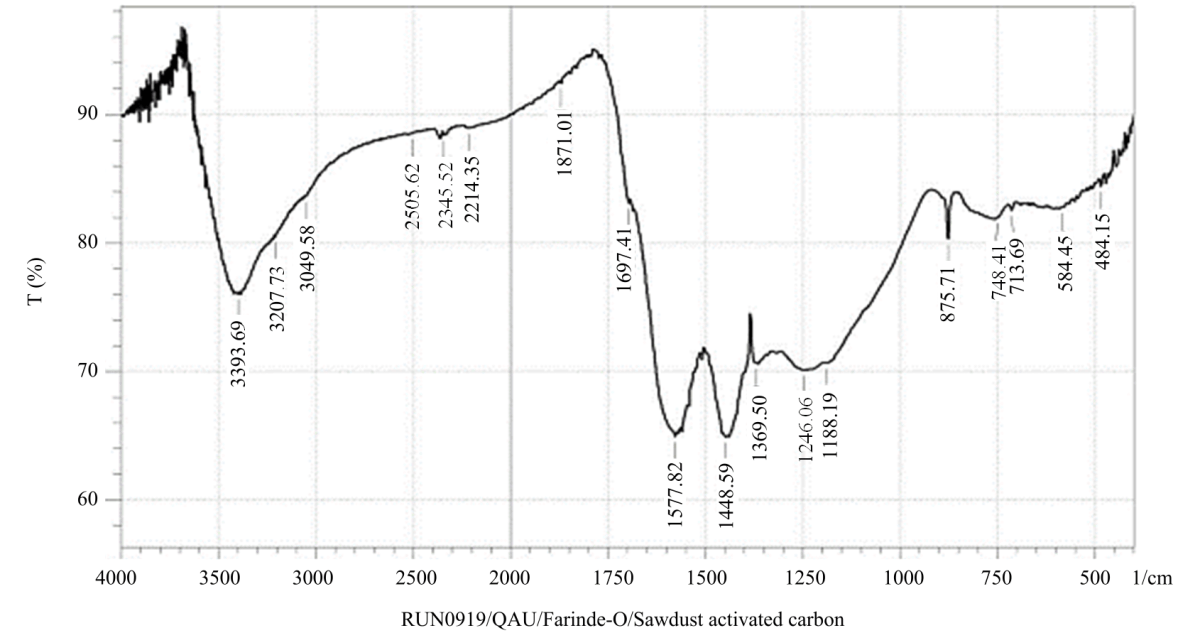
| Fig. 3(a-b): | SEM image of SAC and CMSAC |
While in sawdust activated carbon, the IR spectrum shows characteristic peaks of -OH between 3398.69-2345.52 cm–1, -C ≡ C- and C-H at 2214.35 and 875.71 cm–1 while C-Br at 554.45 cm–1 (Fig. 2).
Surface morphology of SAC and CMSAC: Figure 3a and b reveal the SEM image of SAC and CMSAC, respectively. The typical irregular texture of the surface of the adsorbents provides an indication of adsorption sites, which enhances adsorption. Figure 3b reveals white patches on the surface of the adsorbent as a result of the chitosan used for its modification.
Optimization of parameters in batch adsorption of indigo dye
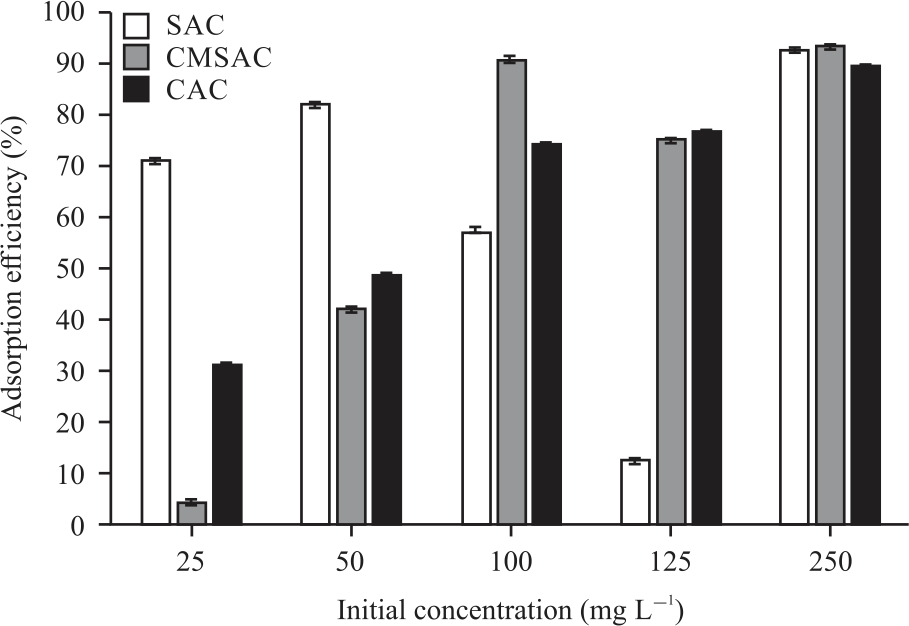
Effect of initial concentration on adsorption of indigo dye: Figure 4 shows the effect of varied initial concentrations of indigo dye, while other parameters were kept constant. With each initial concentration, the adsorption efficiency of dye by each of the adsorbents varied as shown in Fig. 4.
 |
| Fig. 4: | Effect of initial concentration on indigo dye adsorption |
 |
| Fig. 5: | Effect of adsorbent dosage on indigo dye adsorption |
| Table 2: Elemental composition of sawdust activated carbon | ||
| Sawdust activated carbon | ||
| Element | Weight (%) | Atomic (%) |
| C | 42.87 | 56.19 |
| O | 34.37 | 33.82 |
| Na | 0.47 | 0.32 |
| Mg | 0.85 | 0.55 |
| Al | 1.2 | 0.7 |
| Si | 2.27 | 1.27 |
| P | 0.75 | 0.37 |
| S | 0.48 | 0.23 |
| Cl | 1.23 | 0.55 |
| K | 11.77 | 4.74 |
| Ca | 2.09 | 0.82 |
| Fe | 1.65 | 0.44 |
Generally, it was observed that the highest adsorption efficiencies for the three adsorbents were achieved at 250 mg L–1 initial indigo dye concentration. The CMSAC has the highest percentage adsorption efficiency of 93.8% compared to SAC with 93.13 and 89.8% for CAC. The CMSAC even performed much best at 100 mg L–1 initial dye concentration.
 |
| Fig. 6: | Effect of contact time on indigo dye adsorption |
 |
| Fig. 7: | Effect of pH on indigo dye adsorption |
The improved performance of CMSAC over SAC and CAC maybe attributed to the presence of chitosan on the surface of CMSAC. Chitosan enhances binding sites for contaminants uptake18,19.
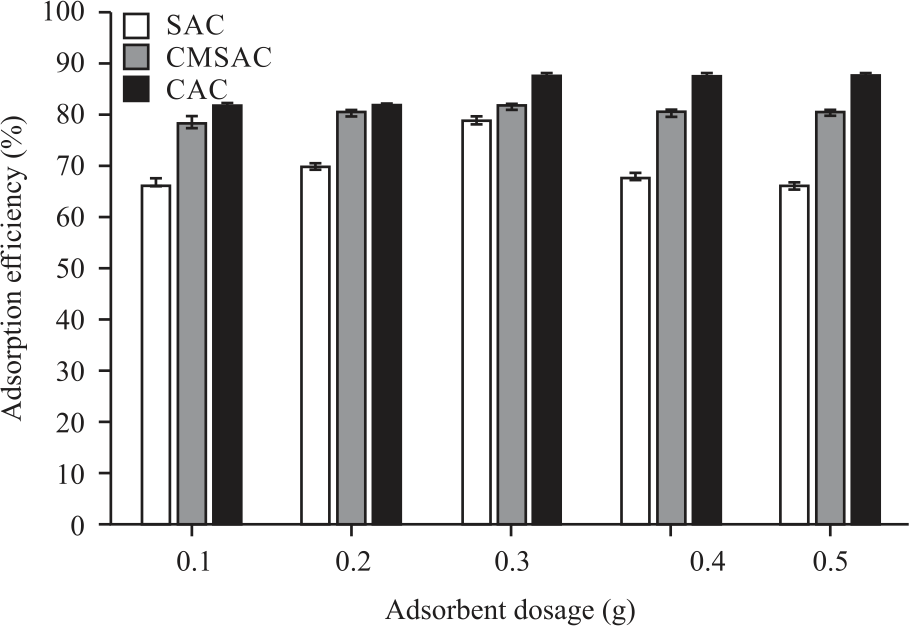
Effect of adsorbent dosage on adsorption of indigo dye: Dosage of adsorbent is one of the important parameters used to determine the adsorbents’ capacity for a given amount of adsorbate10,11. Figure 5 shows the adsorption efficiencies of SAC, CMSAC and CAC at various adsorbent dosages. It was observed that highest adsorption efficiencies were at 0.3 g for all the adsorbents. After which adsorption capacity decreases across the adsorbents with increasing adsorbents’ amount at a constant indigo dye concentration. This may be attributed to saturation of adsorption sites on adsorbents’ surfaces due to particulate interaction such as aggregation, which would lead to a decrease in total surface area of the adsorbents20.
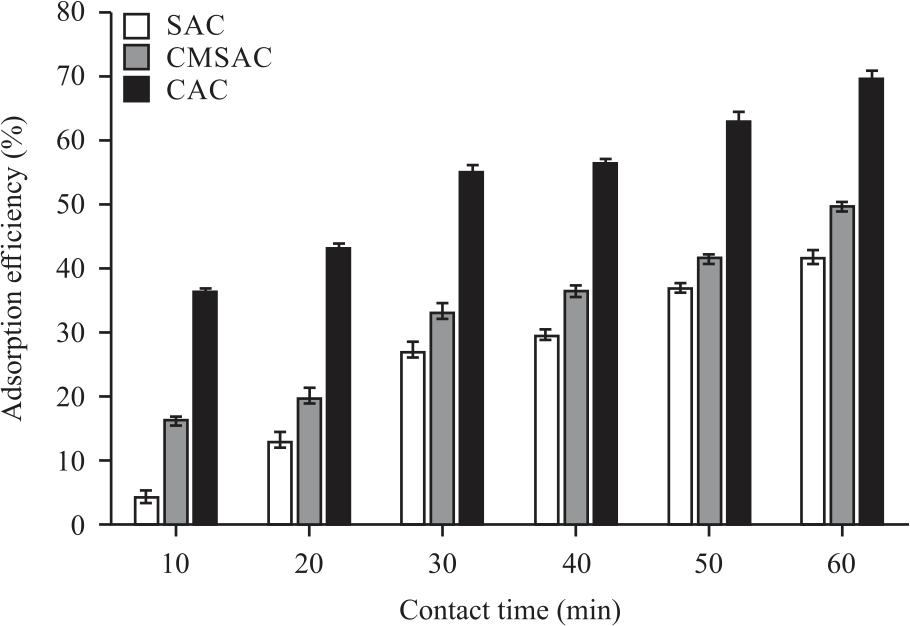
Effect of contact time on adsorption: The adsorption efficiency of SAC, CMSAC and CAC are shown at different contact times in Fig. 6.
| Table 3: Langmuir and freundlich constants for the adsorption of indigo dye with the agricultural waste based adsorbents | ||||||
| Langmuir constants | Freundlich constants | |||||
| Adsorbent | b (L mg–1) | Qmax (mg g–1) | R2L | K | 1/n | R2F |
| SAC | -0.03528 | -0.03618 | 0.9981 | 7.91×10⁻⁵ | 2.3937 | 0.9861 |
| CMSAC | -0.04019 | -0.01632 | 0.9789 | 2.26×10⁻⁶ | 4.2341 | 0.7468 |
| *R2: Correlation coefficient | ||||||
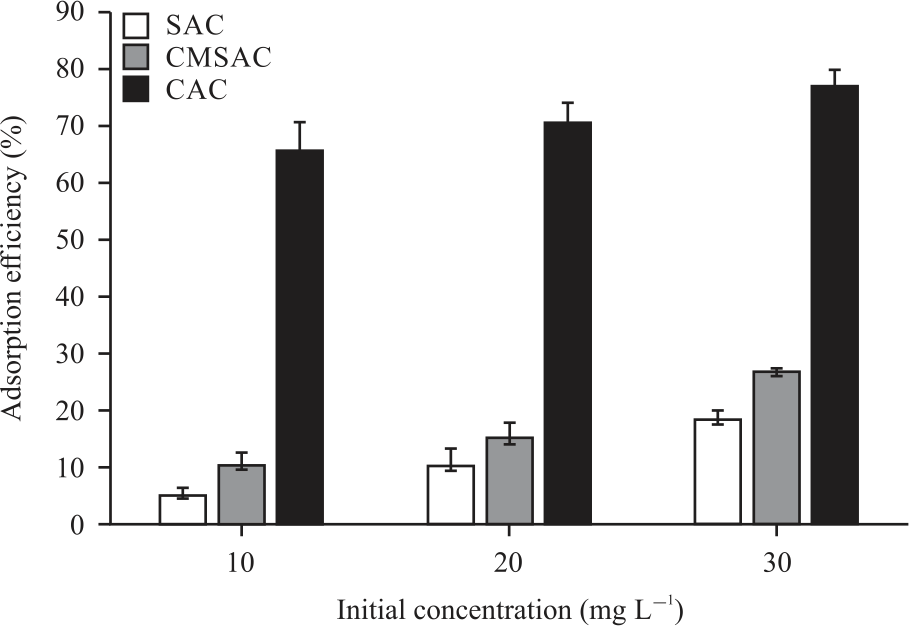 |
| Fig. 8: | Adsorption of dye from textile industry wastewater |
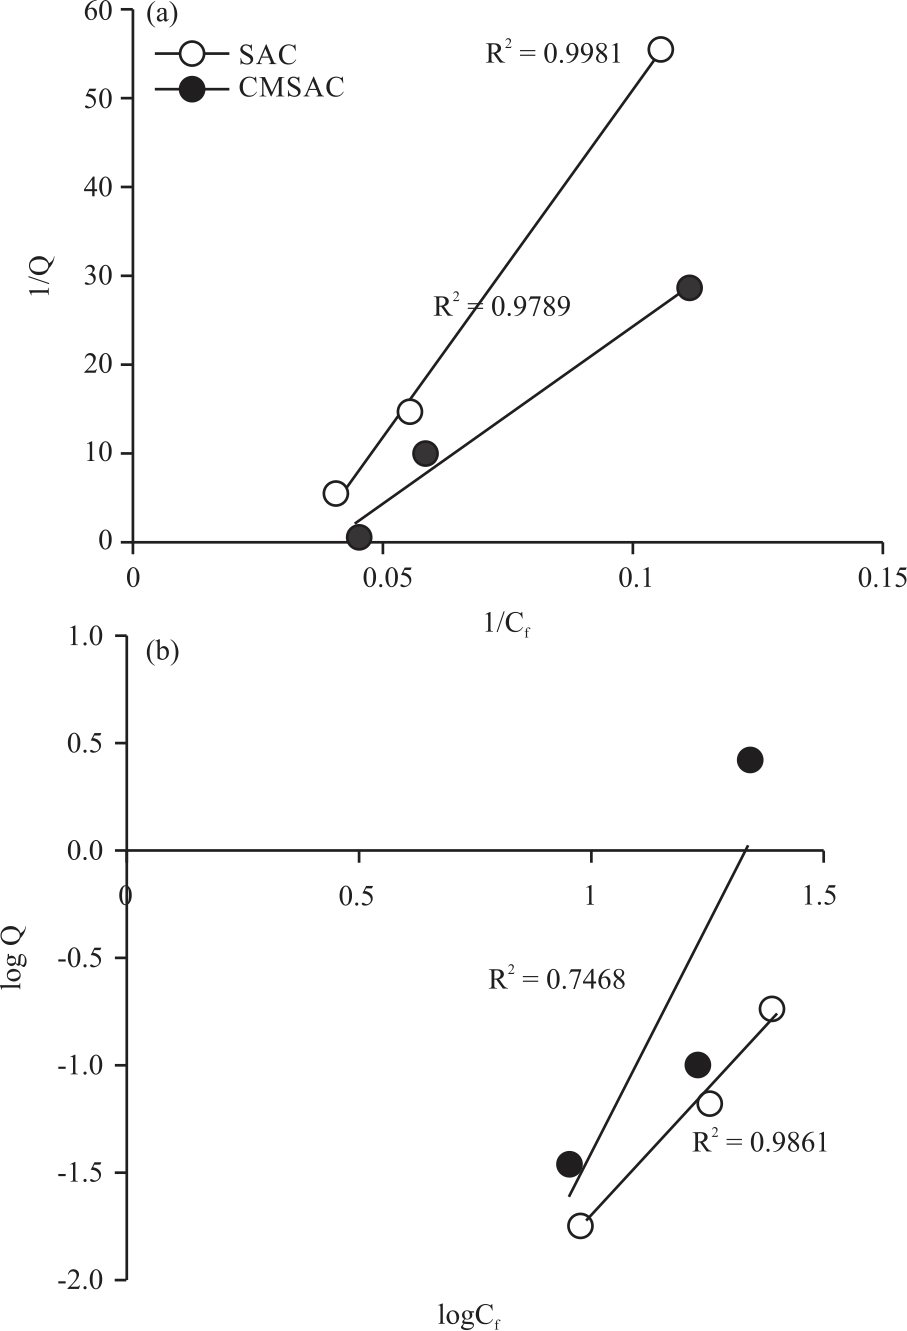 |
| Fig. 9(a-b): | Langmuir adsorption and (b) Freundlich adsorption isotherm for the adsorption of Indigo Dye by SAC and CMSAC |
The percentage removal of indigo dye from the simulated solution with varied contact time is presented. Maximum indigo dye removal efficiency observed was 41.8% in case of SAC, 49.8% with CMSAC and 69.8% with CAC. The optimal time for the maximum removal was 60 min across all the adsorbents. It was observed that adsorption efficiencies increased with increase in contact time. The most plausible reason for this trend may be as result of high interaction between the adsorbate molecules and the adsorption sites of the adsorbents21.
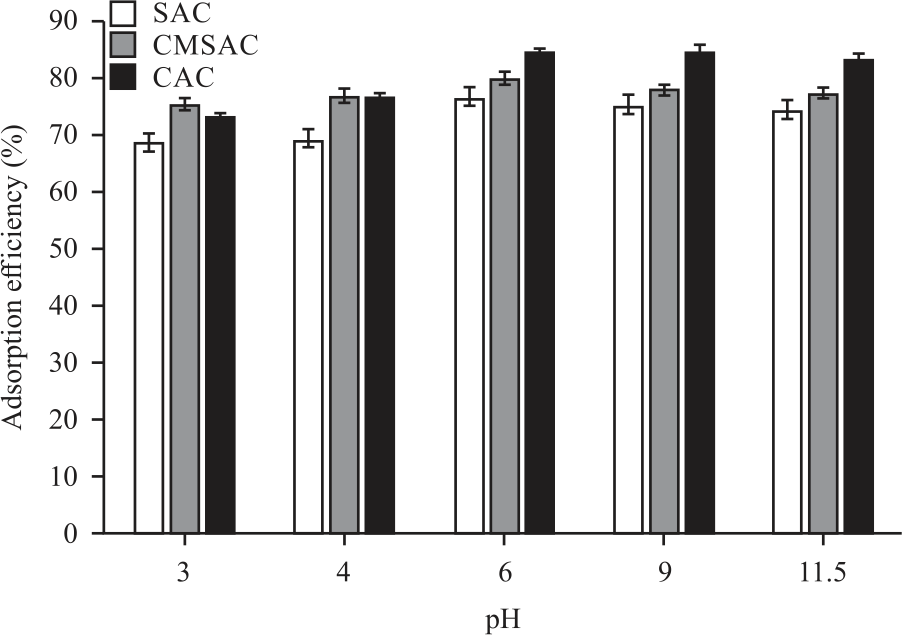
Effect of pH on adsorption of dye: Adsorption was carried out at different pH values (3.0-11.5) while other parameters were kept constant as shown in Fig. 7. The pH factor is very important in the adsorption process especially for dye adsorption. The adsorption of indigo dye by all the adsorbents were generally high, there was higher adsorption efficiency from pH 3.0-6.0. Higher uptakes obtained at lower pH may be due to the electrostatic attractions between negatively charged functional groups located on the reactive dye and positively charged adsorbent surface. The change in solution pH will affect the ionization of these functional groups22-24.
Figure 8, shows the adsorption experiment performed on textile wastewater. The absorbance of the wastewater was determined using the UV spectrometer and the concentration was then determined using the regression equation from the calibration curve of the prepared indigo dye solution. The concentration obtained was then diluted used to varying concentration of 10, 20 and 30 mg L–1. Optimum conditions from the simulation experiments were used with the varied initial concentrations of textile wastewater. It was observed that adsorption efficiencies increased with increasing initial indigo dye concentration for all the adsorbents. The CAC gave the highest adsorption efficiencies across the three concentrations while SAC has the lowest adsorption efficiencies
Adsorption Isotherm: The adsorption capacity is usually predicted from equilibrium sorption isotherm25. The models used for this study are the Langmuir and Freundlich isotherm model. The sorption performance of SAC and CMSAC was evaluated through determination of sorption isotherm of Indigo dye. Figure 9a shows the plot of 1/Q against 1/Cf (Langmuir isotherm) and Fig. 9b shows the plot of logQ against logCf (Freundlich isotherm). Langmuir and Freundlich constants for the adsorption of indigo dye are presented in Table 3. The values of Qmax and b are, respectively determined from the slope and intercepts of the plots of 1/Q against 1/Cf while the values of 1/n and K are, respectively obtained from the intercept and slope of the graph between logQ against LogCf. The Freundlich isotherm model assumes heterogeneous surface energies, while the energy term in the Langmuir equation varies as a function of the surface coverage. Langmuir isotherm is developed by assuming that a fixed number of adsorption sites are available and that the adsorption is reversible26.
The Langmuir isotherm had the correlation coefficients (R2) >0.95 for SAC and CMSAC, which shows the suitability of experimental isotherm data while Freundlich isotherm has R2 value of 0.9861 for SAC and 0.7468 for CMSAC. The values of K determine the adsorption capacity of an adsorbent at equilibrium concentration in a solution26. A higher K value corresponds to a higher adsorption capacity. Both Langmuir and Freundlich isotherm have correlation coefficient (R2), which are calculated from the graphs as presented in Table 3. The R values falls within 0<R2<1 and both isotherms adequately describe the experimental data of the adsorption of Indigo dye. Both Langmuir and Freundlich isotherm had good fitting for the adsorbents except the R2F value for CMSAC.
CONCLUSION
The study concluded that wastes such as sawdust, instead of open burning which will lead to the release of greenhouse gases into the atmosphere causing various health issues and PS that is non-biodegradable can be processed into less expensive, non-hazardous alternative adsorbents to the commercially expensive available activated carbon for Indigo dye removal in aqueous solution. Best adsorption conditions observed for the sawdust based adsorbents are initial concentration of 50 and 100 mg L–1 for SAC and CMSAC, respectively, pH of 6, adsorbent dosage of 0.3 g and contact time of 60 min. Sawdust activated carbon showed good adsorption efficiency and there was no significant difference with the chitosan modified sawdust activated carbon. However PS gave a good yield (68.3%) of chitosan.
SIGNIFICANCE STATEMENT
This study discovered the optimum conditions that can favour the removal of dye from textile wastewater using adsorbents derived from sawdust and periwinkle shells. This makes the unutilized sawdust and periwinkle shells “resources” rather than “wastes” to both the agriculturist and the industrialist. Also these “solid wastes” will be better managed and will no more be creating a nuisance to the environment of the general public. This study will help the researchers to uncover the optimum conditions for adsorption of Indigo dye from local textile wastewater that pollutes the available water bodies in which there is paucity of data from other researchers.
ACKNOWLEDGMENT
The author acknowledged Miss Nnenne Ochor with gratitude the collection of Periwinkle shells from Akwa Ibom state and other volunteering members of staff of SwWECh Laboratory in the Institute of Ecology and Environmental Studies, Obafemi Awolowo University, Ile-Ife, Nigeria for proofreading the manuscript.
REFERENCES
- Bais, A.L.S., C. Lauk, T. Kastner and K. Erb, 2015. Global patterns and trends of wood harvest and use between 1990 and 2010. Ecolo. Econ., 119: 326-337.
CrossRefDirect Link - Owoyemi, J.M., H.O. Zakariya and I.O. Elegbede, 2016. Sustainable wood waste management in Nigeria. Environ. Socio-econ. Stud., 4: 1-9.
CrossRefDirect Link - Bais-Moleman, A.L., R. Sikkema, M. Vis, P. Reumerman, M.C. Theurl and K.H. Erb, 2018. Assessing wood use efficiency and greenhouse gas emissions of wood product cascading in the european union. J. Clean. Prod., 172: 3942-3954.
CrossRefDirect Link - Bu, J., L. Yuan, N. Zhang, D. Liu, Y. Meng and X. Peng, 2019. High-efficiency adsorption of methylene blue dye from wastewater by a thiosemicarbazide functionalized graphene oxide composite. Diamond Rel. Mater., Vol. 101.
CrossRefDirect Link - Ali, N., H. Zaman, M. Bilal, A.U.H.A. Shah, M.S. Nazir and H.M.N. Iqbal, 2019. Environmental perspectives of interfacially active and magnetically recoverable composite materials–A review. Sci. Total Environ., 670: 523-538.
CrossRefDirect Link - Sharma, M.K. and R.C. Sobti, 2000. Rec effect of certain textile dyes in Bacillus subtilis. Mutat. Res./Genet. Toxicolo. Environ. Mutagen., 465: 27-38.
CrossRefDirect Link - Rasheed, T., M. Bilal, F. Nabeel, M. Adeel and H.M.N. Iqbal, 2018. Environmentally-related contaminants of high concern: Potential sources and analytical modalities for detection, quantification and treatment. Environ. Int., 122: 52-66.
CrossRefDirect Link - Kaushik, P. and A. Malik, 2009. Fungal dye decolourization: Recent advances and future potential. Environ. Int., 35: 127-141.
CrossRef - Li, Q., T. Zhao, M. Li, W. Li and B. Yang, 2019. One-step construction of pickering emulsion via commercial TiO2 nanoparticles for photocatalytic dye degradation. Appl. Catal. B: Environ., 249: 1-8.
CrossRefDirect Link - Okoya, A.A., A.B. Akinyele, I.E. Ofoezie, O.S. Amuda, O.S. Alayande and O.W. Makinde, 2014. Adsorption of heavy metal ions onto chitosan grafted cocoa husk char. Afr. J. Pure Appl. Chem., 8: 147-161.
CrossRefDirect Link - Amuda, O.S., A.A. Giwa and I.A. Bello, 2007. Removal of heavy metal from industrial wastewater using modified activated coconut shell carbon. Biochem. Eng. J., 36: 174-181.
CrossRefDirect Link - Kadirvelu, K., K. Thamaraiselvi and C. Namasivayam, 2001. Removal of heavy metals from industrial wastewaters by adsorption onto activated carbon prepared from an agricultural solid waste. Bioresour. Technol., 76: 63-65.
CrossRefDirect Link - Okoya, A.A., A.B. Akinyele, O.S. Amuda and I.E. Ofoezie, 2016. Chitosan-grafted carbon for the sequestration of heavy metals in aqueous solution. Chem. Sci. Int. J., Vol. 11.
CrossRefDirect Link - Okoya, A.A., A.B. Akinyele, O.S. Amuda and I.E. Ofoezie, 2015. Chitosan grafted modified maize cob for removal of lead and chromium from wastewater. Ethiop. J. Env. Stud. Manag., 8: 881-892.
CrossRefDirect Link - Chang, K.L.B., G. Tsai, J. Lee and W.R. Fu, 1997. Heterogeneous n-deacetylation of chitin in alkaline solution. Carbohydr. Res., 303: 327-332.
CrossRefDirect Link - Tsigos, I., A. Martinou, D. Kafetzopoulos and V. Bouriotis, 2000. Chitin deacetylases: New, versatile tools in biotechnology. Trends biotechnol., 18: 305-312.
CrossRefDirect Link - Dai, J., F. Ren and C.Y. Tao, 2012. Adsorption of Cr(VI) and speciation of Cr (VI) and Cr (III) in aqueous solutions using chemically modified chitosan. Int. J. Environ. Res. Public Health, 9: 1757-1770.
CrossRefDirect Link - Zhao, J., Y.J. Zhu, J. Wu, J.Q. Zheng, X.Y. Zhao, B.Q. Lu and F. Chen, 2014. Chitosan-coated mesoporous microspheres of calcium silicate hydrate: Environmentally friendly synthesis and application as a highly efficient adsorbent for heavy metal ions. J. Colloid Interface Sci., 418: 208-215.
CrossRefDirect Link - Nasirimoghaddam, S., S. Zeinali and S. Sabbaghi, 2015. Chitosan coated magnetic nanoparticles as nano-adsorbent for efficient removal of mercury contents from industrial aqueous and oily samples. J. Ind. Eng. Chem., 27: 79-87.
CrossRefDirect Link - Su, Y., Y. Jiao and C. Dou, 2014. Biosorption of methyl orange from aqueous solutions using cationic surfactant-modified wheat straw in batch mode. Desalin. Water Treat., 52: 6145-6155.
CrossRefDirect Link - Aroua, M.K., S.P.P. Leong, L.Y. Teo, C.Y. Yin and W.M.A.W. Daud, 2008. Real-time determination of kinetics of adsorption of lead (II) onto palm shell-based activated carbon using ion selective electrode. Bioresour. Technol., 99: 5786-5792.
CrossRef - Shirmardi, M., A. Mesdaghinia, A.H. Mahvi, S. Nasseri and R. Nabizadeh, 2012. Kinetics and equilibrium studies on adsorption of acid red 18 (Azo-Dye) using multiwall carbon nanotubes (MWCNTs) from aqueous solution. E. J. Chem., 9: 2371-2383.
CrossRefDirect Link - Bazrafshan, E., F.K. Mostafapour, A.R. Hosseini, A.R. Khorshid and A.H. Mahvi, 2012. Decolorisation of reactive red 120 dye by using single-walled carbon nanotubes in aqueous solutions. J. Chem.
CrossRef - Harrache, Z., M. Abbas, T. Aksil and M. Trari, 2019. Thermodynamic and kinetics studies on adsorption of Indigo Carmine from aqueous solution by activated carbon. Microchem. J., 144: 180-189.
CrossRefDirect Link - Kratochvil, D. and B. Volesky, 1998. Advances in the biosorption of heavy metals. Trends Biotechnol., 16: 291-300.
CrossRefDirect Link - Ignatowicz, K., 2009. Selection of sorbent for removing pesticides during water treatment. J. Hazard. Mater., 169: 953-957.
CrossRefDirect Link