
H. Samadi Boroujeni
Shahrekord University, Shahrekord, Iran
M. Fathi-Moghadam
Shahid Chamran University, Ahwaz, Iran
M. Shafaei-Bejestan
Shahid Chamran University, Ahwaz, Iran
Trends in Applied Sciences Research
Year: 2009 | Volume: 4 | Issue: 3 | Page No.: 148-157


ABSTRACT
In this study, the bulk density of fine sediments deposited behind Dez dam (near dam body) in Iran has been quantified by field investigation (one borehole closed to power intakes) and available empirical methods. Dez dam is located in the Southwest of Iran, completed in 1963, with the height of 203 m and original reservoir volume of 3315 million m3 (MCM). The result of bathymetry survey in 2003 show that the storage volume of the reservoir has been reduced to 2600 MCM by sedimentation and sediment level at upstream of the dam body has been raised to 256 m, i.e., only 14 m below the hydropower intake at elevation of 270 m. The field data from a deep borehole at bottom of reservoir close to the hydropower intakes have been collected and analyzed. Results show that the empirical methods proposed by Lane and Miller underestimate the bulk density of sediments by about 43 and 46%, respectively. This shows that the empirical methods can not be applied for predicting bulk density of fine sediments. A new set of equations is developed for predicting the bulk density of fine sediments.
PDF Abstract XML References Citation
How to cite this article
H. Samadi Boroujeni, M. Fathi-Moghadam and M. Shafaei-Bejestan, 2009. Investigation on Bulk Density of Deposited Sediments in Dez Reservoir. Trends in Applied Sciences Research, 4: 148-157.
URL: https://scialert.net/abstract/?doi=tasr.2009.148.157
URL: https://scialert.net/abstract/?doi=tasr.2009.148.157
INTRODUCTION
Sediment deposition is the principal problem affecting the useful life of reservoirs. When a river enters a reservoir the flow velocity decreases and the sediment load begins to deposit. The bed load and coarse fraction of the suspended load are deposited immediately to form delta deposits, while fine sediments with lower fall velocity are transported deeper into the reservoir (Arman et al., 2009). Most of sediments are transported within reservoir to the point of deposition by three processes; transport of coarse material as bed load along the top set delta deposits, transport of fine sediment in density currents and also as non-stratified flow. Accumulation of these sediments reduces the useful life of storage over time. Usually the concept of the reservoir half-time is the time required to infill half the original capacity is an indicator of the life of conventional storage reservoir. Because the efficiency of sediment trapping declines as reservoir capacity is reduced, the half-time does not represent half the time required to lose all storage reduced (Morris and Fan, 1998).
Computation of the storage useful life requires the knowledge of sediment trapping efficiency, the sediment unit weight or bulk dry density, the incoming flow and sediment. Unit weight, specific weight and bulk density are all used to express the dry weight per unit volume of a bulk sediment sample. The bulk density of sediment deposited is estimated in two-steps processes: first the bulk density of sediment in the first year of deposition is estimated as initial bulk density and in second step the effect of compaction with time is computed. Since, the void spaces between coarse grains are large enough, the water can freely escape through the grains. As a result coarse sediments achieve essentially final density as soon as they are deposited. Silt and clay, however, settle initially into a loose matrix with inter particle bridging resulting in a large volume of small water filled voids. When additional layer of sediment is deposited on the top of the previous layer, additional pressure is applied and as a result the bridges can collapse. This causes the bulk density of lower layer to increase over time. The rate of increase is much higher at the beginning and then the rate decreases (Samadi-Boroujeni et al., 2005).
The process of sediment consolidation has been studied by Bloomquist and Townsend (1984). They found that the consolidation process can be separated into four stages. The first which occurs during the initial hours of the process is defined as stabilization agglomeration. In the second stage, which is called the sedimentation stage the void ratio may reach to a meaningful value of 5. The time span required for this process is approximately one day (24 h). In the third stage, the density of the sediments increases to such an extent that the settling of the particles effect one another considerably, yet the accumulated sediments have not cohered into a solid block. This stage is best known as the hindered settling stage. In the experiments that were carried out, the void ratio parameter was between 5 to 3. In the fourth stage the sediments consolidate and the pressure upon them gradually increases and the void ratio decreases over time. This stage is known as the self-weight consolidation stage (Bloomquist and Townsend, 1984).
Since, field investigation of reservoir sedimentation is expensive, application of the empirical equation with limited number of laboratory experiments are usual in practice. However, where accurate investigation is required, field investigation is a must. Field investigation in 13 small flood retention ponds in central Belgium by Verstraeten and Poesen (2001) showed that dry sediment bulk density varies not only between the selected ponds (0.78-1.35 t m-3) but also within individual ponds (coefficient of variation at 95% ranges from 7 to 80%). They pointed that the existing empirical relations are not a reliable predictor for the observed dry bulk densities because these relations are primarily based on sediment texture. Also, in a research on Grenada Lake, bulk density for 47 continuous sediment cores, ranging in length from 0.55 to 2.55 m were measured (Bennett and Rhoton, 2003). Due to low rate of deposition, sediment layers were thin. For example, sediments in depth of 0.5 and 0.9 m were 30 and 48 years old, respectively. The texture of sediments was 25 clay, 68 silt and 8% sand. The bulk density of sediments was measured to be 850, 1000, 1100 for depths 0, 0.7, 0.9 m and ages 1, 38, 48 years, respectively.
Despite having many relationships for predicting the bulk density of deposited sediment in reservoirs, nothing is done to evaluate the accuracy of these methods, in particular for reservoirs with high rate of deposition. This study was conducted to find out accurate estimation of bulk density, texture and compaction of sediments deposited behind Dez dam wall. This also allowed evaluation of most common empirical relationships in prediction of bulk density through comparison of the results.
MATERIALS AND METHODS
Theory
Due to complexity of sedimentation and consolidation process, empirical relationships have been developed over the past years. Lara and Pemberton (1963) developed an empirical method for estimating the initial specific weight of sediment deposits based on the analysis of some 1300 sample from reservoirs in the following form:
W1 = WCPC+WMPM+WSPS | (1) |
where, W1 stands for the initial bulk dry density; PC, PM and PS represents the percentages of clay, silt and sand, respectively and WC, WM and WS are the initial bulk dry density for clay, silt and sand, respectively, in which their values depend on the reservoir operation method (Table 1). The initial bulk dry density can be obtained by the following empirical procedure:
| Table 1: | Coefficient B and initial bulk dry density values (kg m-3) for consolidation calculation |
 | |
| • | Dividing the sample into size groups and weight each size group |
| • | Mixing each size group with water in separate calibrated container and waiting until the particles are being settled |
| • | Measuring volume of the deposited materials, the initial bulk dry density for each group, then for whole sample can be calculated using Eq. 1 |
It should be noted that for a clay soil, parameters of PM and PS would be considered as zero. In computing the average compaction over a period of time, each year’s sediment deposits will have a different compaction time. The average density of all sediment deposited during t years of consolidation may be computed using the equation presented by Miller (1953):
| (2) |
where, Wt is the average bulk dry density after t years of consolidation, W1 is the initial bulk dry density and B is constant as given in Table 1. Miller (1953) assumed that sediment accumulation occurs at a constant rate every year.
Lane and Koelzer (1943) presented an empirical formula for the density-time relationship, which takes into account the grain size of the sediment and the method of operating the reservoir:
W = W1 + B (log t) | (3) |
where, W is bulk dry density of a deposit with an age of t years; W1 is the initial bulk dry density, usually taken to be the value after one year of consolidation; and B is constant. Both W1 and B are functions of sediment size and they are defined for different operational condition.
Parameter values are given in Table 1. For sediment containing more than one size class, a weighted value for the coefficient B should be computed.
Dez Dam
The Dez dam is located in the Zagros Mountains in the Southwest Iran and was constructed in 1963, with the height of 203 m. An underground powerhouse contains eight 65 MW units for a total installed capacity of 520 MW which has generated an average of 2400 GWh year-1 energy production over an operating period of 45 years. The minimum reservoir operation level is with the elevation of 300 m and the maximum controlled level is with the elevation of 352 m. The original reservoir volume was 3315 million m3, but the results of bathymetry survey in 2003 shows that the storage volume of the reservoir has been reduced to 2600 million m3 by the sedimentation which corresponded to a volume loss of about 19%. The incoming sediment has formed a delta which has proceeded about half-way down the 50 km long reservoir as well as bottom set stratified beds near the dam (Samadi- Boroujeni et al., 2005). The sediment level near the dam has risen at a rate of about 2 m year-1 over the operating period (Fig. 1, 2). Hence, the reservoir bed at the face of the power intakes has increased from an original elevation of 180 to 260 m in 2007, which is only 10 m below the invert level of the power intake at the elevation of 270 m. There is now concern that sediment will begin to be drawn into the power tunnels within a decade with potential damaging effects on the turbine runners and other water passage elements.
 | |
| Fig. 1: | Longitude profiles of Dez reservoir talweg versus years of dam operation |
 | |
| Fig. 2: | Increase of bed elevation (near Dez dam) versus time based on the reservoir bathymetry maps |
In addition, this deposition adjacent to the dam is now about 37 m above the low-level outlets within the dam body. This situation has an impact on the physical operations at the dam, including the irrigation outlets, power generation and reservoir operation (Samadi and Galay, 2005).
In order to decrease sediment level in front of the power intakes, operator of the Dez dam, Khusestan Water and Power Authority (KWPA), has a plan to open the low level outlet (i.e., irrigation outlets) for discharging the sediment deposited in front of the power intake as an operational program. In this regards, it is essential to determine the physical properties of the sediment deposited in front of the power intakes, so, KWPA arranged a field investigation for sampling of sediments by digging a deep borehole into sediment deposited in front of power plant intakes. The project was a part of a bigger project titled Remediation of Dez dam reservoir owned by Khuzistan Water and Power Authority of Iran which was conducted from 2004 to 2008. The field measurements data available in KWPA (2004) are analyzed and discussed in this study.
Field Measurements
Field measurement was conducted to obtain the undisturbed and disturbed samples from deposited sediment of Dez reservoir close to power plant intakes. Sediments deposited in Dez reservoir near the dam body have always been present as submerged sediments and thickness of water over the sediments has been more than 50 m during the operating period of 45 years. In order to survey the physical properties of sediment deposited in front of the power intakes, a deep borehole was dug near power intakes located at 100 m upstream face of the dam. The digger was installed on a barge, held by cables which were anchored to abutments as shown in Fig. 3. A piston-type core sampler was used to obtain samples. The sampler is operated by lowering it until the digger weight touches the sediment surface. With the digger weight resting on the bottom, further lowering of the sampler causes the digger arm to rise and release the coring head. As the cutting sloe is just about to penetrate the sediment, the sampler is penetrated into the sediment by hydraulic force, so, the sampler drives the coring tube into deposited sediment. The piston remains fixed as the outside tube moves past and serves to fold the undisturbed sample in the tube as it is withdrawn. The depth of sampling is 63 m in maximum state. During the sampling, the height of water above the sediment surface was 76 m (KWPA, 2004).
In the borehole, the collected sediments were very loose and disturbed down to the depth of 30 m. From depth of 30 to 63 m sediments were reported to be denser so undisturbed sampling was possible. This is a valuable experience for one is dealing with digging and differentiating the deposited fine sediments layers in large dam reservoirs.
In this study the bulk density of sediments was measured using ASTMD854 procedure and percentage of saturated water content was also determined by weighting method. The void ratio of the sediments was calculated based on the following relationship:
| (4) |
where, ρsat is the saturated density of the sediments, ρw density of water, Gs specific gravity of sediment solid. Based on the result of the experiments of the samples obtained from boreholes A and B, the average specific gravity of sediments (Gs) was 2.69.
The results of measured bulk density are presented in Table 2 and Fig. 4. The grain size distribution of obtained sediment samples from the boreholes is shown in Fig. 5.
 | |
| Fig. 3: | Photo of barge and digger located near Dez Hydropower intakes |
| Table 2: | Bulk density and void ratio of the borehole samples |
 | |
| *Elevation of reservoir sediment surface in the time of sampling was 256 m above sea level | |
 | |
| Fig. 4: | Measured bulk dry density versus sampling level above sea level |
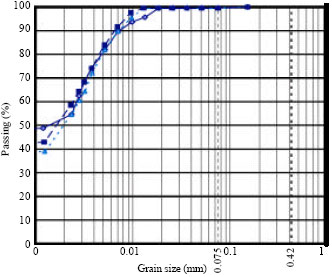 | |
| Fig. 5: | Grain size distribution curve for three samples |
RESULTS
Field measured data obtained from a deep reservoir are used to measured the bulk density of deposited sediment and evaluate the available empirical methods. To do this, the initial unit weight of deposited sediments was determined using Eq. 1. Based on the grain size distribution curve of the borehole samples (Fig. 5), the percentage of clay and silt content of the samples were 55 and 45%, respectively, therefore:
W1 = 416x0.55+1120x0.45 = 732.8 kg m-1 |
This value is an estimation of the initial bulk dry density for reservoir surface sediment layer that had a deposition time of less than 1 year. It should be noted that unit weight of sediment at the reservoir bed surface was measured a value of 825 kg m-3 which has 11% deviation from the calculated value by the equation.
Real data of this study is used to evaluate the capability of empirical equations for prediction of the bulk density of deep sediment deposited behind Dez reservoir. The empirical methods of Lane and Miller were used for this purpose. The required time duration was calculated from the reservoir height-volume curve which has been developed via reservoir bathymetry surveys in 1972, 1983, 1997 and 2003, as shown in Fig. 2. The time of deposited sediment can be estimated from the sediment level (Fig. 2). The deposition age of each layer, from its time of deposition to the year 2003 are presented in Table 3. Using these data, the bulk dry density of sediment samples was determined using equations of Lane and Miller in Table 3.
Table 4 shows capability of the empirical relations in prediction of the bulk density of deposited sediment. In Table 4, the measured bulk density has been compared with what it is predicted computed by Lane's method and Miller's method. The percent of error has been computed for each method. Figure 6 also shows computed bulk density versus the predicted one by Lane's method and Miller's method, respectively. As it can be seen from Table 4, both methods underestimate the bulk density of samples. The average errors for Lane's method and Miller's method are -43 and -46%, respectively.
Figure 4 shows increase of bulk density with sediment depth in a growth rate of 0.75%. This is true because sediments in lower level have been deposited earlier and have been compacted over time. Using Eq. 2 and 3, the bulk density grow rate with sediment depth is surprisingly calculated to be 0.15 and 0.05% by Lane's method and Miller's method, respectively.
Because of inaccuracy of the above empirical methods, the measured bulk dry density versus elapsed time for the borehole is drawn in Fig. 6. Based on Fig. 6 it is possible to calibrate the Lane's method and the Miller's method with the borehole data using the regression technique.
| Table 3: | Measured and calculated bulk dry density for samples from the borehole |
 | |
| Table 4: | Comparison of measured and calculated bulk density (kg m-3) for samples from the borehole |
 | |
 | |
| Fig. 6: | The measured bulk dry density versus elapsed time for the borehole |
The following relationships are obtained from the calibration of the Lane's equation and Miller's equation, respectively.
Wt = 739.74+460xLog (t) R2 = 0.948 | (5) |
| (6) |
where, Wt is bulk dry density after t years of consolidation (kg m-3).
DISCUSSION
The constant values in the developed relationships (Eq. 5 and 6) refer to the initial bulk dry density of the sediments (i.e., the bulk dry density of sediment surface) and their power coefficients reference the B parameter in Table 1. In Table 5 the parameters are calculated from Eq. 5 and 6 and are compared with the values in Table 1.
| Table 5: | Comparison of the coefficients derived from calibration of the empirical methods and the values obtained from Table 1 |
 | |
| akg m-3, bfrom Eq. 5 , cfrom Eq. 6 | |
The results show that the initial dry density calculated based on the Lane's method has a low difference with the value obtained from Table 1, while the coefficient B shows a substantial difference. Therefore, the error of the Lane's method and the Miller's method are significantly associated with estimation of the B coefficient. From Table 5, it can also be understood that the Lane's method is more accurate than the Miller's method in practice. This is in agreement with the results in Table 4.
Most empirical methods are relayed on the sedimentation time variation and do not account for the effects due to depth variation of sediments and compaction of the sediments under the upper layers' loads. This is the main reason for inaccuracy of empirical methods particularly for reservoirs with high rate of deposition and thick layers of sedimentation like in Dez reservoir. To prove this hypothesis, the measured bulk densities reported by Bennett and Rhoton (2003) for Granada lake have been compared with the bulk densities calculated by empirical methods and the acceptable differences in range of 6 and 7.3% for Lane and Miller methods were obtained, respectively. The low thickness of sediments was the main reason for accurate estimation of empirical methods.
CONCLUSION
The conclusions of this study are summarized as follow:
| • | Sediment deposited near Dez dam body was fine sediment with texture of 55% clay and 45% silt. The deposited sediments in upper layers are very loose, disturbed and un-compacted in first 30 m |
| • | The bulk density of the sediments increases with depth almost with the growth rate of 0.75%, while it is calculated to be 0.15 and 0.05% by Lane's method and Miller's method, respectively |
| • | Comparison of the measured bulk density and calculated by Lane's method and Miller's method show that both methods underestimate the bulk density of fine sediments. The errors associated with Lane's method and Miller's are estimated to be -43 and -46%, respectively |
| • | The calibration of the lane's equation and Miller's equation show that the initial dry density calculated based on the Lane's method has a low difference with the corresponding value obtained from Table 1, while they have substantial difference in prediction of the coefficient B. The Lane's method shows to be more accurate than the Miller's method for fine sediments |
| • | More investigation on processes of sedimentation in large dam reservoirs is suggested in order to account for the depth variation effects and development of an accurate empirical method for estimation of dry bulk density and other physical properties of sediments |
ACKNOWLEDGMENTS
The authors acknowledge the Shahid Chamran University of Ahwaz and Shahrekord University of Iran and Khuzistan Water and Power Authority for financial support (Grant No.: KWPA-82-HM33) and facilitation of the experiments.
REFERENCES
- Arman, A., M. Fathi-Moghadam, H. Samadi and S. Emamgholizadeh, 2009. Fall velocity of cohesive sediments in dez dam reservoir. Res. J. Environ. Sci., 3: 71-79.
CrossRefDirect Link - Miller, C.R., 1953. Determination of the Unit Weight of Sediment for use in Sediment Volume Compaction. In: Reservoir Sedimentation: technical guideline for Bureau of Reclamation, Strand, R.I. and Penibertori, E.L. (Eds). USBR, Denver, USA.
Direct Link - Samadi, H. and V.J. Galay, 2005. Turbidity current measurements within the Dez reservoir, Iran. Proeedings of the 17th Canadian Hydrotechnical Conference, Hydrotechnical Engineering: Cornerstone of a Sustainable Environment, August 17-19, 2005, Edmonton, Alberta, pp: 127-127.
Direct Link - Verstraeten, G. and J. Poesen, 2001. Variability of dry sediment bulk density between and within retention ponds and its impact on the calculation of sediment yields. J. Earth Surface Processes Landforms. 26: 375-394.
CrossRef