
Arun Sharma
Department of Computer Science and Engineering, Krishna Institute of Engineering and Technology, Ghaziabad, Gautam Buddh Technical University, Lucknow, India
Swati Agarwal
Department of Computer Science and Engineering, Krishna Institute of Engineering and Technology, Ghaziabad, Gautam Buddh Technical University, Lucknow, India
Research Journal of Information Technology
Year: 2012 | Volume: 4 | Issue: 1 | Page No.: 22-30


ABSTRACT
Pattern Analysis has currently become a topic of discussion. A lot of research has been done in the field of Complex Pattern Analysis. It involves automatic detection of patterns in data from the same source and making prediction of the new data coming from the same source. Various techniques were developed which took either one or multiple dimensionalities into account to analyze the existing patterns and predicting the future values. Temperature prediction is a complex process and a challenging task for researchers. It includes expertise in multiple disciplines. The prediction of atmospheric parameters is essential for various applications. Some of them include climate monitoring, drought detection, severe weather prediction, agriculture and production, planning in energy industry, aviation industry, communication, pollution dispersal etc. Accurate prediction of weather parameters is a difficult task due to the dynamic nature of atmosphere. Various models have been developed for predicting the temperature which is based on neural network, fuzzy approach etc. In this paper, wavelet neural network approach is used for temperature prediction. This paper aimed in using wavelet neural networks approach using multiple factors to predict the data values. Temperature data of Taipei, Taiwan of the year 1995-96 is used for result verification. The results obtained are compared with that of other techniques and are found to be better.
PDF Abstract XML References Citation
Received: August 19, 2011;
Accepted: November 29, 2011;
Published: January 09, 2012
How to cite this article
Arun Sharma and Swati Agarwal, 2012. Temperature Prediction using Wavelet Neural Network. Research Journal of Information Technology, 4: 22-30.
URL: https://scialert.net/abstract/?doi=rjit.2012.22.30
URL: https://scialert.net/abstract/?doi=rjit.2012.22.30
INTRODUCTION
Complex pattern analysis is an active field for researchers in the past few years. It is a very challenging task as a large no of disciplines are involved in it. Pattern analysis involves two major things Time Series Analysis and pattern Mining. Both factors play an important role when forecasting is required. Forecasting play a vital role in our day to day life. Forecasting can be done in various fields like weather, stock market, economy, population growth, business prospects etc. however it is obvious that there are many factors affecting the occurrence of an event. There are also complex relationships which exist among the factors. Since all factors cannot be analysed and considered so it becomes a difficult task to choose among the various factors. The choice can be made by analysing the impact of the factors affecting the event.
Pattern recognition: Humans have high capability of sensing the surroundings and predict the things. If we want to incur the same capability in the machines we need to train them with the past values and provide them with certain algorithms to create a pattern and predict the future values based on the learning. This capability is known as pattern analysis. Patterns can be considered as a Template or Model which can be used to generate things or parts of thing, especially if the things that are created have enough in common, for the underlying pattern to be inferred (Holmstrom and Koistinen, 2006).
Pattern recognition is the research area that studies the operation and design of systems that recognize patterns in data. It encloses sub disciplines like discriminate analysis, feature extraction, error estimation, cluster analysis (together sometimes called statistical pattern recognition), grammatical inference and parsing (sometimes called syntactical pattern recognition). Important application areas are image analysis, character recognition, speech analysis, man and machine diagnostics, person identification and industrial inspection (Chen, 2005).
Pattern recognition can also be seen as a classification process. Its ultimate goal is to optimally extract patterns based on certain conditions and is to separate one class from the others. Pattern recognition was often achieved using linear and quadratic discriminate, the k-nearest neighbour classifier or the Parzen density estimator, template matching and Neural Networks. These methods are basically statistic (Bishop, 2010). The problem of using these recognition methods has to construct a classification rule without having any idea of the distribution of the measurements in different groups. Support Vector Machine (SVM). SVMs have gained prominence in the field of pattern classification, they are forcefully competing with other techniques such as template matching and Neural Networks for pattern recognition (Lihong and Xiangjian, 2005).
Time series analysis: A time series is a collection of observations of well-defined data items obtained through repeated measurements over time (Olayemi, 2007). Time series analysis comprises methods for analyzing time series data in order to extract meaningful statistics and other characteristics of the data.
The analysis of time series focuses on three basic goals:
| • | Forecasting (or predicting) near-term progressions |
| • | Modelling long-term behaviour |
| • | Characterizing underlying properties |
Time series prediction is to predict value y(t+k) of future time t+k (k>0) on the basis of real history data of time series { y(t), y(t-1),….., y(t-m+1)} and corresponding variance which influence the time series, that is, to find the relationship between future value y(t+k) and history data {y(t), y(t-1),….., y(t-m+1)}, variance {x1(t), x2(t), xn(t)} (Lin et al., 2006).
LITERATURE SURVEY
Song and Chissom (1993, 1994) developed certain forecasting methods to forecast university enrolments, where the historical enrolments of the University of Alabama is used to illustrate the forecasting process. In this work forecasting is done in terms of fuzzy sets where union of fuzzy relations and Max-Min composition operators were used. Since these operators have high complexity of the order of O (kn2) where k is the number of fuzzy logical relationships and n is the No. of elements of the universe of discourse, certain other methods were developed. The best error rate achieved by this technique was 3.2%.
Chen and Hwang (2000) developed the algorithms A, B and B* for prediction. Chen (2005) used the same data of the University of Alabama and proposed a new method based on time-variant fuzzy time series to deal with the forecasting problem. The method was based on the concept that the values of the present are somehow related to the trends in the past. Thus it overcame the forecasting problems in which the historical data were represented by linguistic values. To illustrate this author developed a relationship between the variations of past years based on which the forecasting of the current year was done. The technique not only reduced the error rate to 3.12% but also simplified the arithmetic operation process by reducing the complexity to O (wn).
Chen and Hawang (2000) named the algorithm developed by Hwang et al. (1998) as algorithm-A and extended it as algorithm B based on the fact that an event may be affected by several factors. So, one factor approach used in algorithm A may not be enough to predict values correctly. Algorithm A (Hwang et al., 1998), used one factor time variant fuzzy time series for prediction. In this paper, a new fuzzy time series model called “The two factor time-variant fuzzy time series model” to deal with forecasting was proposed. Based on this a new algorithm called algorithm-B was developed which used temperature (first factor) and cloud density (second factor) data of the year 1996 (June) to 1996 (September) of Taipei, Taiwan for temperature prediction. Also the same prediction of the temperature data of Taipei was done using algorithm A. Further algorithm-B was modified into Algorithm-B* to further reduce the error. In this algorithm, the fuzzified data values were checked for a threshold, any value which crossed the threshold retained their value, rest all the values were turned to zero. This was done to remove noise from data. The minimum error rate of 2.77% was achieved. The results obtained from all the three algorithms were compared.
Riordan and Hansen (2009) described a case based forecasting in which the application of airport weather forecasting is used. This technique used fuzzy similarity measure to find the k-nearest neighbours from the database. These neighbours are adapted to produce the values for forecast parameters. When minute forecasting knowledge of the climate of a particular reason is used by forecasters the technique is called climatologically forecasting. The accuracy of forecasting can be considerably improved by querying a database for past cases similar to present using fuzzy similarity and k-nearest neighbour technique.
Pal et al. (2003) showed the effectiveness of multilayer perceptron networks (MLP’s) for prediction of the max and min temperatures based on past observations. For this purpose various atmospheric parameters were taken into account. For prediction using multiple factors a neural network architecture that combines SOFM and MLP and forms hybrid network SOFM-MLP is proposed. This model improved the prediction rate but since many parameters were taken into account the model lacked accuracy. To improve upon it a Feature Selection MLP (FSMLP) was used instead of MLP. This was based upon the observation that use of appropriate feature improves prediction accuracy. FSMLP is used as a pre-processor to select good feature. It also reduced the No. of factors required for good prediction. Though there was a marginal improvement in the results of SOFM-MLP using FSMLP but it certainly shows that we can use only some important features to get a good result.
From the above used references, it was concluded that an event in this real world is affected by many factors. Therefore, if we consider appropriate No. of factors for prediction we can achieve better forecasting results. Thus a new method of prediction was proposed by Lee et al. (2006). The temperature of Taiwan and the Taiwan Futures Exchange (TAIFEX) were used to verify results using two factor high-order fuzzy time series. The proposed method constructs two factors high-order fuzzy logical relationships based on the historical data to increase the forecasting accuracy. The temperature data of Taipei for the year 1996 was used for prediction with temperature as first factor and cloud density as the second factor.
Sharma and Manoria (2006) presented a new approach using soft computing technique i.e., a neuro-fuzzy system is used for prediction of metrological positions on the basis of a weather system designed by the author. The model was designed on the basis of Adaptive Forecasting Model (AFD).This model was able to capture the complex relationships which exist between the various factors affecting the weather conditions. This paper proved that the weather conditions do depend on various factors and also those factors are interdependent i.e. a complex relationship exist among the various factors.
Hayati and Mohebi (2007a) applied neural networks to design Short Term Temperature Forecasting (STTF). MLP architecture of neural network was used to design STTF. The MLP was trained using the past data and hence proved to be a strong tool for prediction of temperature with pretty good accuracy.
Radhika and Shashi (2009) came up with an application of Support Vector Machines (SVM) for weather prediction. Time series data of daily maximum temperature at a location was analysed to predict the maximum temperature of the next day at that location based on the daily maximum temperature for a span of previous n days referred to as order of the input. Non linear regression method was found to be suitable to train the SVM for this application. Support Vector Regression (SVR) was used to predict the maximum temperature at a place. SVR was different from conventional regression techniques because it used Structural Risk Minimization (SRM) but not Empirical Risk Minimization (ERM) induction principle which is equivalent to minimizing an upper bound on the generalization error and not the training error. This paper proved that the results of prediction were better than those achieved using ANN as ANN suffered drawbacks like local minima, model over fitting etc.
Baboo and Shereef (2010) presented a neural network based algorithm for predicting the temperature. The network used is Back Propagation Neural Network. The advantage of this network is that it can fairly approximate a large class of functions. The model generated here was able to capture the relationships which exist among the various factors affecting the temperature of a place.
Li and Cheng (2010) used forecasting model based on Hidden Markov Model (HMM). It extended the model suggested by Sullivan and Woodall which was used to handle one factor problem, for handling two factor forecasting problems. Monte Carlo method was adopted to estimate the outcome. They also used the temperature data of Taipei to verify their experimental results. This technique gave fairly good results. But HMM itself suffers from certain limitations as in it the observed and hidden states are probabilistically related which does not hold for all problems.
Rastogi et al. (2011) came up with the new approach of using Wavelet Neural Network (WNN) for temperature prediction. This technique outperforms all the existing methods by achieving pretty good accuracy in prediction. The existing techniques (Pal et al., 2003; Baboo and Shereef, 2010; Hayati and Mohebi, 2007b) which used neural network for prediction often suffer from problems of local minima and over fitting. But use of wavelets along with the back propagation network over comes with all such problems and thus generates a robust model for prediction. In this the author has used the past years data to train the network and also the present years data of previous month is added to make the results more accurate. In this work only one factor is used for prediction with the assumption that one factor is sufficiently enough for giving much accurate results. The temperature data of Taipei of the year 1995 and 1996 is used for analysing the results. And it was found that the error rate was considerable reduced.
MOTIVATION FOR WORK
From the literature survey it can be concluded that occurrence of an event depends upon many factors. Rather we can say that there are many factors contributing to the occurrence of an event. Thus many researchers have taken one factor approach for predicting the future values. But since these events share a complex relationship among them. Thus occurrence of an event cannot be predicted by a single factor with sufficient amount of accuracy.
As mentioned in the literature survey there was various prediction approaches which used fuzzy theory. Though they gave out good results but these approaches lacked in accuracy and the process was very complex. Certain improvements were done in it by various authors and were able to reduce the complexity to some extent, but lacked in improving the results. These approaches initially used only single factor to predict the results. And as mentioned above one factor was not enough for giving good prediction results. Thus for improving the results further enhancements were done by various researchers by adding one or more factors to it and the techniques showed considerable improvements. Hence the theory became more prominent that adding more factors will add more accuracy to the results. Thus giving us the motivation for adding more factors to the existing technique and improve the results.
After fuzzy, neural network approach for prediction was introduced and experiments were done by using various different networks like multilayer perceptron network etc. various other approaches were also used for prediction using ANN which were able to make prediction with good amount of accuracy. Also Neural network approach using wavelet was used for prediction but the author used the notion that one factor might be sufficient for prediction. The technique was able to reduce the error up to a good level. But sticking to the existing notion we in our work implemented the same technique but tried to add another factor with it.
In this work, we will be implementing the Wavelets neural networks approach using two factors for prediction. We will apply the technique for temperature prediction. We will be taking the temperature and cloud density data of Taipei of year 1995 and 1996 for the verification of approach.
PROPOSED APPROACH FOR TEMPERATURE PREDICTION
This study aims at prediction of temperature. Since we have already discussed that temperature of a place depends on many local atmospheric phenomena’s occurring at that place. But in general the trend of temperature in past years proves to be of great help in predicting the temperature. For the purpose time series analysis methodology is applied. According to which based on the values in past certain trends are recognised. And it is assumed that the current values or trends can be predicted based on those in the past. When temperature prediction is considered the atmospheric conditions of a place have almost remains the same with slight changes in its time of occurrence and magnitude. Also the values of the governing factors depend upon the past years and hence remain almost unchanged during any part of the year. The atmospheric conditions repeat themselves over time and are periodic in nature.
For example, the atmospheric pressure in summers is low as compared to winters or the humidity and cloud density is maximum during rainy seasons. Thus every year they have more or less the same value. This gives us the motivation to use the past year values for predicting the current years temperature values.
The above notion does not mean that we will be having the same values for the current year as were in past but we will be able to provide the past data as an input for training the model to predict the temperature for the current years. The pattern of the temperature changing along the months remains the same with some rise in the magnitude. The rise in temperature could be the effect of increase in population, pollution, green house effect causing global warming. This may lead to the shift in temperature pattern of the current year a few days. Thus by analysing this we can predict the way in which the values will change. This helps in supervising the predictability of the temperature more accurately.
MODEL SPECIFICATION
Data selection: For temperature prediction first of all the date is selected, for which the temperature is to be predicted. This day is treated as the center of sphere. Also the sphere of influence is selected. If we want to predict the temperature of 10 August 1996 we will take into consideration the temperature and cloud density between 20 July 1995 and 30 August 1995 (approximately). This duration will be considered as the sphere of influence. This sphere of influence is taken into account with the fact that the temperature observed in the current year can be influenced by the nearby days of the previous years. Thus we must be having sufficient information about the past years so that the sphere of influence can be selected. The size of the data to be analyzed is 32. This value is in agreement with the size of data requirement of HAAR wavelet. Beside this, 15-20 days data of the current year immediately before the prediction day is added to make the prediction more accurate and specific. The window size used is 3. Also the previous year data is decomposed using HAAR decomposition. This provides a generalized view thus eliminates the problem of over-fitting the data while training the neural network.
Simulation: One of the characteristic of neural networks is that they are not programmed rather they are trained (Neural Network Toolkit/mat lab). Thus we will be training the neural network with the help of previous year data of the same month. And also with the decomposed values, certain training inputs are provided to the network using which they generalize and adapt the trends. There after they are able to use their knowledge in giving the output when certain inputs are given. Thus, the data after pre-processing is used for simulating the network.
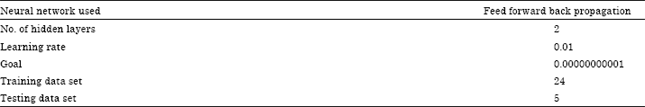
Training the network: Network model is trained with the data of the last year of the same month for which prediction in the current year is to be done. To this, specifications are added by training it with the temperature and cloud density data from present year till the date after which the value is to be predicted (Table 1).
Prediction: Once the training of the network is being done it is provided with the actual input which is the past 3 days value of temperature and cloud density. Using this input now the network predicts the output. We now compare the predicted value with the actual output to calculate the error in prediction.
| Table 1: | Data for simulation and training of network |
 | |
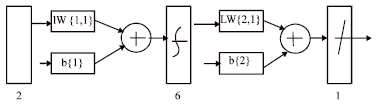 | |
| Fig. 1: | Model used for training the network |
This process is repeated for all the data available and at the end the average error is calculated to analyse the efficiency of the network. Model used for Training the Network has been shown in Fig. 1.
Steps used: We have used the following steps:
| • | Analyse the correlation between the data of the two consecutive years |
| • | Perform pattern mining |
| • | Correlate the two series (corresponding to the year 1995 and 1996) i.e., keeping one constant and shifting the other |
| • | Observe a point where the Euclidian distance between the two points is nearly constant |
| • | Apply HAAR wavelet decomposition to the previous year data to generate a generalized model |
| • | Simulate the model using the model generated using neural network toolkit in MATLAB |
| • | Train the network using the last year’s data (1995) |
| • | To add details train it with the 15-20 days data of the same year (1996) and month, i.e., the temperature and cloud density of the few days before the prediction day |
| • | Give 3 day consecutive data as input to the network |
| • | The network will now generate the future value as output |
| • | Compare it with the already present data and calculate the error. (Mean square error, error variance, averaging etc.) |
EXPERIMENTAL RESULTS
The temperature and cloud density data of Taipei of the year 1995 and 1996 (Li and Cheng, 2010) was used for verifying the results obtained from the model generated. Four months data i.e., June, July, August and September were used as inputs. The temperature and cloud density data of these four months of the year 1995 was given as input and the output achieved is the predicted temperature of the year 1996. Then this predicted value is compared with the actual available temperature data of the year 1996. The difference in both the values gave the error. The errors in the predicted temperature are calculated for each day of all the four months (data not shown). Then the average error for the month is calculated which is compared with the errors generated from the other techniques. The comparison is done with the techniques that used the same data of Taipei for the month of 1995-96 and calculated the average error.
From the above mentioned table it is quite clear that we are able to prove our aim of achieving better results when we added another factor to the existing technique. Thus we were able to improve the results to a considerable amount in comparison to the other techniques. Initially fuzzy logic techniques were used for prediction with either one or multiple factors. The techniques were able to give good results but error rates were high. Further higher order fuzzy logic came up which were able to further improve the results to a large amount.
| Table 2: | Comparison with other techniques (Average Error) |
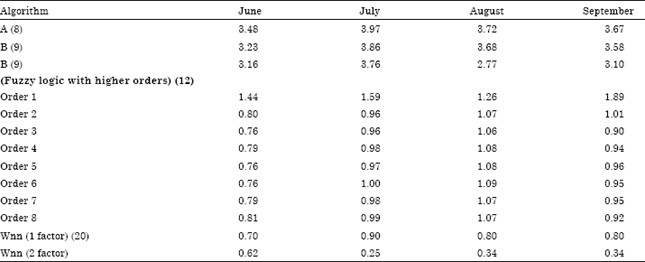 | |
After which a Wavelet Neural Network approach came which used one factor for predicting the results that was able to make considerable improvements in the results. But we implemented the technique and added one more factor to it.
Adding one more factor brought the error rate down to a large extent. We have taken the data of Taipei for the year 1995 and 1996 to prove the technique and we have shown the results in the above mentioned tables. We have calculated the errors and also have shown the comparison with the existing techniques. This comparison proved that using multiple factors for prediction considerably improves the results.
CONCLUSION
This study aims of implementing and enhancing the existing technique of Wavelet neural network by adding another factor to it and hence improving the results. From the experimental results mentioned in Table 2, we reach to the conclusion that the two factor approach which was used for temperature prediction gives results which are far better than various other techniques developed so far. This technique was able to reduce the error rate considerably. As future scope, a much better generalized approach is expected if we consider the data over the past many years, trained in the order of their occurrence. Also we could even add more factors and can see the cumulative effect of those factors on the future predictions.
REFERENCES
- Holmstrom, L. and P. Koistinen, 2006. Pattern recognition. Wiley Interdisciplinary Rev. Comput. Stat., 2: 404-413.
CrossRefDirect Link - Chen, L., 2005. Pattern classification by assembling small neural networks. Proc. Int. Joint Conf. Neural Networks, 3: 1947-1952.
CrossRef - Lin, S., G. Wang, S. Zhang and J. Li, 2006. Time series prediction based on support vector regression. Inform. Technol. J., 5: 353-357.
CrossRefDirect Link - Song, Q. and B.S. Chissom, 1993. Forecasting enrollments with fuzzy time series-Part I. Fuzzy Sets Syst., 54: 1-9.
CrossRefDirect Link - Song, Q. and B.S. Chissom, 1994. Forecasting enrollments with fuzzy time series-Part II. Fuzzy Sets Syst., 62: 1-8.
CrossRefDirect Link - Hwang, J.R., S.M. Chen and C.H. Lee, 1998. Handling forecasting problems using fuzzy time series. Fuzzy Sets Syst., 100: 217-228.
CrossRef - Chen, S.M. and J.R. Hawang, 2000. Temperature prediction using fuzzy time series. IEEE Trans. Syst. Man Cybern B Cybern, 30: 263-275.
PubMed - Riordan, D. and B.K. Hansen, 2009. A fuzzy code-based system for weather prediction. Eng. Int. Syst., 10: 139-146.
Direct Link - Pal, N.R., S. Pal, J. Das and K. Majumdar, 2003. SOFM-MLP: A hybrid neural network for atmospheric temperature prediction. IEEE Trans. Geosci. Remote Sensing, 41: 2783-2791.
CrossRefDirect LinkINSPEC - Lee, L.W., L.H. Wang, S.M. Chen and Y.H. Leu, 2006. Handling forecasting problems based on two-factors high-order fuzzy time series. IEEE Trans. Fuzzy Syst., 14: 468-477.
CrossRef - Sharma, A. and M. Manoria, 2006. A weather forecasting system using concept of soft computing: A new approach. Proceedings of the International Conference on Advanced Computing and Communications, December 20-23, 2006, Surathkal, pp: 353-356.
CrossRef - Hayati, M. and Z. Mohebi, 2007. Application of artificial neural networks for temperature forecasting. World Acad. Sci. Eng. Technol., 1: 654-658.
Direct Link - Hayati, M. and Z. Mohebi, 2007. Temperature forcasting based on neural network approach. World Applied Sci. J., 2: 613-620.
Direct Link - Radhika, Y. and M. Shashi, 2009. Atmospheric temperature prediction using support vector machines. Int. J. Comput. Theory Eng., 1: 55-58.
Direct Link - Baboo, S.S. and I.K. Shereef, 2010. An efficient weather forecasting system using artificial neural network. Int. J. Environ. Sci. Dev., 1: 321-326.
Direct Link - Li, S.T. and Y.C. Cheng, 2010. A stochastic HMM-based forecasting model for fuzzy time series. Inst. Electr. Electron. Eng. Trans. Syst. Man Cybern. Part B: Cybern., 40: 1255-1266.
CrossRef - Rastogi, A., A. Srivastava, V.K. Srivastava and A.K. Pandey, 2011. Pattern analysis approach for prediction using wavelet neural networks. Proceedings of the International Conference on Natural Computation, July 26-28, 2011, Shanghai, pp: 695-699.
CrossRef