
Ahmed A. Al-Naim
Department of Soil and Environmental Sciences, King Faisal University, P.O. Box 380, Hofuf, Al-Ahsa, 31982, Kingdom of Saudi Arabia
Research Journal of Environmental Toxicology
Year: 2014 | Volume: 8 | Issue: 3 | Page No.: 124-135


ABSTRACT
Presently there is growing concern regarding groundwater quality degradation and water level depletion in the potential agricultural areas of the Kingdom of Saudi Arabia. The main objective of this study was to determine the effect of excess pumping on groundwater salinity and water level for increasing agricultural production in Region, Saudi Arabia. The study results showed that net water withdrawal from the small aquifer was 99% with only 0.84% annual recharge. Mean groundwater level depletion was 25 m over a period of 12 years (2002-2013 period) i.e., 33 m in the unconfined zone and 18 m in the confined zone. Overall mean annual water drawdown was 2.6 m in the study area i.e., 2.7 m in the unconfined zone and 4.4 m in the confined zone. Water quality deterioration (total water salinity) was high in the unconfined zone where TDS increased from 950-1180 ppm as compared to the confined zone where it increased from 600-700 ppm in the Saq aquifer. In conclusion, the study provided a useful tool in the form of mathematical equations for predicting the water salinity degradation both in the unconfined and confined zones for planning future water management strategies in Ha’il region.
PDF Abstract XML References Citation
How to cite this article
Ahmed A. Al-Naim, 2014. Effect of Excess Pumping on Groundwater Salinity and Water Level in Hail
Region of Saudi Arabia. Research Journal of Environmental Toxicology, 8: 124-135.
DOI: 10.3923/rjet.2014.124.135
URL: https://scialert.net/abstract/?doi=rjet.2014.124.135
DOI: 10.3923/rjet.2014.124.135
URL: https://scialert.net/abstract/?doi=rjet.2014.124.135
INTRODUCTION
Saudi Arabia is a vast country covering a total area of 2.25 million square kilometers. It is located in an arid region with the Red Sea bordering its western coast and the Arabian Gulf along its eastern coast. The country is characterized by a hot dry climate with a mean annual rainfall range in between 25-150 mm in about 80% of the country. This gives rise to serious limitations on the use of shallow aquifers to meet the increasing demand of water for domestic, industrial and agricultural purposes, especially during dry periods, when the extraction from the existing groundwater aquifers often exceeds the replenishment in arid regions. Water resources in their natural state are limited and non-renewable in Saudi Arabia similar to any arid region of the world. Since, the country falls in arid to semi-arid climate zone and there are no rivers, lakes or permanent running streams. But the country is blessed with many aquifers containing huge reserves of groundwater. Therefore, efficient management of these aquifers is of great importance for sustainable irrigated agricultural activities in the country. In Saudi Arabia, there are seven major deep aquifers, covering hundreds of square kilometers and extending from the Jordanian boundary in the north to the southern and eastern boundaries of the country.
Agriculture sector is next to oil as a source of economy in the Kingdom of Saudi Arabia. Generally, around 80-85% of water requirements are met from groundwater sources (Ministry of Agriculture and Water, 1984). The Saq aquifer, a water-bearing formation in Ha’il Region, is considered as the oldest and the largest aquifer in the northern part of the country. According to an estimate (Khordagui, 1996), the population of Saudi Arabia is expected to increase from 20.7 millions in 2000-44.7 millions in 2025 which is expected to place great stress on the existing limited water sources. Groundwater quality is one of the main factors determining its suitability for drinking, domestic, agricultural and industrial purposes (Subramani et al., 2005). As such, water is the most important constraint for future development in this region (Lashkaripour et al., 2005). A review of literature showed that a very little work has been accomplished on the effect of pumping on the degradation of water quality, especially the total water salinity for irrigation, in the potential agricultural areas of Saudi Arabia.
Qahman et al. (2009) applied two multi-objective management models in a coastal aquifer to maximize the total volume of water pumped, minimizing the salt concentration of the pumped water and controlling the drawdown limits on a part of the aquifer with 9 existing pumping wells located at various depths. The study showed that the optimum pumping rate is in the range of 26-34% of the total natural replenishment and the proposed technique is a powerful tool for solving this type of management problems. Soni and Pujari (2010) analyzed the hydro-chemical data of groundwater samples of three different limestone mine sites, which are in close proximity and covers a tract along the Gujarat Coast of Indian peninsula. They found sea water intrusion in the coastal aquifer in the study area and recommended measures for sustainable use of groundwater by the mining companies and other stake holders. Kenabatho and Montshiwa (2006) stated that Water is an essential resource affecting many aspects of development and the natural environment. They concluded that with the current fragmented, uncoordinated institutional and legal arrangements in water resources management, there is an urgent need to adopt integrated water demand management as envisaged in the overall concept of Integrated Water Resources Management (IWRM). Segosebe and Parida (2006) stated that water is one of the most important elements essential not only to attain food and health security but also for the economic development of a country. They examined the various strategies in a semi-arid country like Botswana to manage the growing demand for water. These strategies encompass the use of tariffs, water reuse/recycling and water restrictions. Other attempts encourage water conservation through rainwater harvesting and implementation of technological innovations with exploration of non-conventional sources. Khadim et al. (2013) developed a mathematical formula to assess the rate of tidal sedimentation due to Tidal River Management (TRM) in parts of Khulna and Jessore districts. The study found the evidences of considerable advancements in regional livelihood i.e., flood resistance, cultivated lands, cultivable area, cropping intensities and food security due to Integrated Water Resources Management (IWRM) approaches. Therefore, the main objective of this study is to determine the effect of pumping on groundwater salinity and water level in Ha’il Region for sustained agricultural production.
Location of study area: The study area was selected lies on the south-eastern part of Ha’il Region. It situated between longitude 42°26'-42°48' E and latitude 27°23'-27°31' N, with total land area of about 160 km2 in conical shape 200 km2 (Fig. 1).
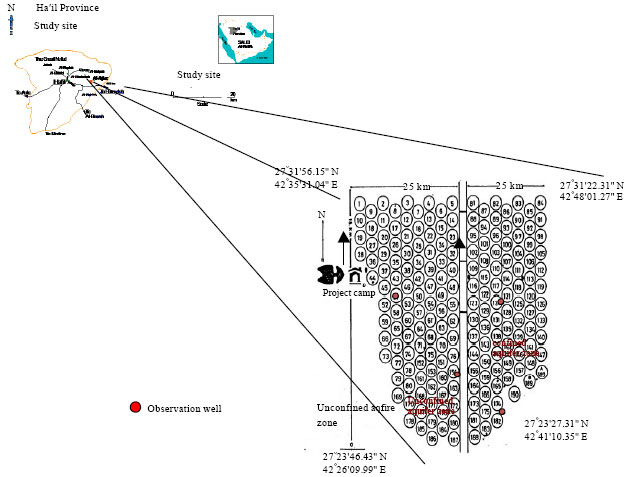 | |
| Fig. 1: | Location of the study area (NADIC Ha’il Project) (190 well) |
MATERIALS AND METHODS
Water level of the aquifer was measured from four observation wells in the study area (Fig. 1). Water samples were also collected from three other wells in the Arabian Shield to determine groundwater salinity from the bottom of aquifer. These three wells are located 28 kilometres away from the south-western part of the study area representing the base of Saq aquifer. The thickness of the interval between the bottom of wells and the base of the aquifer (Zb) was calculated from the well depth and the total depth of the basement rocks. Water samples were collected from the aquifer at the time of water level for measuring the total water salinity according to methods described in USDA (1954).
The following equations were used to calculate water level in the study area.
Unconfined zone:
| (1) |
Confined zone:
| (2) |
where, WL is the water level (m) as a function of time in years (X) above sea level.
Data analysis: Data were analyzed by ANOVA and regression techniques at 5% level of significance according to SAS (2001).
RESULTS AND DISCUSSION
Temporal water quality degradation: Water quality is determined by the concentration of different types of salts in water. It is well known that depletion of groundwater level by continuous pumping from an aquifer may degrade water quality resulting its unsuitability for various uses. The influence of excess pumping of groundwater on water level in the aquifer from 2002-2013 is presented in Fig. 2. Mean groundwater level depleted from 526-597 m above sea level in six observation wells observation wells from 2002-2013. The net depletion in groundwater level was around 71 m, which indicated un-necessary pumping of groundwater in the region to meet the growing water demand for various uses in the region with particular reference to agricultural production.
Spatial degradation of water quality: Groundwater quality in an aquifer varies with depth due to aquifer geology and other rock formation having different chemical characteristics. Michael (1978) observed water quality deterioration with depth in several locations in Delhi territory, India. The results showed that total groundwater salinity of the aquifer degraded in the unconfined zone due to excess pumping resulting in up-coning of more mineralized water from the lower depths. Also, deep percolation of highly saline drainage water from over irrigation and run off losses from irrigated fields may be the cause for water quality degradation in the aquifer. A positive relationship was observed between the well depth and water salinity in both the unconfined (R2 = 0.914) and confined zone (R2 = 0.998) of Saq aquifer in the study area (Fig. 3 and 4). This suggests that groundwater quality deteriorated with depth due to high salinity at the deeper than the shallow depths of aquifer. The water salinity in the aquifer showed increases towards the outcrop which may be due to the inflow of highly saline water from bottom of the aquifer especially in the outcrop of Saq aquifer in the study area.
Temporal deterioration of water quality: Data showed that overall mean changes in total water salinity were less in the confined zone than unconfined zone (Fig. 5). This variation of water salinity may be due to difference in aquifer thickness which is more in the confined zone as compared to unconfined zone in presence of shale layer preventing upward movement of saline water from the bottom layers of aquifer.
 | |
| Fig. 2: | Influence of excess pumping on groundwater level in the aquifer |
 | |
| Fig. 3: | Changes of water salinity with depth of well in confined aquifer |
 | |
| Fig. 4: | Changes of water salinity with depth of well in unconfined aquifer |
 | |
| Fig. 5: | Groundwater salinity (TDS in mg L-1) with time in different aquifers |
Also, this scenario can help to predict future water quality changes in the confined and unconfined zones of Saq aquifer in the study area regarding groundwater salinity and field crop response. According to a study, the effect of soil salinity on crop growth is negligible if the electrical conductivity of saturation extract is less than 2 dS m-1 at 25°C (Michael, 1978). Generally, most common field crops are affected with irrigation water salinity between 4-8 dS m-1. But soil salinity up to 6 dS m-1 and above is considered critical where most of the field crops in study area are likely to suffer according to crop salt tolerance limit described by USDA (1954) and Withers and Vipond (1974).
Water quality vs. groundwater level: Many investigators reported groundwater quality changes due to excess pumping of aquifer (Blaszyk and Gorski, 1981; Appelo and Postma, 1994). Data in Fig. 6 shows that yearly water level depletion (drawdown) was less in the confined zone than the unconfined but nevertheless, water quality in the unconfined zone deteriorated more than the confined zone (Fig. 3, 4). This may be attributed to the sensitivity of unconfined zone due to low discharge and well drawdown. Furthermore, yearly water level drawdown was higher in confined zone than the unconfined zone which may be due to the discrepancy in the distance between the production wells as reflected by the strength or weakness of the influence of cones of depression. This was also indicated by the small value of storage coefficient (S) in confined zone as compared to high specific yield (Sy) in unconfined zone. On the other hand, the total number of wells was 117 in confined zone as compared to 73 in unconfined zone. The small storage coefficient means quick spreading of the cone of depression thus resulting in more drawdown (Fetter, 1994) and vice versa in the case of unconfined storage.
Drawdown of a well depends on the distance between the location of two adjacent production wells. Because, if the distance between the production wells is small, the radius of influence will be more causing more intersection between the cone of depression of two neighboring production wells and showing more drawdown in wells. The distance between wells in the two-direction south-north and east-west in both zones are given in Table 1.
A manipulative calculation showed that water withdrawal was higher from the unconfined than the confined zone depending on the aquifer storage area. The parameters used for the calculation were the accumulated drawdown (15 years data), number of production wells and total area in both zones (Table 2).
 | |
| Fig. 6: | Comparison of water withdrawal and drawdown with time in Saq aquifer |
| Table 1: | Average, maximum and minimum well field distances in both the confined and unconfined zones in the study area |
 | |
| Table 2: | Comparison of well water drawdown in the confined and unconfined zones |
 | |
To calculate the excess drawdown due to variation in area and the number of pumping wells between the confined and unconfined zones, the ratio more than 0.13 and 0.6 was multiplied by accumulated drawdown in the confined zone which came to 8.46 and 42.62 m, respectively. The excess drawdown, depending on the number of wells and total area, was added to the actual accumulated drawdown estimated in the unconfined zone (i.e., 31 m) to find out the total accumulated drawdown in the unconfined zone which came to 82.08 m and was more than the drawdown in the confined zone. The calculated drawdown in the unconfined zone (82.08 m) was assumed to be equal to the currently accumulated drawdown in the confined zone (i.e., 79 m) because the two zones were similar with respect to total area and the numbers of abstraction wells. The difference between the calculated accumulated drawdown in the unconfined zone and the currently accumulated drawdown in the confined zone was 3.08 m. This difference revealed that 10% more water was withdrawn from the unconfined zone as compared to confined zone primarily to meet the growing crop water needs in the area.
Land subsidence due to groundwater withdrawals: Prediction of subsidence of ground surface overlying heavily exploited aquifers is important for efficient water management. The occurrence of land subsidence in many places in the world is the result of groundwater pumpage from unconsolidated aquifer-aquitard systems. In addition, Poland and Davis (1969) and Poland (1972) provided descriptive summaries of all the well-documented cases of major land subsidence caused by overdraft pumping. In Saudi Arabia, till to-date, no case of land subsidence has been reported, although steady depletion in water level is expected due to agriculture expansion (Al-Ibrahim, 1991).
Discharge and drawdown relationships: Well flow rate (discharge) causes great influence on the cone of depression, which indirectly affect the drawdown of the production well. For example: If the pumping rate (Q1) of a well is 300 gpm with all other factors being constant and the drawdown (s) of an observation well located 50 m away is 2 m, then the drawdown will be 4 m if the discharge rate (Q2) is increased to 600 gpm. Also for a given discharge, drawdown decreases with an increase in aquifer transmissivity and decreases in storability as described by the USDI (1977).
A negative relationship was observed between the total water withdrawal per annum and water level elevation from 1984-1993 period (Fig. 7).
 | |
| Fig. 7: | Effect of water withdrawal on water depletion in Saq aquifer (2006-2013) |
 | |
| Fig. 8: | Effect of time on water level in Saq aquifer |
The regression analysis showed a negative relationship between the water level depletion and the water withdrawal with time as given in the following equation:
WL = -4.1576X+670.27; R2 = 0.987
where, WL is the water level elevation (m) above sea level, X is the water withdrawn from the aquifer storage per season in Million Cubic Meters (mcm).
Temporal water level changes: Data in Fig. 8 show the water level changes with time in both the confined and unconfined zones in the study area. Generally, the average water level for the study area in 2004 was 682 m above sea level, but only 652 m in 2013 indicating 30 m water level depletion over a period of 10 years i.e. 66 m in the unconfined zone and 30 m in the confined zone. Thus, overall the mean annual water drawdown was 3.6 m in the study area i.e., 2.38 m in the unconfined zone and 5.31 m in the confined zone. Based on the annual calculated water well drawdown in both zones, the time period in terms of years can approximately be predicted when the water level will approach the well screen level in both zones.
A rough prediction of water depletion in future over time in the study area was also considered. The model used assumed that the annual rate of water level depletion is the same. Two linear equations showed links between the water level and time in terms of years for both zones (Fig. 8). An appropriate digital groundwater computer model was used to predict future aquifer behavior in terms of depleting water level in Saq aquifer. The two lines of graphs show the total quantity of water withdrawn from the aquifer in the two zones (unconfined and confined) thus indicating the differences in cultivated areas in both zones. The two regressions equations obtained were as below.
Unconfined zone:
WL = -2.3879X+676.33; R2 = 0.985
Confined zone:
WL = -5.2788X+630.13; R2 = 0.884
where, WL is the water level as a function of year (X) in meters above sea level.
Water strategy for saq aquifer: The study area consisted of around 0.5% of the total exposed surface Saq formation in the Kingdom of Saudi Arabia (about 65,000 km2 or 25,000 m2) plus 3,000 km2 in Jordan (Ministry of Agriculture and Water). Also, total annual recharge of 250 mcm (million cubic meters)/year was from the rainfall for the total outcrop area of Saq aquifer and the total volume of water discharged from the entire Saq aquifer was 290 mcm/year for various uses (Al-Watban, 1976; Noory, 1983). Al-Shammary (1986) estimated total annual recharge rate as 166 mcm over an area of 12,900 km2 of the Saq aquifer, while the total water extraction from this area was 248.43 mcm/year. But, in study area, the total annual water extraction was 150.2 mcm and the total annual recharge was 1.3 mcm according to water balance method and 1.23 mcm using the Chloride method.
Previously, based on the total recharge and discharge parameters, the total annual withdrawal of water from the whole Saq aquifer was 40 mcm per year as against 82.39 mcm per year estimated by Noory (1983) and Al-Shammary (1986). Lloyd and Pim (1990) estimated that the total water extraction from the whole area of the Saq aquifer was 3195x106 m3 year-1. Noory (1983) previously estimated that the total water-strategy of the entire area of Saq aquifer was 200 Billion Cubic Meters (BCM) per year. Thus, the net non-renewable water extraction from the entire Saq aquifer was about 2.95 bcm/year (Noory, 1983; Lloyd and Pim, 1990).
The study results indicated that both the water level and the water quality deteriorated due to excess pumping of aquifer in order to meet the growing water needs for domestic, agricultural, industrial and other beneficial uses. The percentage net overdraft volume of water withdrawn from the small aquifer storage in the study area came to 99 with 0.84% annual recharge. The average water level in the study area was 675 m above sea level in 2002, but only 620 m in 2013, indicating 25 m depletion over a period of 12 years i.e. 18 m in the unconfined zone and 33 m in the confined zone. Thus, overall mean annual water drawdown was 2.6 m in the study area i.e. 2.7 m in the unconfined zone and 4.4 m in the confined zone. Thus, overall mean annual water drawdown was 3.6 m in the study area i.e., 2.38 m in the unconfined zone and 5.31 m in the confined zone. The study results agree with the findings of Lashkaripour and Ghafoori (2011) who reported that manifold increases in water demand with little recharge have strained groundwater resources resulting in water level depletion and deterioration of groundwater quality in the major parts of the plain. They further mentioned that primary cause of sharp depletion in the groundwater level in recent years is attributed to excess pumping as compared to the level of natural recharge. As a result, the average water level dropped from 1036.47-1002.75 m from 1987-2006 with an annual rate of depletion to about 1.77 m. Similarly, water level depletion is often associated with increasing groundwater salinity (O’Hara, 1997). Also, El-Fadel et al. (2001) reported that severe water level depletion and the increase in groundwater salinity will be different, with regard to the amount of aquifer recharge, as well as the thickness of fresh water layer. Similarly, overexploitation and pollution of groundwater in the semi areas were reported by Ballukraya (2001) and Rao (2003) who referred shortage of surface water supplies as the main causes for this type of scenario. Similar views were expressed by Fischer et al. (2011) who observed that groundwater levels in the capital Hanoi decreased dramatically when excessive pumping at certain individual wells lowers the potentiometric surface locally and causes up-coning of the inter-face between fresh water and saline water. Also, Qahman et al. (2005) investigated the optimal and sustainable extraction of groundwater from a coastal aquifer for seawater intrusion into the aquifer. Their physical model was based on the density-dependent advective-dispersive solute transport model.
CONCLUSIONS
The net volume of water withdrawn from the small aquifer storage in the study area came to 99% with 0.84% annual recharge. Mean groundwater level depletion was 25 m over a period of 12 years (2002-2013 period) i.e. 33 m in the unconfined zone and 18 m in the confined zone. Overall mean annual water drawdown was 2.6 m in the study area i.e. 2.7 m in the unconfined zone and 4.4 m in the confined zone. The study area covered approximately 5% of the total water exploitation from Saq aquifer and 46 % of the total volume of water exploitation from the whole Saq aquifer in the Al-Hail region. Therefore, the aquifer storage in the study area is under stress as a result of water exploitation as compared to other locations in the Saq aquifer. According to the study observations, it may take around 21 years for the groundwater salinity to each critical level for salt stress on most of the field crops and upto 36 years for the water level to reach the well screen levels. In conclusion, the study area needs careful planning and adoption of improved water management practices to avoid water shortage problems for sustainable irrigated agriculture.
REFERENCES
- Al-Ibrahim, A.A., 1991. Excessive use of groundwater resources in Saudi Arabia: Impacts and policy options. Ambio, 20: 34-37.
Direct Link - Blaszyk, T. and J. Gorski, 1981. Ground-water quality changes during exploitation. Groundwater, 19: 28-33.
CrossRef - El-Fadel, M., M. Zeinati and D. Jamali, 2001. Water resources management in Lebanon: Institutional capacity and policy options. Water Policy, 3: 425-448.
CrossRefDirect Link - Fischer, A.R., C. Stefan, K. Silabetzschky, P. Werner and B. Hoc, 2011. Soil aquifer treatment as a tool for sustainable groundwater use in hanoi/vietnam. J. Environ. Prot., 2: 882-887.
Direct Link - Khadim, F.K., K.K. Kar, P.K. Halder, M.A. Rahman and A.K.M.M. Morshed, 2013. Integrated Water Resources Management (IWRM) impacts in South West Coastal Zone of Bangladesh and fact-finding on Tidal River Management (TRM). J. Water Resour. Prot., 5: 953-961.
CrossRefDirect Link - Lashkaripour, G.R. and M. Ghafoori, 2011. The effects of water table decline on the groundwater quality in aquifer of Torbat Jam Plain, Northeast Iran. Int. J. Emerg. Sci., 1: 153-163.
Direct Link - Lloyd, J.W. and R.H. Pim, 1990. The hydrogeology and groundwater resources development of the Cambro-Ordovician sandstone aquifer in Saudi Arabia and Jordan. J. Hydrol., 121: 1-20.
CrossRefDirect Link - Qahman, K., A. Larabi, D. Ouazar, A. Naji and A.H.D. Cheng, 2005. Optimal and sustainable extraction of groundwater in coastal aquifers. Stoch. Environ. Res. Risk Assess., 19: 99-110.
CrossRef - Qahman, K., A. Larabi, D. Ouazar, A. Naji and A.H.D. Cheng, 2009. Optimal extraction of groundwater in gaza coastal aquifer. J. Water Res. Prot., 4: 249-259.
CrossRefDirect Link - Segosebe, E. and B.P. Parida, 2006. Water demand management in Botswana: Challenges of a diminishing resource. Int. J. Sustain. Dev. Plann., 1: 317-325.
Direct Link - Rao, N.S., 2003. Groundwater prospecting and management in an agro-based rural environment of crystalline terrain of India. Environ. Geol., 43: 419-431.
CrossRef - Subramani, T., L. Elango and S.R. Damodarasamy, 2005. Groundwater quality and its suitability for drinking and agricultural use in Chithar River Basin, Tamil Nadu, India. Environ. Geol., 47: 1099-1110.
CrossRefDirect Link - O'Hara, S.L., 1997. Irrigation and land degradation: Implications for agriculture in Turkmenistan, central Asia. J. Arid Environ., 37: 165-179.
CrossRefDirect Link