
A. Nassar
The Islamic University of Gaza, P.O. Box 108, Gaza City, Gaza Strip, Palestinian Territories
H. Al Najar
The Islamic University of Gaza, P.O. Box 108, Gaza City, Gaza Strip, Palestinian Territories
M. Smith
WEDC, Loughborough University, Loughborough, UK
M. Ghannam
Coastal Municipalities Water Utility, the Gaza Strip, Palestinian Territories
Research Journal of Environmental Sciences
Year: 2010 | Volume: 4 | Issue: 2 | Page No.: 149-157


ABSTRACT
Gaza wastewater treatment plant (GWWTP) is a well-established facility and was used to study the suitability of individual treatment components as possible low cost treatment systems for semi-arid regions in terms of removal efficiency. Samples were taken at weekly intervals over an 18 week period. During this period there were significant removals of BOD, COD and TSS. The removal efficiencies of BOD and TSS in the anaerobic component were 41 and 44%, respectively, while BOD removal efficiencies in the bio-towers and aerated lagoons were 56 and 51%, respectively. Calculations to predict the expected removal efficiencies of each individual component match those observed, based on analyzed samples, except for the anaerobic treatment facility where lagoons are partially filled with sludge, as a consequence of which the hydraulic retention time is less than assumed. Taken as a whole the average reductions for BOD, COD and TSS were 90, 86 and 88%, respectively. All these reductions mean that the final effluent is able to satisfy the guidelines for discharge to the sea.
PDF Abstract XML References Citation
How to cite this article
A. Nassar, H. Al Najar, M. Smith and M. Ghannam, 2010. Gaza Wastewater Treatment Plant as a Model for Low Cost Wastewater Treatment Technology in Semi-Arid Environment. Research Journal of Environmental Sciences, 4: 149-157.
DOI: 10.3923/rjes.2010.149.157
URL: https://scialert.net/abstract/?doi=rjes.2010.149.157
DOI: 10.3923/rjes.2010.149.157
URL: https://scialert.net/abstract/?doi=rjes.2010.149.157
INTRODUCTION
Very few sewage-treatment facilities in developing countries work reliably or effectively. This often is because most sewage treatment facilities are big, centralized schemes based on technologies which have been developed in rich developed countries where adequate financial, material and human resources are available. However, there are some sewage-treatment options which are more appropriate to developing countries. Such systems should be low-cost, have low operation and maintenance requirements and, should maximize the utilization of the potential resources (principally irrigation water and nutrients). Current research for wastewater treatment, such as activated sludge and tertiary nutrient removal are too costly to provide a satisfactory solution for the increasing wastewater problems in developing regions, where low cost and natural treatment are occusionally discussed. Low cost research technology is mostly discussed for the small comunities and specific wastewater such as from food production (Arienzo et al., 2009). Preliminary and primary treatment stages are common to most sewage-treatment works and are effective in reducing much of the polluting potential of wastewater. There are many different types of secondary wastewater treatment process. Anaerobic and facultative ponds are common secondary treatment stages that are suitable for low- and middle-income countries (Gijzen, 2001).
Tertiary treatment processes are generally specialized processes which are not necessary for most communities. The requirement in most low-income countries is for a low-cost, low maintenance sewage treatment system (Reed, 1989).
The Gaza wastewater treatment plant (GWWTP) is one of the three main central treatment plants that serve the whole Gaza Strip population of 1.45 million people (PCBS, 2006). Access to sewerage facilities within the Gaza Strip currently varies from area to area. On average, it is estimated that about 60% of the population is connected to a sewerage network (PCBS, 2007). The GWWTP is the first of its kind in the Gaza Strip based on anaerobic lagoons, aerated lagoons and trickling filters. Currently (based on flows in 2008) it receives approximately 55,000 m3 of sewage daily. The GWWTP was constructed in 1977, initially with two lagoons. In 1986, the UNDP funded a wastewater treatment plant upgrading programme to add two more lagoons and planned that all four lagoons would be aerated. The technology of the plant was based on using a high level of mixing and aeration in the first stage (2 lagoons in parallel) and a lower rate of treatment in the second stage (also two lagoons in parallel). The treatment system was called ‘Dual Power Multicellular Aerated Ponds’. Twelve years later (in 1997) the proposed design criteria for upgrading the GWWTP were to achieve a treated effluent containing less than 35 mg L-1 BOD5 and 30 mg L-1 TSS, with some nitrogen removal. The Bio-tower technology, based on percolating filtration, was adopted for the treatment process because its construction and annual costs and power demands were lower than those for other treatment techniques, the plant was designed for an average flow of 32,000 m3 and a peak flow of 48,000 m3.
The GWWTP comprises a range of treatment facilities, using both anaerobic and aerobic approaches. Such a well-established treatment model can be used to evaluate the current performance of each individual component as a model for low cost wastewater treatment in semi-arid regions.
MATERIALS AND METHODS
Gaza wastewater treatment plant unlike other waste water treatment plants in Gaza Strip. It is provided with central laboratory to follow up the treatment process since 1998. The collected data represents the follow up programme from July, 2007 to January, 2008. During the study period more other sampling locations were added to the programme to evaluate the individual component of the treatment process (Fig. 1), where the routine follow up consider the composite samples were collected from the raw wastewater influent and the treated effluent to evaluate the overall treatment system efficiency. Data were analyzed using Excel software.
As shown in Fig. 1 for specific evaluation, the wastewater was sampled at the inlet and outlet of each individual treatment facility, although the outlet from one treatment stage was also the inlet to the subsequent stage. Sampling points were as follows:
| • | SP1:Inlet to the anaerobic system |
| • | SP2:Outlet from the anaerobic system and inlet to the bio-filter |
| • | SP3:Outlet from the bio-filter and inlet to the aerated lagoons |
| • | SP4:Outlet from the aerated lagoon and inlet to the maturation pond |
| • | SP5:Outlet from the maturation pond |
From each sample point a 3000 mL was taken every 24 h. The samples were stored in containers at 2°C for transport to the laboratories for immediate analysis. The parameters that were analyzed for were BOD, COD and Total Suspended Solids (TSS). All analyses followed standard methods for the examination of water and wastewater.
 | |
| Fig. 1: | The current flow scheme of GWWTP and Sampling Points (SP) |
Follow up programme at the treatment plant consider the indicate approach and the results are rarely analyzed for research purposes. In the current research each sample was relicated four times. The replicates were checked for significant differences with one-way analysis of variance (TUKEY test) using Sigma-Stat 2.03 software package (SPSS Science Software Inc.).
RESULTS AND DISCUSSION
During the study period, an average of 50,000 to 55,000 m3 of sewage was received daily depending on the month of the year. Water consumption in summer is higher than in winter months and, as a consequence, wastewater production is higher in summer. Many flow measurements recorded influent flows in excess of the treatment plant’s full design capacity of 48,000 m3 day-1. The wastewater temperature was within the range from 22 to 29°C, while the average influent values for BOD, COD and TSS were 450, 850 and 400 mg L-1, respectively (Table 1).
The two parallel anaerobic lagoons with depths of 6 metres each have a total volume of 24,000 m3 and the average flow rate was estimated to be 53,000 m3 day-1. The average hydraulic retention time therefore equals 0.45 days. These lagoons are then followed in series by an anaerobic lagoon with a volume of 31,000 m3, which adds 0.58 days to the retention time. The average total retention time in the anaerobic system therefore amounts to 1.03 days. The average flow rate varies from 50,000 to 55,000 m3 day-1, based on the average monthly records at the treatment plant. Wastewater temperatures during the study period were between 22 and 29°C. Table 2 shows the quality of influent and effluent from anaerobic lagoons.
| Table 1: | Laboratory results for the influent and effluent temperature, BOD, COD and TSS for 4 months |
 | |
| Inf: Influent; Effl: Effluent | |
| Table 2: | Sample analysis of the influent and effluent from the anaerobic lagoons |
 | |
Inf: Influent; Effl: Effluent | |
| Table 3: | Sample analysis of the influent and effluent from the bio-towers |
 | |
| Inf: Influent; Effl: Effluent | |
| Table 4: | Sample analysis of the influent and effluent from the aerated lagoons |
 | |
| Inf: Influent; Effl: Effluent | |
The aerobic facilities consist of two high rate bio-towers each 27 m in diameter and with a Plastic media depth of 7.3 m. The units operate in parallel and are designed for 85% BOD removal. Eight countercurrent natural ventilation openings are provided at the base of the units, equally spaced around the circumference The two bio-towers receive the effluent from the anaerobic lagoons. The liquid entering the bio-towers has soluble BOD concentrations within the range from 232 to 266 mg L-1; while the BOD of the effluent from the bio-towers ranges from 97 to 126 mg L-1, as shown in Table 3.
Effluent leaving the bio-towers drains to the downstream aerated lagoon with a total volume of 45000 m3, Table 4 shows the quality of influent and effluent from the aerated lagoon.
The final pond is divided by a concrete wall creating a settling pond as shown in Fig. 2a and b. The settling pond is 13 m wide by 83 m long, with a concrete hopper-bottom settling zone.
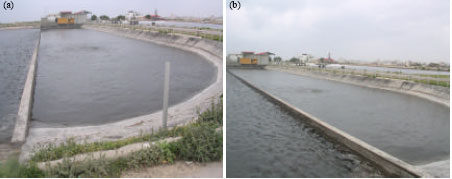 | |
| Fig. 2: | Two views of the existing settling channel and polishing pond |
Sludge is removed through a 150 mm diameter suction pipe draped along the existing 3:1 slope. The depth of the polishing pond equals 3 m and the surface area 11400 m2. The volume of the pond is 33000 m3, which provides a retention time of 0.62 days.
Variations in BOD, COD and TSS concentrations were significant, as shown in Table 1, due to the dilution effects associated with the volumes of wastewater generated in summer and winter. The average effluent BOD, COD and TSS concentrations were 42, 120 and 50 mg L-1, respectively. In general the removal efficiencies for BOD, COD and TSS were 90, 86 and 88%, respectively.
In wastewater treatment, COD serves as a measure of the extent to which the organic content of the wastewater needs to be stabilized and therefore is arguably the most important parameter for measuring treatment process performance. For discharge of treated effluent into the sea, the Palestinian Ministry of Environmental Affairs proposed guideline discharge limits within the range from 30 to 50 mg BOD L-1. The 42 mg L-1 average effluent BOD value over the study period was therefore within the acceptable range for discharge limits. Due to the limited industrial activities in the Gaza Strip, BOD is the most important variable in water pollution control since it indicates the actual level of biodegradable pollutants in the water. Therefore, an effluent low in BOD is commendable. TSS is also a very important variable in wastewater discharge control. Apart from being an aesthetic nuisance in rivers, discharge of effluents high in TSS can cause environmental harm to flora and fauna and can cause blockage in irrigation systems if effluents are reused for irrigation (Tchobanoglous and Stensel, 2002).
The overall treatment process, which consists of an anaerobic stage followed by an aerobic system, is not informative in terms of process evaluation. The individual anaerobic and aerobic processes can, however, be considered separately. The anaerobic system will be discussed and evaluated, as a large prototype. In addition, both components of the aerobic system; the bio-filters and aerated lagoons, will be discussed separately.
Model Calculation of BOD Removal
Anaerobic System
Based on the temperature range 22 and 29°C; the BOD removal efficiency (without any heating) in the anaerobic units should be between 48 and 60% (Horan, 1999; Van Handel and Lettinga, 1994). Based on model calculations by Horan (1991) the anaerobic lagoons should achieve 60% BOD removal. As shown in Table 2, the BOD of the effluent from the anaerobic lagoons ranges from 233 to 267 mg L-1, with an average removal efficiency of 38%. The incompatibility between the theoretical calculations and the sample analysis is due to the short (inadequate) retention time which is due to the settling of significant quantities of sand in the first two lagoons reducing their effective volumes. The minimum retention time required for settling and anaerobic treatment is around two days in the Gaza environment anaerobic systems are effective for degradation of fatty acids (Nkegbe et al., 2005). As shown in Table 2, pH values for the anaerobic system effluent are lower than for the influent, providing evidence that anaerobic digestion is occurring.
Aerobic System
Bio-Towers
The BOD removal efficiency for the bio-towers ranges from 48 to 61% (Table 3), which is less than the design figure of 85%. The reduction in the bio-tower efficiency is due to the high hydraulic load, which exceeds the design value. The design peak flow of the bio-towers is 40,000 m3 day-1, while the current flow ranges from 50,000 to 55,000 m3 day-1. The high TSS concentrations in the effluent from the bio-towers also indicates that the bio-towers are overloaded, indicating that flushing could be removing some of the biofilm.
Aerated Lagoon
The estimated retention time is 0.85 days. The aerated lagoon contains ten 25 hp (18.64 kW) and six 50 hp (37.27 kW) floating surface aerators. Each of the 16 aerators is fixed in position in the lagoon by cables and anchors. The minimum required power for aeration, based on European standards, is 5 kW/103m3. Therefore the required aeration system for an average daily flow of 53,000 m3 should be at least (5 x 53) = 265 kW. The fixed aerators provide 550 hp (410 kW) which is enough to provide the required aeration. According to the data in Table 4, the BOD removal efficiency exceeds 50%. A more indicative measure of the treatment achieved and shown in the analysis is the considerable reduction of TSS (Table 4). Due to the lack of reliable energy resources in the Gaza Strip, the aeration system works for between 8 and 12 h a day (during the daytime at peak flow) which enhances the growth of aerobic bacteria and periods when the aerators are not working allow sedimentation of suspended solids.
Considering the kinetic and rate of cell synthesis equation:
Le = Li/ (1+KTR) |
Where:
| Le and Li | = | The effluent and influent BOD concentrations, respectively |
| KT | = | The reaction rate for BOD removal, where KT = K20 OT T-20 where K20 = 1.4 day-1 |
| OT | = | 1.056 (20°C<T<30°C) |
| OT | = | 1.135 (4°C<T<20°C) |
| R | = | Hydraulic retention time (days) |
The effluent (126 mg L-1 BOD) from the bio-tower is the influent to the aerated lagoons and the predicted effluent from the aerobic treatment will have a BOD of 126 ÷ (1 + 1.65 x 0.85) = 52 mg BOD L-1. for the aeration system and assuming complete mixing based on 5kW/103m3. The theoretical calculation (giving an effluent BOD of 52 mg BOD L-1) is in close agreement with the sample analysis (effluent BOD from 50 to 55 mg BOD L-1). This indicates that the aerated lagoons are working properly, as predicted from theory.
Final Effluent Polishing Pond
Due to the considerable depth (3 m) of the pond and the 50 mg L-1 BOD in the influent, the pond could function as a facultative lagoon.
| Table 5: | Sample analysis of the influent and effluent from the facultative lagoon |
 | |
| Inf: Influent; Effl: Effluent | |
 | |
| Fig. 3: | BOD values at different sampling points at various sampling periods |
The surface BOD load = (BOD load)÷(surface area) = 50 mg BOD L-1x53,000 m3x10000÷11400 = 2324 kg/ha/day |
The maximum allowable surface load for facultative lagoons = 60x(1.099)T where T is the water temperature (Mara, 2004). Low temperatures are most critical; therefore the calculations should be based on a temperature of 22°C, which was the lowest T value during the study period.
Maximum surface load = 60x(1.099)22 = 478.7 kg/ha/day. The actual surface load (2324 kg/ha/day) is more than the permissible load (227 kg/ha/day), therefore it is expected that the proposed polishing pond is not functioning as a facultative, but as an anaerobic lagoon with a low retention time. As shown in Table 5, the BOD removal efficiency is not significant. Moreover, the pond is neither working properly as a polishing pond (due to the low retention time and considerable depth) nor as a facultative lagoon more close to operate as a clarifier.
In conclusion, in spite of the high variation of influent BOD with time of sampling at sampling Point 1 (SP1), the BOD removal in the anaerobic lagoons is nearly constant. This is also true for all the treatment components, as shown in Fig. 3. The main explanation for the constant BOD removal rate in the anaerobic lagoons is the buffering capacity provided by the substantial storage capacity of these lagoons. Expansions of the anaerobic lagoons will improve the stability of influent BOD to the aerobic system. Moreover, it will attenuate exceptional BOD influent values and variations in flow rates. The treatment experience in the Gaza Strip shows that a significant BOD removal efficiency (up to 60%) could be achieved for anaerobic treatment units having a minimum retention time of 2 days.
Suspended solids concentrations show considerable variation after each individual treatment component. The reduction in SS concentrations is not as consistent as for BOD.
 | |
| Fig. 4: | SS values at different sampling points at various sampling periods |
Flushing of the biofilms in the bio-towers and aerated lagoons full of settling solids will adversely affect removal within the individual treatment units, as shown in Fig. 4.
CONCLUSION
Gaza is in a semi-arid region characterized by high temperatures. Microbial activity is relatively high in such regions, because temperature affects metabolic rates. The anaerobic system studied for this research shows a BOD removal efficiency of more than 40%, for a retention time of less than one day. It is likely that increasing the volume of the anaerobic lagoons to increase the hydraulic retention time would lead to a significant increase in the BOD removal efficiency, possibly up to 60%. The BOD removal efficiency in the bio-towers is higher than in the aerated lagoons and the bio-towers also consume less energy than the aerated lagoons. Gaza wastewater treatment plant consists of a variety of wastewater treatment techniques in series and could be a flexible model for low cost wastewater treatment in the Gaza Strip, as it avoids dependence on sophisticated treatment technologies in a region where supplies of energy are unreliable.
REFERENCES
- Arienzo, M., E.W. Christen, W. Quayle and N. Di Stefano, 2009. Development of a low-cost wastewater treatment system for small-scale wineries. Water Environ. Res., 81: 233-241.
PubMed - Nkegbe, E., V. Emongor and I. Koorapetsi, 2005. Assessment of effluent quality at glen valley wastewater treatment plant. J. Applied Sci., 5: 647-650.
CrossRefDirect Link