
Istikhar Hussain
School of Science and Technology, University of Teesside, Middlesborough, United Kingdom
Attiq-ur-Rahman
School of Science and Technology, University of Teesside, Middlesborough, United Kingdom
Nigel Atkinson
School of Science and Technology, University of Teesside, Middlesborough, United Kingdom
Pakistan Journal of Nutrition
Year: 2009 | Volume: 8 | Issue: 1 | Page No.: 9-12


ABSTRACT
The study was conducted to evaluate and compare the quality of probiotic and natural yogurt. Several samples of probiotic and natural yogurt were bought from supermarkets in Middlesborough (UK) and analyzed for physico-chemical, microbiological and organoleptic properties. Physico-chemical analysis showed that probiotic yogurts have more pH, fat and solid not fat (SNF) contents compared to natural yogurt. While natural yogurts have higher Total Titrable Acidities (TTA) and total solids contents, compared to probiotic yogurts. Organoleptically, probiotic yogurt was found more acceptable compared to natural yogurt. However, the fat contents of natural yogurt are lower and that might affect the overall acceptability of the yogurt. Similarly, an increase in the TA of the natural yogurt might affect the quality of the product. Microbiological analysis found no significant variation in total viable count between probiotic and natural yogurt.
PDF Abstract XML References Citation
How to cite this article
Istikhar Hussain, Attiq-ur-Rahman and Nigel Atkinson, 2009. Quality Comparison of Probiotic and Natural Yogurt. Pakistan Journal of Nutrition, 8: 9-12.
DOI: 10.3923/pjn.2009.9.12
URL: https://scialert.net/abstract/?doi=pjn.2009.9.12
DOI: 10.3923/pjn.2009.9.12
URL: https://scialert.net/abstract/?doi=pjn.2009.9.12
INTRODUCTION
Yogurt is one of the most widely distributed dairy products. Yogurt in different forms with diverse local names is made throughout the world. (Tarakci and Erdogan, 2003). The use of yogurt dates back many centuries, although there is no accurate record of the date when it was first made. According to legend, yogurt was first made by the ancient Turkish people in Asia, (Kurt, 1981). The uniqueness of yogurt is attributable to the symbiotic fermentation involved in its manufacturing.The composition of yogurt is dependent on the type and source of milk and a range of seasonal factors. For example: whole milk or skimmed milk, season, lactation period and the feeding mode. It is also significantly influenced by manufacturing conditions (such as temperature and durationand equipment utilized) and on the presence of other ingredients such as powdered milk or condensed milk, (Blance, 1986). Yogurt is derived from Turkish word Jugurt describing any fermented food with acidic taste. Its manufacture involves the use of specific symbiotic/mixed culture of Lactobacillus bulgaricus and Streptococcus thermophilus (Kon, 1959). Yogurt is a coagulated milk product that results from the fermentation of lactic acid in milk by Lactobacillus bulgaricus and Streptococcus thermophilus (Bourlioux and Pochart, 1988). It has a smooth textureand a mildly sour and pleasant flavor. It is obtained from pasteurized or boiled milk soured by naturally occurring, or lactic acid fermenting bacteria i.e. Lactobacillus bulgaricus and Streptococcus thermophilus (FAO, 1977). The commercial yogurt of today is usually made by fermenting milk with mixed culture of Lactobacillus bulgaricus and Streptococcus thermophilus, each of these organisms acidify milk and produce specific yogurt flavor and aroma (Almena et al., 2005). The addition of probiotic bacteria is made not only because of certain claimed health-promoting effects in the intestinal tract. Other beneficial health effects suggested include enhancement of the immune system, reduction of lactose intolerance, control of diarrhea and reduction of LDL cholesterol (so called “bad cholesterol”) (Scheinbach, 1999). Product quality and consumer satisfaction are important for increasing the sales of various types of yogurt products (Debbie et al., 1991). Quality assessment encompasses specifications, sampling, testing procedures and recording or reporting. Specifications are typically set by the manufacturer. Ultimately, the consumer is the final judge of quality. Yogurt quality is difficult to standardize because of many forms, varieties, manufacturing methods, ingredients and consumer preferences that exist (Kroger, 1976). This situation makes yogurt an interesting, challenging area to work in. A practical approach towards the quality comparison of probiotic and natural yogurt is to evaluate the different samples of probiotic and natural yogurt available in UK supermarkets. As a first step, the physico-chemical and microbiological properties of probiotic and natural yogurt were evaluated. Then sensory analysis was conducted to check the overall acceptability of different samples of probiotic and natural yogurt.
MATERIALS AND METHODS
The research work of the project was conducted in the microbiology laboratory in the Orion Building of the University of Teesside, Middlesborough.
Collection of samples: Fresh samples of probiotic and natural yogurt were bought from various supermarkets in Middlesborough.
Product analysis
Physico-chemical Analysis
Total Titratable Acidity: Acidity was measured by potentiometric method according to the BS 7142-5, 1997.
pH: The pH of probiotic and natural yogurt was determined by using a Digital pH meter, Hana pH meter No. 211. The pH meter was standardized using pH 4.0 and pH 7.0 buffer solutions. The yogurt samples were stirred with a small of amount-distilled water before pH measurement. pH was measured over several days.
Protein: Protein and nitrogen contents of yogurt samples were determined by Kjeldahl method according to the BS 1741-5.2 (1990).
Fat: Fat was determined (on wet weight basis) by Soxhlet’s method by using this formula, % Fat = g of fat in dry sample/g fat of in wet sample* 100 (Suzanne, 2003a).
Total solid: Total solids were determined by following formula, % Total solids (wt/wt) = wt. Of dry sample/ wt. of wet sample* 100 (Suzanne, 2003b)
Microbiological analysis: The microbiological analysis of probiotic and natural yogurt was carried out for total viable count as described by David and Fankhauser (2005).
Organoleptic evaluation: All the samples of probiotic and natural yogurt were evaluated by ranking method for sensory characteristics and overall acceptability by a panel of judges from the staff of University of Teesside, Middlesborough using the method described by BS 5929-6 (1989).
Statistical analysis: The data was statistically analyzed according to John (1995a,b). Students’ T-test was applied to compare the samples of probiotic and natural yogurt as described by Daniel (2002). Significant differences were determined at α= 0.05%.
RESULTS AND DISCUSSION
Physico-chemical analysis
Total titratible acidity: The total tirtatable acidity of probiotic yogurt and natural yogurt is shown in Table 1. The average TTA of probiotic yogurt was 1.41 percent with a standard deviation of 0.03. The average TTA acidity of natural yogurt was 1.44 with a standard deviation of 0.01. These results are in line with findings Tarakci and Erdogan (2003) in which acidity increased over the storage period. Guler and Mutlu (2005) also observed an increase in Total Titratable Acidity during the storage period.
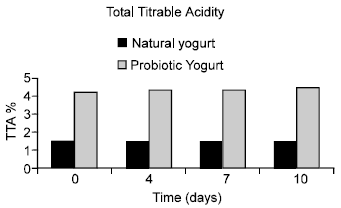 | |
| Fig. 1: | Comparison of TTA of probiotic and natural yogurt |
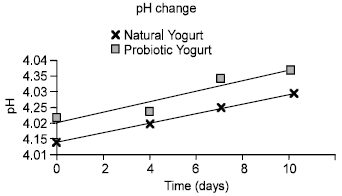 | |
| Fig. 2: | Comparison of pH of probiotic and natural yogurt |
Kroger (1976) reported that in probiotic yogurt the Lactobacilli will grow continuously in between pH 4.0 and 4.4, since they are also capable of producing acid, so ultimately the acidity of probiotic yogurt tends to increase. But in case of natural yogurt there is no bio-live culture, so a decrease in TA is expected.
pH: The pH of probiotic yogurt and natural yogurt is shown in Table 2. In both cases, pH increased during storage. These results are in line with findings of Salji et al. (1985) and Sutherland and Varnam (1994) who reported yogurt pH as 4.50. Probiotic have higher pH then natural yogurt (Fig. 2), possibly due to the low total viable count of probiotic bacteria over the storage period. Nighswonger et al. (1996) also reported decling counts of L. acidophilus in yogurt over the storage period.
Protein: The protein content of probiotic yogurt and natural yogurt is shown in Table 1. The average protein content of probiotic yogurt was 5.4 with a standard deviation of 0.003. While the average protein content of natural yogurt was 5.3 with a standard deviation of 0.005. These results are in line with findings of Janhoj et al. (2006) who reported the protein contents of low-fat stirred yogurt ranged from 3.4 to 6.0%.
| Table 1: | Physico-chemical analysis (Mean±SD) pH of probiotic and natural yogurt collected during summer season (2006) |
 | |
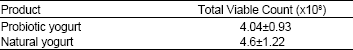
| Table 2: | Microbiological analysis (Mean±SD) pH of probiotic and natural yogurt collected during summer season (2006) |
 | |
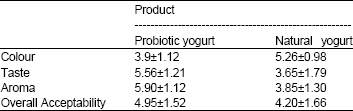
| Table 3: | Organoleptic Evaluation (Mean±SD) of probiotic and natural yogurt collected during summer season (2006) |
 | |
Fat: The fat content of probiotic yogurt and natural yogurt is shown in Table 1. The average fat content of probiotic yogurt was 0.76 with a standard deviation of 0.005. While the average fat content of natural yogurt was 0.29 with a standard deviation of 0.001. These results are in line with findings of Janhoj et al. (2006) who reported that fat contents ranged from 0.3 to 3.5% for a low-fat stirred yogurt, but these results are totally different from the Mutlu et al. (2005) who reported the fat content of bio-yogurt made from goat’s milk i.e. 3.1%. As the fat contents of natural yogurt are lower as compared to probiotic yogurt so ultimately that will affect the quality of the yogurt.
Total solids: The total solids content of probiotic yogurt and natural yogurt is shown in Table 1. The average total solids content of probiotic yogurt was 17.75 with a standard deviation of 0.006. While the average total solids content of natural yogurt was of 19.2 with a standard deviation of 0.035. As regards the probiotic yogurt these results are in line with findings of Muhammad et al. (2005) who reported the highest range of total solids in yogurt was17.1%, but in case of natural yogurt these results are significantly different.
Solid- not-fat (SNF): The SNF content of probiotic yogurt and natural yogurt is shown in Table 1. The average SNF content of probiotic yogurt was 1.85 with a standard deviation of 0.05. While the average total solids content of natural yogurt was 1.78 with standard deviation of 0.06.
Microbiological analysis
Total viable count: The total viable count of probiotic and natural yogurt is shown in Table 2. The average total viable count of probiotic yogurt was 4.04 x 10⁸ with a standard deviation of 0.93. The average total viable count of natural ranged was 4.6 and standard deviation 1.22. These results are in line with findings of Lopez et al. (1997) who reported log aerobic mesophilic count from < 1.0-5.38 and from 4.87-6.67 per ml in natural yogurt. There are found no significant variation in total viable count of probiotic and natural yogurt because defined starter culture is used (Kon, 1959) under proper conditions of fermentation for manufacture of yogurt.
Organoleptic evaluation
Overall acceptability: The overall acceptability scores of probiotic and natural yogurts are shown in Table 3. The average values of overall acceptability of probiotic and natural yogurt were 4.95 and 4.20 with a standard deviation of 1.52 and 1.66 respectively. Colour, taste and aroma are the important factors, which determine the acceptance or rejection of a food article. Among probiotic and natural yogurt samples, the average overall acceptability score was highest for the probiotic yogurt as compared to Natural yogurt. Comparing the overall acceptability of probiotic and natural yogurts by using T-test assuming unequal variances showed that there was a significant difference among overall acceptability of different samples of probiotic and natural yogurt.
REFERENCES
- Guler-Akin, M.B., 2005. The effects of different incubation temperatures on the acetaldehyde content and viable bacteria counts of bio-yogurt made from ewe's milk. Int. J. Dairy Technol., 58: 174-179.
CrossRefDirect Link - Muhammed, B.F., M.M. Abubakar, T.A. Adegbola and E.O. Oyawoye, 2005. Effects of culture concentration and inoculation temperature on physicochemical, microbial and organoleptic properties of yogurt. Nig. Food J., 23: 156-165.
Direct Link - Guler-Akin, M.B. and M.S. Akin, 2007. Effects of cysteine and different incubation temperatures on the microflora, chemical composition and sensory characteristics of bio-yogurt made from goat's milk. Food Chem., 100: 788-793.
CrossRefDirect Link - Scheinbach, S., 1999. Probiotics: Functionality and commercial status. Biotechnol. Adv., 16: 581-608.
CrossRefDirect Link - Tarakci, Z. and E. Kucukoner, 2003. Physical, chemical, microbiological and sensory characteristics of some fruit-flavored yogurt. YYU Vet. Fak Derg, 14: 10-14.
Direct Link