
S. D. Mendi
Food Technology Laboratory, Institute of Agricultural Research for Development (IRAD), Bambui Regional Centre, Bamenda, Cameroon
C. W. Nain
Food Technology Laboratory, Institute of Agricultural Research for Development (IRAD), Bambui Regional Centre, Bamenda, Cameroon
M. Y. Mfopit
Animal Health and Veterinary Research Laboratory, IRAD Wakwa, Ngaoundere, Cameroon
A. Tanya
Faculty of Science, University of Yaounde I, Cameroon
M. F. Carl Mbofung
National School of Agro-Industrial Sciences (ENSAI), University of Ngaoundere, Cameroon
Pakistan Journal of Nutrition
Year: 2009 | Volume: 8 | Issue: 9 | Page No.: 1415-1421


ABSTRACT
The aim of this study was to evaluate the nutritional merits of ginger-spiced cheese in terms of body weight gain and feed utilization, blood lipid profile and implantation of micro-organisms in the gastrointestinal tract of consumers. Four groups of male Wistar rats of 9 per group housed 3 per cage were fed for four weeks. Three of the groups were supplemented with ginger-spiced cheese of 0, 1.0 and 1.5 g ginger powder/100 g of milled curd while the control group did not receive any cheese supplement. The rats were weighed before the start of cheese supplementation and thereafter, every week. The rats were sacrificed and blood was collected and triglycerides, total cholesterol, HDL and LDL cholesterol were determined. There was the enumeration of total bacterial colonies, yeasts and moulds and Lactobacilli colonies from the intestinal contents of the rats. Results showed that body weight gain and feed efficiency ratio were significantly (p<0.05) lowest for the control group while group C (1.5 g ginger powder/100 g of milled cheese curd) was significantly (p<0.05) highest. LDL cholesterol was significantly (p<0.05) highest for the control group D (22.7mg/dl) compared to the other groups (A, 15.6mg/dl; B, 15.5mg/dl; C, 17.3mg/dl). LDL/HDL ratio was significantly (p<0.05) highest for group D,(6.6) and lowest for group A (2.6) that consumed cheese containing 1.0 g ginger powder/100 g of milled curd. The best counts of yeasts and moulds were in group B (plain cheese), Lactobacilli in group C and least bacterial colony counts in group D. Incorporating ginger into cheese during manufacture improved significantly on some nutritional aspects. Cheese should not always be considered as a predisposing food to developing coronary heart diseases.
PDF Abstract XML References Citation
How to cite this article
S. D. Mendi, C. W. Nain, M. Y. Mfopit, A. Tanya and M. F. Carl Mbofung, 2009. Nutritional Merits of a Ginger-Spiced Cheese Fed to Male Wistar Rats. Pakistan Journal of Nutrition, 8: 1415-1421.
DOI: 10.3923/pjn.2009.1415.1421
URL: https://scialert.net/abstract/?doi=pjn.2009.1415.1421
DOI: 10.3923/pjn.2009.1415.1421
URL: https://scialert.net/abstract/?doi=pjn.2009.1415.1421
INTRODUCTION
Food is consumed in order to provide the body with energy, nutrients for growth and replacement or repair of worn out cells and regulatory substances for its proper functioning. However, food substances are complex in nature and as according to Readers’ Digest (1997) some foods when consumed in certain quantities or conditions may heal or cause harm to the body of consumers.
Out of the ten leading major factors that contribute to all deaths worldwide, six are related to nutrition, diet and physical activity. High blood pressure and cholesterol were the major contributing factors to deaths in the world for all ages, with coronary heart diseases being the main cause of about 30% (WHO, 2005). Each year, as according to Ezzate et al. (2004) about 4.4 million people die of high total cholesterol levels.
Dairy products in general and especially those rich in saturated fats like butter and cheese are always considered as foods that would predispose consumers to conditions of coronary heart diseases. In liquid milk products, cholesterol content was found to correlate with fat content thus: from 6.2 mg/100 g for milk with 1.5% fat, to 77 mg/100 g for cream with 38% fat. The cholesterol content of cheese was 33-82 mg/100 g (Piironen et al., 2002). The cholesterol content of goat milk cheeses reported by Park (1999) on wet basis was 80-147 mg/100g and 39.3-71.5 mg/100 g on a dry basis. A spiced cheese variety with pepper and herbs had the lowest cholesterol concentration 80.9 mg/100 g on wet basis, while another with garlic and herbs contained the highest amount of cholesterol (146.8 mg/100 g).
Rather than advocate the complete exclusion of dairy products especially cheese that are very rich in nutrients from the diet, studies are being carried out to modify them in order to improve on their effects on the lipid profiles of consumers. Tholstrup et al. (2004) compared the effects of fat in milk, butter and cheese on blood lipid profile of consumers and concluded that the effects of butter were most predisposing the consumer to developing coronary hearts diseases. Karvonen et al. (2002), Kim et al. (2006) and Korpela et al. (2006), substituted milk-fat with vegetable oils in cheese making, while Abou-Zeid (1992) replaced part of milk used for cheese making with buttermilk. They all observed an improvement in the lipid profile characteristics of consumers with regards to the risk of developing cardiovascular diseases.
Also, studies on the effects of spices especially ginger (Zingiber officinale Roscoe) and their extracts on lipid profile have reported favourable outcomes with regards to cholesterol levels. For example, Bhandari et al. (2005), observed a significant lipid lowering activity of ethanol extract of Zingiber officinale in diabetic rats. Al-Amin et al. (2006) concluded that raw ginger possessed hypoglycaemic, hypocholesterolaemic and hypolipidaemic potential. Tanabe et al. (1993) isolated principles from ginger observed to exhibit an inhibitory effect on cholesterol biosynthesis. Meanwhile Psomas et al. (2003) observed that some yeasts strains including Saccharomyces cerevisiae and Isaatchenkia orientalis isolated from infant faeces and a Greek Feta cheese removed cholesterol from growth media, from after 24 h of incubation at 37oC.
However, there are no reports on the incorporation of ginger as a spice in cheese making and possible nutritional effects of the ginger-spiced cheese on blood lipid profile and normal functioning of the body. The aim of this work therefore, was to evaluate the nutritional merits of ginger-spiced cheese in terms of body weight gain and feed utilization, blood lipid profile and implantation of micro-organisms in the gastrointestinal tract of consumers.
MATERIALS AND METHODS
Cheese: The cheese for this work was made following the procedure described by Mendi et al. (2009). However, the cheese for the experiment on rats had ginger powder incorporated at: 0.0, 1.0 and 1.5 g ginger powder/100 g of milled curd, while that for the human experiment had ginger powder incorporated at 0.0 and 1.0 g ginger powder/100 g of milled curd.
Two batches of cheese were made for the trial on rats and transported in cold-chain from the Food Technology laboratory of the Institute of Agricultural Research for Development (IRAD) Bambui in the North-West Region of Cameroon to the Animal Health laboratory of IRAD Wakwa-Ngaoundere in the Adamaoua Region and stored in a freezer till used.
Rat chow: The ingredients used to compound the rat chow were: wheat bran, corn meal, soybean meal, fish meal and common salt (Table 1).
Experimental animals: Forty (40) male Wistar rats, 6-10 weeks old, were purchased from the animal house of the Faculty of Science of the University of Yaoundé I, Cameroon and transported in plastic baskets to IRAD Wakwa-Ngaoundere.
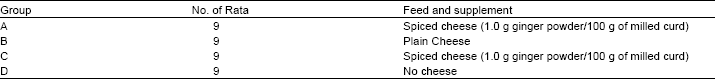
After one week of conditioning the rats to the environment and feed, 36 of them were randomly distributed into four groups (group average weights, 244.4, 229.3, 237.3 and 238.5 g) for a complete randomized block (animals’ weights) design trial. The groups were randomly assigned to feed supplementation regimes as follows: group A; cheese containing 1.0 g ginger powder/100 g of milled curd, group B; plain (no ginger) cheese; group C; cheese containing 1.5 g ginger powder/100 g of milled curd and group D no cheese (Table 2).
| Table 1: | Formulation for 1kg of rats chow |
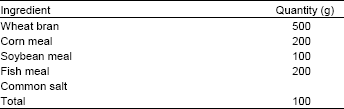 | |
The 9 rats in a group were distributed into three polypropylene cages (3 rats/cage) and all the cages were housed in a well ventilated, natural day light/night darkness cycle, laboratory room. All groups had water and consumed the basic feed ad libitum throughout the four weeks of the experiment. However, feed was withdrawn from the feeding tray to enable the rats have equal access to the cheese when served. Cheese was served as a supplement every morning at the rate of 10 g per rat, made into a bolus of 30 g per cage. The cheese was also reduced by 10 g per rat for cages in which rats died. The rats were fed for one week in their set up cages and groups and baseline data collected prior to start of cheese supplementation.
Before the start of feeding cheese, the rats were weighed; blood samples were collected and total cholesterol, triglycerides and low-density lipoprotein cholesterol were assayed for baseline data.
Data collection: The rats were individually weighed weekly on a top loader electronic balance and weight recorded in grams. Feed and cheese not consumed were weighed and subtracted from the quantity of feed served.
After feeding the animals on the 28th day, feed was withdrawn by 11.30 p.m and the animals fasted overnight and were sacrificed the following morning. The rats were killed by chloroform anesthesia and blood was collected immediately in tubes that contained EDTA anti-coagulant. The blood was centrifuged, plasma separated and taken for lipid profile analysis same day. However, the samples were stored at -20oC and High-Density Lipoproteins cholesterol was determined two days later.
There was pathological examination of the rats and intestinal contents were collected for the enumeration of bacteria colonies, lactobacilli and yeasts and moulds.
Laboratory analysis: The determination of triglycerides, total cholesterol, High-density Lipoprotein Cholesterol (HDL-C) and Low-density Lipoprotein Cholesterol (LDL-C) was carried out at the Lutheran Mission Hospital Laboratory in Ngaoundere town. The reagent analytical kits for lipid profile were purchased from representatives of Human Gesellschaft fur Biochemica und Diagnostica mbH- Wiesbaden Germany.
The procedure for using the kits and carrying out the analysis was described in the manufacturer’s instructions sheets. The Spectrophotometer (HUMAN 3000 Germany) used for reading the absorbance automatically adjusted the standard and blank readings.
Microbiological analysis for total colony counts of bacteria, Lactobacilli and Yeasts and moulds were carried out following routine plating procedures as described by Harrigan and McCance (1976). Dilutions of samples, 10-3, 10-4, 10-5 and 10-6 were plated in duplicates, on Plate Count Agar (PCA) and incubated at 30oC for 72 h for total bacteria counts and on Potato Dextrose Agar (PDA) and incubated at 22-24oC for 5 days for total yeasts and moulds counts. Dilutions of 10-1, 10-2, 10-3 and 10-4 were plated on ROGOSA agar and incubated at 30oC for Lactobacilli counts. The colonies were counted manually on an electric lit Gallenkamp colony counter and only plates of between 30 and 300 colonies were counted.
Data organization and analysis: Body weight change percentage for the rats was calculated as follows:
Feed Efficiency Ratio was calculated as:
Data were subjected to analysis of variance (ANOVA) using XLSTAT 2007 Version. 8.04 with Fisher Least Significant Difference (LSD) to compare means.
RESULTS
Body weight changes and feed efficiency ratio: On the average, the rats of groups A, B and C on (1.0; 0.0; 1.5 g ginger-powder/100 g of milled curd) ginger-spiced cheese supplement, gained weight through out the experimental period, group D (no cheese supplement) lost weight from week 1-2. The weight increases of groups A and C were very steady (linear) compared to groups B and D (Fig. 1). Weight changes of group D (decrease and then increase) remained significantly (p<0.05) lower than those of groups A, B and C and weight increase of group C was significantly (p<0.05) higher than that of group A for week 3 (Fig. 1).
Feed efficiency ratio changes were similar to body weight changes where the averages for group D (no cheese supplement) animals were significantly (p<0.05) lower than those of groups A, B and C on (1.0. 0.0, 1.5 g ginger powder/100 g of milled curd) cheese supplement (Fig. 2). Although not significant (p>0.05), feed efficiency ratio was higher for group B (no ginger in cheese) than groups A (1.0 g ginger powder/100 g of milled curd) and C (1.5 g ginger powder/100 g of milled curd) that received ginger-spiced cheese supplement respectively (Fig. 2). Also, group C insignificantly (p>0.05) remained superior to group A in both body weight gain (Fig. 1) and feed efficiency ratio (Fig. 2).
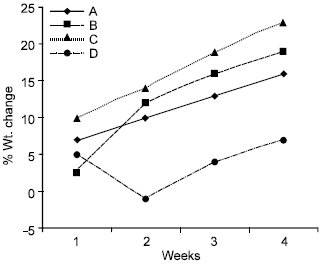 | |
| Fig. 1: | Body weight changes of rats supplemented with cheese |
Rat groups were supplemented with cheese that contained ginger powder as follows: |
| A: 1.0, B: 0.0, C: 1.5 g/100 g milled curd, D: no cheese. Wt stands for weight, D<A, B and C throughout; C>A in week 3 (p<0.05) |
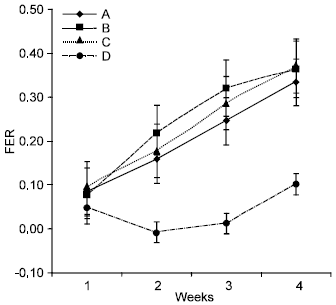 | |
| Fig. 2: | Feed Efficiency Ratio of rats supplemented with cheese |
Rat groups were supplemented with cheese that contained ginger powder as follows: |
| A: 1.0, B: 0.0, C: 1.5 g/100 g milled curd, D: no cheese. FER stands for Feed Efficiency Ratio; D<A, B and C; p<0.05 |
| Table 2: | Groups of Rats and feed assigned |
 | |
| Table 3: | Blood lipid profile of rats after cheese supplementation |
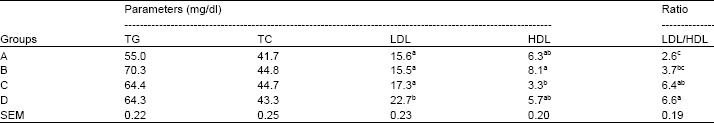 | |
| Different letter superscripts on the same column are significantly different, p<0.05, SEM = standard error of the mean, Rat groups were supplemented with cheese that contained ginger powder as follows:, A: 1.0B: 0.0C: 1.5g/100 g milled curdD: no cheese Parameters were: TG: triglycerides, TC: total cholesterol, LDL: low-density lipoprotein cholesterol, HDL: high-density lipoprotein cholesterol | |
Blood lipid profile of rats: Table 3 shows the general blood lipid profile after feeding rats in four groups (A, B, C, D) for four weeks with cheese supplementation for three groups. Parameters determined were: Triglycerides (TG), Total Cholesterol (TC), High-density Lipoprotein (HDL) cholesterol, low-density (lipoprotein LDL) cholesterol and the LDL/HDL ratio. There were no significant (p>0.05) differences in triglycerides and total cholesterol levels. LDL cholesterol level of group D (no cheese supplement) was significantly (p<0.05) higher than those of groups on cheese supplement, that is, A (1.0 g ginger powder/100 g of milled curd), B (no ginger in cheese) and C (1.5 g ginger powder/100 g of milled curd). HDL cholesterol level of group B was significantly (p<0.05) higher than that of group C. The LDL/HDL ratio of group D was significantly (p<0.05) higher than that of group A.
The intestinal microflora of rats: The results of the enumeration of rats’ intestinal microorganisms after cheese supplementation for four weeks are presented on Table 4 as average counts. The microorganisms of concern were total bacteria, Lactobacilli and yeasts and moulds. The total colony counts of bacteria for group D (no cheese supplement) was significantly (p<0.05) lower than those of groups A (1.0 g ginger powder/100 g of milled curd), B (no ginger in cheese) and C (1.5 g ginger powder/100 g of milled curd). Within the cheese supplemented groups, the total colony counts of bacteria of group C (126.08x10⁷ cfu/g) were quite high compared to A (88.83x10⁷ cfu/g) and B (83.80x10⁷ cfu/g). The counts of Lactobacilli for group C were significantly (p<0.05) higher than for the other groups, while the total colony counts of yeasts and moulds for group B were significantly higher than for the other groups.
DISCUSSION
Body weight changes and feed efficiency ratio: Cheese is a concentrated or compact nutrient and energy source (Potter and Hotchkiss, 1995; Lamarche, 2008). And as according to Krissansen (2007), many adults consume cow’s milk and milk products as part of a healthy diet because the dairy products provide protein and essential nutrients like vitamins and minerals, especially calcium.
The significant (p<0.05) higher body weight gain and feed efficiency ratio of the cheese supplemented groups (A,B,C) over group D (fed standard diet) through out the trial supports Solomon et al. (2008) observations that nutrients, especially protein of animal origin are of good quality and better utilized. Solomon et al. (2008) reported significantly (p<0.05) higher body weight gain and feed efficiency ratio values for rat groups that were fed diets with crayfish and grasshopper as protein source over the control and a soybean protein source diets.
The significant (p<0.05) higher body weight gain of group C (1.5 g ginger powder/100 g of milled curd) over group A (1.0 g ginger powder/100 g of milled curd) ginger-spiced cheese supplement indicated the positive effect of the level of ginger in cheese on consumers body weight gain. Ginger stimulates digestion, beneficially enhancing the digestive activities of enzymes like the intestinal lipase, the disaccharidases, sucrase and maltase (Platel and Srinivasan, 1996).
Blood lipid profile of Rats: Results obtained were similar to those of Ajayi and Ajayi (2009) who reported a significant increase in the concentration of serum HDL cholesterol when rats were fed fermented melon seed oil diet and a significant decrease in palm kernel oil fed rats compared to the control (soybean oil fed rats). LDL/HDL ratio of the fermented melon seed group was also significantly lower than those of the control (soybean oil) and palm kernel oil fed rats.
| Table 4: | Rats’ intestinal microflora after cheese supplementation |
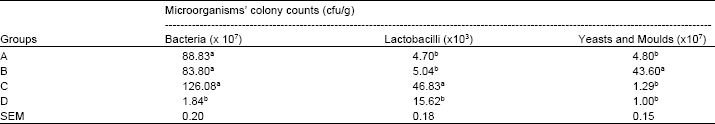 | |
| Different letter superscripts in the same column were significantly different, p<0.05, SEM = standard error of the mean, Rat groups were supplemented with cheese that contained ginger powder as follows: A: 1.0B: 0.0C: 1.5g/100 g milled curdD: no cheese | |
Al-Numair (2009) observed a significant decrease in plasma HDL-Cholesterol in rats fed a high cholesterol diet as compared to the control. There was also a significant rise in plasma total cholesterol, LDL-Cholesterol and triglycerides as compared to the control. Groups which received garlic extract treatment, showed a significant increased plasma HDL-Cholesterol and decreased plasma total cholesterol, LDL-Cholesterol and triglyceride as compared to rats fed a high cholesterol diet without the garlic treatment.
Converting the parameter values on Table 3 and expressing them as changes per day and comparing with values obtained by Ajayi and Ajayi (2009) and Al-Numair (2009), triglycerides were higher than even those of the high cholesterol diets. Considering the LDL/HDL ratios, treatment with 0.2 g garlic, was comparable with 1.0 g ginger powder/100 g of milled curd ginger-spiced cheese.
The intestinal microflora of Rats: Karthikeyan and Santhosh (2009) isolated Lactobacillus acidophilus (4.0x10⁵ cfu/g) from the gut of a prawn (P. monodon) and 9 out of 10 major pathogens including Staphylococcus aureus, Salmonella typhi, E. coli, Kelbsiella, Serratia and Pseudomona aeruginosa were sensitive to the isolated L. acidophillus. Adesokan et al. (2009) also observed that lactic acid, produced by lactic acid bacteria, exhibited inhibitory activity against some pathogenic microorganisms especially S. aureus, E. coli and Pseudomonas spp.
According to Ross et al. (2002), cheese could be an excellent carrier of some health-promoting bacteria, having some advantages over other fermented milk products as a delivery system for some probiotic strains. Other workers on probiotics had concluded that the starter culture microorganisms, together with other microorganisms inherent in cheese, render it a useful source of probiotic bacteria (Shah and Lankaputhra, 1997; Dave and Shah, 1997; Sarkar and Misra, 2001).
The total bacteria counts and lactobacilli were quite encouraging for the group that were supplemented on 1.5 g ginger powder/100 g of milled curd ginger-spiced cheese. This result supports Ross et al. (2002) conclusion that cheese could be an excellent bacteria carrier food. Also, the Lactobacilli counts of 46.83x10³ cfu/g for group C, though less than the L. acidophilus counts by Karthikeyan and Santhosh (2009), could still enable the cheese sample consumed by this group be considered a good probiotic carrier food. The significantly (p<0.05) higher numbers of Lactobacilli in the guts of group C animals supports Weil (1995) assertion that within the gastrointestinal tract, ginger reduces the total volume of gastric juices, prevents the irritation of the digestive tract and has a balancing ability that stimulates and inhibits toxic bacteria but allows friendly bacteria to grow. As the Lactobacilli were generally enumerated, it is possible that there could be some strains with other health benefits, for example, Pereira and Gibson (2002) isolated a strain of probiotic Lactobacilli that could remove 14.8 mg of cholesterol per g of cells from culture medium. Also, Safalaoh (2006) observed a significant body weight gain, better feed conversion ratio and lower serum cholesterol when effective microorganisms (EM, composed of lactic acid bacteria species) were included in chicken feed. Similarly, the microorganisms in the cheese samples could have contributed positively to the body weight gain, feed efficiency ratio and the cholesterol changes observed.
The high numbers of yeasts and moulds in the guts of the animals which consumed plain cheese (group B) may indicate that the ginger-spiced cheese diet created an environment which could not enhance the establishment and growth of yeasts and moulds. Ficker et al. (2003) investigated antifungal activity of some plant extracts, including ginger and concluded that the ginger extract was one of the most powerful against a wide variety of fungi.
Conclusion: Results of this study have revealed that the nutritional advantages of cheese outweighed the disadvantages. And that incorporating ginger into cheese during manufacture significantly improved the nutritional advantages of the cheese.
ACKNOWLEDGMENTS
The authors would like to appreciate the administration of IRAD Wakwa Centre, especially the Regional Chief of Centre, Dr. Messine, for facilitating this work; The Regional Scientific Coordinator of IRAD Wakwa Centre, Dr. Achukwi M. Daniel, for his financial and material support and Dr. Manchang Kingsley, Mrs Wachong Kum Hendrietta and Miss Nsah Dorothy who helped in data collection.
REFERENCES
- Abou-Zeid, N.A., 1992. New type of domiati cheese of potential benefit to people with high blood cholesterol. J. Dairy Res., 59: 89-94.
PubMed - Ajayi, O.B. and D.D. Ajayi, 2009. Effect of oilseed diets on plasma lipid profile in albino rats. Pak. J. Nutr., 8: 116-118.
CrossRefDirect Link - Al-Amin, Z.M., M. Thomson, K.K. Al-Qattan, R. Peltonen-Shalaby and M. Ali, 2006. Anti-diabetic and hypolipidaemic properties of ginger (Zingiber officinale) in streptozotocin-induced diabetic rats. Br. J. Nutr., 96: 660-666.
PubMedDirect Link - Al-Numair, K.S., 2009. Hypocholesteremic and antioxidant effects of garlic (Allium sativum L.) extract in rats fed high cholesterol diet. Pak. J. Nutr., 8: 161-166.
CrossRefDirect Link - Bhandari, U., R. Kanojia and K.K. Pillai, 2005. Effect of ethanolic extract of Zingiber officinale on dyslipidaemia in diabetic rats. J. Ethnopharmacol., 97: 227-230.
CrossRefDirect Link - Dave, R.I. and N.P. Shah, 1997. Effectiveness of ascorbic acid as an oxygen scavenger in improving viability of probiotic bacteria in yoghurts made with commercial starter cultures. Int. Dairy J., 7: 435-443.
CrossRefDirect Link - Ficker, C.E., J.T. Arnason, P.S. Vindas, L.P. Alvarez and K. Akpagana et al., 2003. Inhibition of human pathogenic fungi by ethnobotanically selected plant extracts. Mycoses, 46: 29-37.
CrossRefDirect Link - Harrigan, W.F. and M.E. McCance, 1976. Laboratory Methods in Food and Dairy Microbiology. 1st Edn., Academic Press, London, pp: 25-29.
Direct Link - Karthikeyan, V. and S.W. Santhosh, 2009. Study of bacteriocin as a food preservative and the L. acidophilus strain as probiotic. Pak. J. Nutr., 8: 335-340.
CrossRefDirect Link - Karvonen, H.M., N.S. Tapola, M.I. Uusitupa and E.S. Sarkkinen, 2002. The effect of vegetable oil-based cheese on serum total and lipoprotein lipids. Eur. J. Clin. Nutr., 56: 1094-1101.
PubMed - Kim, J.J., S.H. Yu, W.M. Jeon and H.S. Kwak, 2006. The effect of evening primose oil on chemical and blood cholesterol lowering properties of cheddar cheese. Asian-Aust. J. Anim. Sci., 19: 450-458.
Direct Link - Korpela, R., J. Tuomilehto, P. Hogstrom, L. Seppo and V. Piironen et al., 2006. Safety aspects and cholesterol-lowering efficacy of low fat dairy products containing plant sterols Guarantor. Eur. J. Clin. Nutr., 60: 633-642.
Direct Link - Krissansen, G.W., 2007. Emerging health properties of whey proteins and their clinical implications. J. Am. Coll. Nutr., 26: 713S-723D.
CrossRefDirect Link - Lamarche, B., 2008. Review of the effect of dairy products on non-lipid risk factors for cardiovascular disease. J. Am. Coll. Nutr., 27: 741-746.
Direct Link - Park, Y.W., 1999. Cholesterol contents of U.S. and imported goat milk cheeses as quantified by different colorimetric methods. Small Rumin. Res., 32: 77-82.
Direct Link - Pereira, D.I.A. and G.R. Gibson, 2002. Cholesterol assimilation by lactic acid bacteria and bifidobacteria isolated from the human gut. Applied Environ. Microbiol., 68: 4689-4693.
CrossRefPubMedDirect Link - Piironen, V., J. Toivo and A.M. Lampi, 2002. New data for cholesterol contents in meat, fish, milk, eggs and their products consumed in finland. J. Food Compos. Anal., 15: 705-713.
Direct Link - Platel, K. and K. Srinivasan, 1996. Influence of dietary spices or their active principles on digestive enzymes of small intestinal mucosa in rats. Int. J. Food Sci. Nutr., 47: 55-59.
CrossRefPubMedDirect Link - Psomas, E.I., D.J. Fletouris, E. Litopoulou-Tzanetaki and N. Tzanetakis, 2003. Assimilation of cholesterol by yeasts strains isolated from infant feces and feta cheese. J. Dairy Sci., 86: 3416-3422.
Direct Link - Ross, R.P., G. Fitzgerald, K. Collins and C. Stanton, 2002. Cheese delivering biocultures: Probiotic cheese. Aust. J. Dairy Technol., 57: 71-78.
Direct Link - Safalaoh, A.C.L., 2006. Body weight gain, dressing percentage, abdominal fat and serum cholesterol of broilers supplemented with a microbial preparation. Afr. J. Food Agric. Nutr. Dev., 6: 1-10.
Direct Link - Shah, N.P. and W.E.V. Lankaputhra, 1997. Improving viability of Lactobacillus acidophilus and Bifidobacterium spp. in yogurt. Int. Dairy J., 7: 349-356.
CrossRefDirect Link - Tanabe, M., Y.D. Chen, K.I. Saito and Y. Kano, 1993. Cholesterol biosynthesis inhibitory component from Zingiber officinale Roscoe. Chem. Pharmaceut. Bull., 41: 710-713.
CrossRefDirect Link - Tholstrup, T., C.E. Hoy, L.N. Andersen, R.D.K. Christensen and B. Sandstrom, 2004. Does fat in milk, butter and cheese affect blood lipids and cholesterol differently. J. Am. Coll. Nutr., 23: 169-176.
Direct Link