
Mohammed Amin Mohammed
Department of Internal Medicine, Gastroenterology, Hepatology and Endoscopy Unit, Faculty of Medicine, Mansoura University, Egypt
LiveDNA: 20.15383
Nesreen Moustafa Omar
Department of Histology and Cell Biology, Faculty of Medicine, Mansoura University, Egypt
Soad Amin Mohammed
Department of Microbiology, Faculty of Pharmacy, Al-Azhar University, Egypt
Ahmed Mohammed Amin
Medical Student, Faculty of Medicine, Mansoura University, Egypt
Doaa Farouk Gad
Department of Internal Medicine, Gastroenterology, Hepatology and Endoscopy Unit, Faculty of Medicine, Mansoura University, Egypt
Pakistan Journal of Biological Sciences
Year: 2019 | Volume: 22 | Issue: 10 | Page No.: 457-466


ABSTRACT
Background and Objective: As liver biopsy had multiple procedure-related complications, the introduction of reliable noninvasive tests for accurate discrimination of NASH and liver fibrosis in patients with NAFLD are mandatory. The aim was to elucidate the diagnostic value of fibrosis-4 index (FIB-4), Homeostasis Model Assessment for Insulin Resistance (HOMA-IR) and Cytokeratin-18 fragments (CK18-Fs) in the prediction of NASH and liver fibrosis. Materials and Methods: One hundred Egyptian patients with NAFLD selected from outpatient's clinics of Mansoura University Hospitals underwent histological examination through liver biopsy after approval and consent. The FIB-4, HOMA-IR, CK18-Fs (measured using a human ELISA Kit) and their combination in FICK-3 score were investigated for predicting NASH and liver fibrosis. Receiver operating characteristic (ROC) curves and multivariate logistic regression were analyzed. Results: In patients with NAFLD, the areas under the ROC were significantly high (AUC: 0.765, 0.700, 0.803, 0.835 for FIB-4, HOMA-IR, CK18-Fs, FICK-3 score, respectively, p = 0.05) displaying a highly statistically significant predictive ability for NASH. Significantly higher AUCs for these parameters were demonstrated predicting early-or advanced-stage liver fibrosis (AUC >0.7, p<0.01). Also, the combined FICK-3 score (the sum of FIB-4 >1.46, HOMA-IR >2.11 and CK18-Fs >307U L–1) had highly significant predictive values for NASH and liver fibrosis and had the best diagnostic accuracy at a cutoff value of 1(AUC >0.8, p<0.001). Contrasted with other diagnostic scores, FICK-3 had the best diagnostic accuracy for detection of fibrotic NASH (AUC = 0.954, p<0.001) and positively correlated with the histological features of NAFLD. Conclusion: The new combination FICK-3 score was a reliable and significant predictor for NASH and liver fibrosis in NAFLD Egyptian patients.
PDF Abstract XML References Citation
Copyright: © 2019. This is an open access article distributed under the terms of the creative commons attribution License, which permits unrestricted use, distribution and reproduction in any medium, provided the original author and source are credited.
How to cite this article
Mohammed Amin Mohammed, Nesreen Moustafa Omar, Soad Amin Mohammed, Ahmed Mohammed Amin and Doaa Farouk Gad, 2019. FICK-3 Score Combining Fibrosis-4, Insulin Resistance and Cytokeratin-18 in Predicting Non-alcoholic Steatohepatitis in NAFLD Egyptian Patients. Pakistan Journal of Biological Sciences, 22: 457-466.
DOI: 10.3923/pjbs.2019.457.466
URL: https://scialert.net/abstract/?doi=pjbs.2019.457.466
DOI: 10.3923/pjbs.2019.457.466
URL: https://scialert.net/abstract/?doi=pjbs.2019.457.466
INTRODUCTION
Non-alcoholic fatty liver disease (NAFLD) and non-alcoholic steatohepatitis (NASH) are now considered the most common chronic liver disease in western countries; its prevalence increased up to 30% in the United States with a trend towards further increase. Moreover, more recent data confirm that they play an equally important role in the middle east, far east, Africa, the Caribbean and Latin America1. The NAFLD may have a benign course with just simple steatosis or progress to steatosis with inflammation, ballooning degeneration and pericellular fibrosis or Mallory's hyaline (non-alcoholic steatohepatitis, NASH). The NASH is a progressive disease that requires medical intervention with a prevalence of 3-5% in the general adult populations2. Up to 20% of patients with NASH will develop cirrhosis of the liver and 10% will suffer death related to their liver disease making NASH the second leading cause of liver transplantation3.
The NAFLD is closely associated with metabolic syndrome (MetS) including diabetes mellitus, central obesity, dyslipidaemia and insulin resistance. The MetS is common in patients with NAFLD and is associated with an increased propensity to have NASH4. Therefore, it has been suggested that the presence of MetS in patients with NAFLD may serve as a potential criterion for liver biopsy which is still the gold standard for diagnosis of simple hepatic steatosis and the only way to distinguish it from NASH5.
Accurate differentiation of NASH from NAFLD and the evaluation of the presence of liver fibrosis determining prognosis and optimal therapy became an interesting area of research. Liver biopsy was postulated to be the most authoritative diagnostic approach identifying NASH and the consequent fibrosis in NAFLD patients6. Nevertheless, it is local, invasive and limited by sampling error, misdiagnosis, inter-operational variability, cost and maneuver-related risk of mortality and morbidity. Serum aminotransferase and imaging techniques (ultrasound, CT, MRI) offered inadequate reliability in assessing NASH and liver fibrosis in NAFLD patients7. Thus, clinical and biochemical parameters that would correlate with liver biopsy have to be searched for aiming at identifying non-invasive test(s) that may aid not only in the diagnosis of NAFLD but also for early prediction of NASH and monitoring disease progression and response to therapy.
Liver fibrosis is the only histological feature associated with long-term outcome of patients with NAFLD8. So, diagnosis of liver fibrosis is the most important issue in clinical practice. Several noninvasive serologic markers have been developed to predict NASH and determine the degree of liver fibrosis9. However, serum tests of aminotransferases, GGT, AST/ALT ratio, components of extracellular matrix (hyaluronic acid; HA) are not helpful or may have little or modest diagnostic/predictive ability in identifying the presence of liver fibrosis10.
Multiple serum cytokines, TNF-α, IL-6, hsCRP, Adiponectin, resistin, Pentraxin-3 had been evaluated for predicting NASH yet with variable and inconsistent results. Several complex models and scores had been created with variable predictive ability in NASH, the majorities of such models and scores had not been externally validated and were obtained from certain populations, mostly morbidly obese patients11.
On the other hand, several models and scores had been developed predicting NASH and liver fibrosis with reasonable diagnostic performance. Of the proposed models with consistent results; the BAAT score which incorporated BMI, Age, ALT, TG and yielded 100% sensitivity but not specific12, NAFLD fibrosis score (NFS) which incorporated Age, DM, BMI, platelet count, albumin and AST/ALT ratio and has a great diagnostic accuracy for advanced fibrosis stages13 and BARD score incorporating BMI, AST/ALT Ratio and DM yet it had lower accuracy and worse performance than NFS14.
Among the several investigated noninvasive biomarkers are the cytokeratin-18fragments (CK18-Fs) with consistent results in differentiating NASH from NAFL15. The CK18-Fs are marker of hepatocyte apoptosis and necrosis. The CK-18Fs are produced mainly by caspase3 and played crucial roles in the pathogenesis of chronic liver disease and NAFLD16.
Fibrosis-4 index (FIB-4) has been developed mainly to predict liver fibrosis in viral hepatitis. Some studies investigated FIB-4 in patients with NAFLD5. Some authors established new scoring systems as significant predictors of NASH in NAFLD patients such as FIC-22 score combining FIB-4 and CK18-Fs17.
Despite the simplicity of different fibrosis score(s) based on clinical and biochemical laboratory results such as BAAT, NFS, BARD, FIB-4 and FIC-22, their diagnostic performance seems inadequate in accurate discrimination of disease stages. Moreover, the use of any of these tests or scores alone is likely not sufficient to rule in or rule out significant disease. Therefore, other non-invasive model(s) with robust analytical and clinical validation for detecting NASH and liver fibrosis are mandatory.
The aim of this study was to assess the reliability of a new scoring system (FICK-3) combining FIB-4 index, Insulin resistance (HOMA-IR) and Cytokeratin-18-fragments (CK-18Fs) as a predictor of NASH development and/or progression to liver fibrosis in Egyptian patients with NAFLD.
MATERIALS AND METHODS
Materials: A total of 150 adult consecutive outpatients older than 18 years with ultrasonographic evidence of fatty liver were conveniently selected from outpatient’s obesity clinics of Mansoura University Hospitals after a written informed conscious consent during the period from May, 2017 through 2019. The study was conducted in accordance with the Declaration of Helsinki and Good Clinical Practice Guidelines and was approved by the Institutional Review Board of Mansoura Faculty of Medicine (MFM-IRB; R.19.06.536).
Inclusion criteria: Patients with ultrasonographic evidence of fatty liver and/or anthropometric and laboratory evidence of MetS according to the International Diabetes Federation (IDF) metabolic syndrome world wide definition: [at least three of the following: Waist circumference (>94 cm in men and >80 cm in women), hypertension (systolic bp >135 mmHg and diastolic bp > 85 mmHg), diabetes (FBS >100 mg dL–1), hyperlipidemia (TG >150 mg dL–1, HDL-C 40 mg dL–1 in men and 50 mg dL–1 in women)] 18.
Exclusion criteria: Presence of possible secondary causes of fatty liver disease; alcohol abuse, intestinal malabsorption, drug-or toxin-induced liver steatosis (e.g., amiodarone, tamoxifen, glucocorticoids, synthetic estrogens, diltiazem, aspirin, methotrexate, highly active antiretroviral therapy), viral hepatitis and autoimmune liver diseases. Presence of contraindication to do liver biopsy; coagulopathy, decompensated chronic liver disease, patients refused to sign consent, low platelet count <50000 mm–3, INR >1.5. Others; advanced chronic or psychiatric illness, extremes of age (Age <18 year and age >70 year), renal impairment, pregnancy, endocrinal and cardiopulmonary diseases, cardiac failure (ejection fraction <50%).
Methods: Initially, all participants were submitted to thorough history taking with special emphasis on age, lifestyle and symptoms suggestive of liver disease (fatigue, malaise, jaundice, abdominal discomfort, hepatosplenomegaly).
Anthropometric measurements: Body weight, standing height and waist circumference (WC) were measured to the nearest 0.1kg, 0.1cm, 0.1 cm, respectively. The BMI (kg m–2) calculated as body weight in kilograms divided by the square of their height in meters. The patient was considered non-obese when the BMI <25 kg m–2, Overweight when BMI 25-29.9, class I mild obese when BMI 30-34.9 class II moderate obese when BMI 35-39.9 and class III morbid obese when BMI >40 kg m–2.
Laboratory biochemical evaluations: Venous blood samples were obtained from each subject after a minimum of 10 h of fasting. Serum tubes were centrifuged at 3000 for 15 min at 4°C, aliquoted and stored at -70°C until assayed. White blood cell (WBC) count, hemoglobin, hematocrit, platelet count, serum albumin, bilirubin, serum transaminases, gamma glutamyltransferase (GGT), alkaline phosphatase (ALP), erythrocyte sedimentation rate (ESR) and high sensitive C-reactive protein (hs-CRP) were tested. Prothrombin time, INR, serum creatinine, ANA, serum iron, viral serological markers, fasting and 2 h postprandial blood glucose, serum total cholesterol, triglycerides and high-density lipoprotein-cholesterol (HDL-c) were determined by enzymatic methods with a chemistry analyzer (Hitachi747, Japan, Tokyo).
Cytokeratin 18-fragments (CK18-Fs) levels were measured using a human CK-18-Fs/KRT18 (Cytokeratin 18) ELISA Kit (catalog number: E-EL-H2072) following the manufacturer's guidelines (Elabscience, Houston, Texas, USA). Detection range: 6.25-400 mIU mL–1). The intra-assay and inter-assay coefficient variation were 6.05 and 5.75%, respectively, sensitivity 3.75 mIU mL–1. The FIB-4 index was calculated to all patients using the following equation19:
![]()
The aspartate aminotransferase (AST)-to-platelet ratio index (APRI) was calculated using this equation20:
![]()
The plasma insulin was measured by immunoradiometric assay (INS-IRMA; Catalog# KIP1251, DIAsource ImmunoAssays S.A. - Rue du Bosquet, 2-B-1348 Louvain-la-Neuve - Belgium). The minimum detectable concentration was 1 μIU mL–1 and the inter-assay and intra-assay coefficients of variation (CVs) were 6.3 and 2.4%, respectively. The insulin sensitivity and/or resistance were calculated with the homeostasis model assessment (HOMA-IR) for insulin resistance21:
HOMA-IR US formula:
Fasting glucose (mg dL–1)×Fasting insulin (μU mL–1)/405
The FICK-3 score was calculated as the unweighted sum of the points obtained from the following three variables; FIB-4 >1.45, HOMA-IR>2.11 and Cytokeratin 18-fragment CK18-Fs>307U mL–1; one point for each variable.
Histopathological examination of liver biopsy specimens: Ultrasound-guided percutaneous tru-cut needle liver biopsy was performed in selected patients after consent at the seventh or eighth intercostal space in the midaxillary line. A core of liver tissue was obtained while the patient holds his breath in expiration. A sample about 1.5 cm long and 1-2 mm wide is considered adequate for histopathological assessment. The sample was preserved in 10% formalin. The biopsy specimens taken were embedded in Paraffin blocks, sectioned and stained with hematoxylin and eosin for conventional histopathological examination and Masson's trichrome for assessment of liver fibrosis. The specimens were analyzed by two independent well-trained histopathologists, who were blinded to the diagnosis, clinical data, the treatment and subject group identity. Diagnosis and staging of NASH were based upon the previously described histological criteria6. Types of NAFLD may be NAFL (Type1: Fat accumulation only, Type 2: Fat accumulation and lobular inflammation) or NASH (Type 3: Fat accumulation and ballooning degeneration, Type 4: Fat accumulation, ballooning degeneration and either Mallory-Denk bodies or fibrosis). Stages of fibrosis may be (F0: normal connective tissue or no fibrosis, F1: zone3 pericellular/perivenular fibrosis (Ia,b,c: mild, moderate, severe), F2: Zone 3 perisinusoidal, pericellular or periportal fibrosis, F3: Bridging or septal fibrosis, F4: Cirrhosis).
The NAFLD activity score (NAS) was developed to provide a numerical score for patients who most likely have NASH. Accordingly, NAS is calculated as the unweighted sum of the separate scores for steatosis (0-3 points), lobular inflammation (0-3 points) and hepatocellular ballooning (0-2 points). Definitive-NASH is described when NAS >5, while the Non-NASH score is NAS <3. The NAS of (3-4) points is defined as borderline-NASH. Fibrotic NASH is defined as NAS >4 and fibrosis stage >F2. This system was developed mainly to evaluate the disease activity and monitor the histological response with treatment, rather than NASH diagnosis22.
Statistical analysis: Statistical analysis was carried out using IBM-SPSS software version 21.0 (SPSS Inc, Chicago, IL). The normality of quantitative data was tested using Kolmogorov-Smirnov and Shapiro-Wilk’s test with data being normally distributed if p>0.05. Qualitative data were expressed as number and percentage. Quantitative data were expressed as mean±standard deviation (SD) if normally distributed or median and interquartile range (IQR) if not. Chi-Square test, Fisher’s exact test and Chi-Square test with Bonferroni adjustment were used for comparison when indicated. Independent-Samples t-test was used if quantitative data were normally distributed and the non-parametric alternative Mann-Whitney U test was used if not. Pearson's or Spearman's correlations were used for correlations between two normally or two abnormally distributed scales, respectively. Multivariate logistic regression analysis was used to detect the significant “independent” predictors of NASH with their OR (95% CI). Receiver operating characteristic (ROC) curve analysis was used to detect the diagnostic accuracy, predictive performance and a diagnostic cutoff value.
RESULTS
In this study, 150 patients with NAFLD (diagnosed by the presence of fatty liver on US) with a mean age of 47.12±3.8 years were recruited and evaluated by laboratory, biochemical and histopathological methods for the presence or absence of NASH. Only 100 patients agreed, signed a written consent and fit the criteria to do the diagnostic liver biopsy. Histologically, 66 out of 100 patients (66%) were diagnosed as NASH and the remainders were diagnosed as simple steatosis or NAFL.
The demographic data, clinical and biochemical scores, the histopathological features in all studied patients were demonstrated in Table 1. The frequency of NASH among patients with NAFLD was significantly higher than the frequency of simple steatosis (NAFL) (p = 0.041). Also, female patients had statistical significant higher frequency of NASH than male patients. Patients with NASH had statistical significant higher values than NAFL patients as regards BMI, GGT, transaminases, hsCRP, MetS, glycated hemoglobin, platelet count, fasting insulin, HOMA-IR and Cytokeratin 18-fragments (p<0.05 in all). Moreover, NASH patients had statistical significant higher values of FIB-4 index and APRI score (p<0.01). However, No significant difference was noticed between the two groups as regards hemoglobin, s. bilirubin, fasting glucose (p = 0.05). Indeed, NASH patients had significantly higher frequency of liver fibrosis and significantly higher values of NAS and biochemical scores (FICK-3, FIC-22 and MACK-3) than NAFL patients (p = 0.001).
| Table 1: | Demographic data, clinical, biochemical scores and histopathological features in all studied groups |
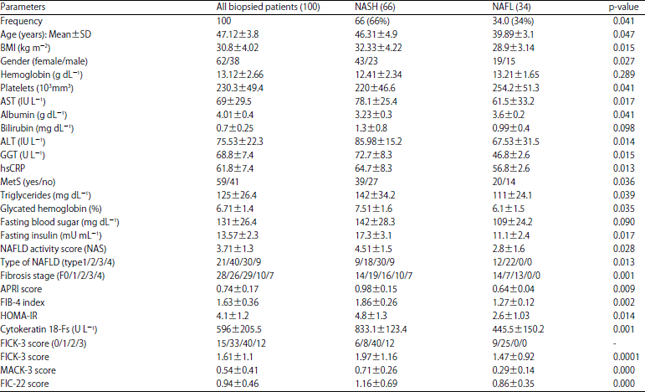 | |
Data were presented as Mean±Standard deviation (M±SD), NASH: Nonalcoholic steatohepatitis, NAFL: Nonalcoholic fatty liver, P: Probability value comparing NASH and NAFL, BMI: Body mass index, hsCRP: High sensitive C-reactive protein, MetS: Metabolic syndrome, ALT: Alanine transaminase, AST: Aspartate transaminase, GGT: Gamma glutamyl transferase, HOMA-IR: Homeostasis model assessment for insulin resistance, APRI: Aspartate aminotransferase-to-platelet ratio, CK18-Fs: Cytokeratin 18-fragments, FIB-4: Fibrosis-4, FICK-3 score: Sum of FIB-4, HOMA-IR and Cytokeratin 18-Fs, MACK-3: hoMa, Ast and Cytokeratin-18, FIC-22: FIB-4 and Cytokeratin-18, P: Probability value, Significance at p<0.05 | |
| Table 2: | Diagnostic accuracies of different parameters predicting nonalcoholic steatohepatitis (NASH) in patients with nonalcoholic fatty liver disease (NAFLD) |
 | |
95%CI: 95% confidence interval, P: Probability value and significance at p<0.05, SE: Standard error, AUC: Area under the curve, HOMA-IR: Homeostasis model assessment for insulin resistance, CK18-Fs: Cytokeratin 18-fragments, FIB-4: Fibrosis-4, FICK-3 score: Sum of FIB-4, HOMA-IR and Cytokeratin 18-Fs | |
The diagnostic performances and accuracies of the different parameters predicting the presence or absence of NASH in patients with NAFLD were demonstrated in Table 2. FIB-4 index, HOMA-IR, CK18-Fs and the new combination score FICK-3 were significant predictors of NASH in patients with NAFLD [AUC 95%CI: 0.739 (0.596-0.882), 0.700 (0.533-0.838), 0.768 (0.613-0.924), 0.817 (0.696-0.939), respectively; p = 0.05]. In the combined FICK-3 score (at a cutoff value of 1 point) the AUC 0.8 denoted great significant predictive value of NASH and had the best diagnostic accuracy (94.6%). Also, the sensitivity, specificity and diagnostic accuracy were highly significant in FIB-4 (90.9, 89.5 and 92.2%, respectively), HOMA-IR (85.1, 76.9 and 79.2%), CK18-Fs (89.7, 87.4 and 90.7%, respectively) and FICK-3 score (95.6, 91.1 and 94.6%, respectively), p<0.05 for all. Areas under the curve (AUC) values for these risk factors were >0.7, displaying statistically significant predictive values (p<0.05).
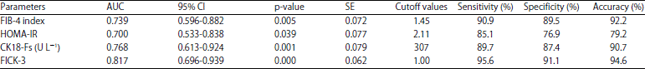
Table 3 demonstrated the AUROC values of different parameters that predicted the presence/absence of liver fibrosis and its grade in patients with NASH. The FIB-4 index, HOMA-IR, CK18-Fs and FICK-3 score had statistically significant predictive values for the presence of early-stage liver fibrosis (F3-2) in NASH patients with NAFLD [AUC 95% CI: 0.765 (0.621-0.968), 0.700 (0.532-0.893), 0.803 (0.650-0.956), 0.835 (0.561-0.903), respectively; p = 0.05].
| Table 3: | Diagnostic accuracies of different parameters in predicting liver fibrosis (LF) in patients with nonalcoholic steatohepatitis (NASH) |
 | |
95% CI: 95% confidence interval, P: Probability value and significance at p<0.05, SE: Standard error, AUC: Area under the curve, CK18-Fs: Cytokeratin 18-fragments, FIB-4: Fibrosis-4, HOMA-IR: Homeostasis model assessment for insulin resistance, FICK-3 score: Sum of FIB-4, HOMA-IR and Cytokeratin 18-Fs, MACK-3: hoMa, Ast and Cytokeratin-18, FIC-22: FIB-4 and Cytokeratin-18, F1-2: Early stage liver fibrosis, F3-4: Advanced stage liver fibrosis, F2-4: Fibrotic NASH | |
| Table 4: | Univariate and multivariate analysis for the independent predicting factors of nonalcoholic steatohepatitis in patients with nonalcoholic fatty liver disease (NAFLD) |
 | |
95%CI: 95% confidence interval, OR: Odds ratio, P: Probability value and significance at p<0.05, BMI: Body mass index, hsCRP: High sensitive C-reactive protein, GGT: Gamma glutamyl transferase, HOMA-IR: Homeostasis model assessment for insulin resistance, CK18-Fs: Cytokeratin 18-fragments, FIB-4: Fibrosis-4, FICK-3 score: Sum of FIB-4, HOMA-IR and cytokeratin 18-Fs | |
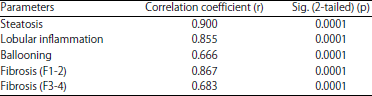
| Table 5: | Spearman’s rho correlation between FICK-3 score and histological features and fibrosis grade |
 | |
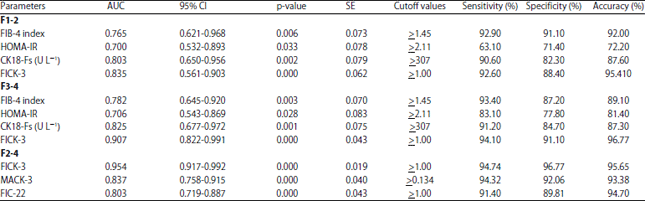
Moreover, their diagnostic accuracies in detecting the advanced-stages of liver fibrosis (F3-4) increased significantly especially in FICK-3 score (AUC 95%CI: 0.907 (0.822-0.991, p = 0.001). Contrasted with MACK-3 and FIC-22 scores, the FICK-3 score provided the highest significant diagnostic performance in discriminating cases with fibrotic NASH as defined by NAS >4 and F >2 (AUC 95%CI: 0.954 (0.917-0.992, p = 0.001).
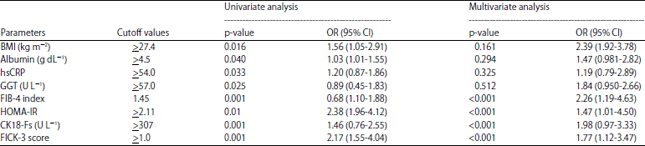
Multivariate analysis were performed using the significant covariates in univariate analysis and displayed in Table 4. At specific cutoff values obtained from the ROC curve analyses, FIB-4 index (>1.46), HOMA-IR (>2.11), CK18-Fs (>307 U L–1) and the combined FICK-3 score (>1 point) demonstrated high statistical significant predictions for NASH and liver fibrosis in patients with NAFLD (p<0.01). The correlations between FICK-3 score and histological characteristics were elucidated in Table 5. The FICK-3 score showed highly significant positive correlations with the histological features and fibrosis grade (p = 0.0001).
The receiver operating characteristics (ROC) curves for FIB-4 index, HOMA-IR, CK18-Fs and FICK-3 score as predictors of NASH in patients with NAFLD were demonstrated in Fig. 1. The FICK-3 score had the highest significant diagnostic performance for the prediction of NASH (AUC 0.817, p<0.001). In Fig. 2, the combined FICK-3 score significantly predicted early-stage liver fibrosis (F1-2) compared with individual variables (AUC 0.835, p<0.001). As shown in Fig. 3, the FICK-3 score also demonstrated highly significant diagnostic value for detection of advanced-stage liver fibrosis (F3-4) compared with other parameters (AUC 0.907, p<0.001).
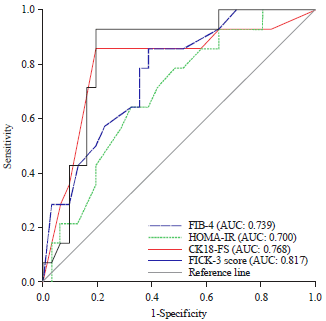 | |
| Fig. 1: | Receiver operating characteristics (ROC) Curves for fibrosis-4 index (FIB-4), HOMA-IR, cytokeratin 18-fragments (CK18-Fs) and FICK-3 score as predictors of non alcoholic steatohepatitis (NASH) in patients with NAFLD (NASH without liver fibrosis) |
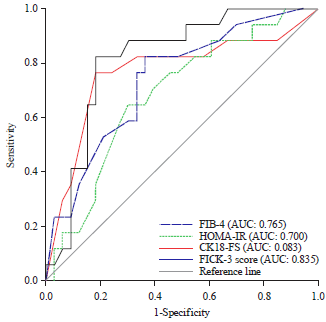 | |
| Fig. 2: | Receiver operating characteristics (ROC) curves for fibrosis-4 index (FIB-4), HOMA-IR, cytokeratin 18-fragments (CK18-Fs) and FICK-3 score in the detection of NASH with early-stage liver fibrosis (F1-2) in patients with NAFLD (Early-stage fibrosis, F1-2) |
While in Fig. 4, FICK-3 score had the best significant predictive performance for the prediction of fibrotic NASH (AUC 0.954, p<0.001) contrasted by MACK-3 score (AUC 0.837, p<0.001) and FIC-22 score (AUC 0.803, p = 0.001).
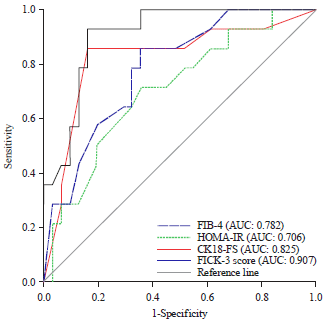 | |
| Fig. 3: | Receiver operating characteristics (ROC) curves for fibrosis-4 index (FIB-4), HOMA-IR, cytokeratin 18-fragments (CK18-Fs) and FICK-3 score in the detection of NASH with advanced-stage liver fibrosis (F3-4) in patients with NAFLD (Advanced-stage fibrosis, F3-4) |
 | |
| Fig. 4: | Receiver operating characteristics (ROC) curves comparing the FICK-3 score, MACK-3 score and FIC-22 score in diagnosis of fibrotic NASH in patients with NAFLD (NAS>4, F>2) |
DISCUSSION
As specific markers discriminating NASH in NAFLD patients are lacking, the authors in this study investigated the predictive value of other noninvasive markers and scores like FIB-4 index, HOMA-IR, CK18-Fs (either individually or combined in new scoring system; FICK-3) and correlated them with the histopathological characteristics. Also, there is no available data sufficiently assessing liver fibrosis noninvasively in NAFLD patients. Therefore, in this study, the reliabilities of FIB-4 index, HOMA-IR, CK-18Fs and FICK-3 were investigated not only in prediction of NASH but also in the determination of the absence or presence of liver fibrosis (F0, F1-4) in NAFLD patients.
In the current study, it was found that NASH was present in (66%) of Egyptian patients with NAFLD. In Egypt, the prevalence of NAFLD was reported to range from 10-18% with no reports for prevalence of NASH among Egyptian population23. This relatively high percentage may be explained by increasing the epidemic of obesity and westernization of the life style including junk food and sedentary behavior.
The relations between the clinical, biochemical parameters and NAFLD were extensively analyzed in several studies. Some authors found that MetS was an independent predictor for NASH and its individual histological features especially ballooning and fibrosis. Hepatic enzymes (ALT, AST), triglycerides were reported to be increased significantly in NAFLD. However, NASH can't be excluded in those with normal aminotransferases and triglycerides24. DM had a higher prevalence among patients with NASH. A previous study developed a simple model with significant accuracy for predicting NASH incorporating AST and diabetes25. Another study demonstrated an association of GGT with increased mortality in NASH26. Nevertheless, the majority of previous studies demonstrated that serum tests of aminotransferases, GGT, AST/ALT ratio, components of extracellular matrix (hyaluronic acid; HA) are not helpful or may have little or modest diagnostic/predictive ability in identifying the presence of liver fibrosis. In the current study, no significant predictive values were demonstrated for serum aminotransferases, GGT, AST/ALT ratio in discriminating liver fibrosis in NASH patients.
Of the extensively investigated tests and models with consistent results were Nice model incorporating (CK18-Fs, ALT and MetS)27, Apoptosis Panel incorporating (CK18-Fs, soluble Fas and Fas ligand)28. The Fibrosis-4 index and the AST-to-Platelet Ratio Index (APRI) score are validated noninvasive serologic measure for liver fibrosis based on routine laboratory data (platelets, ALT, AST and age)20,29-31. These scores are promising and were able to reliably determine mild to advanced fibrosis (F0-F4). This study demonstrated a great significant predictive and diagnostic ability of FIB-4 index (accuracy >92%, AUC >0.739, p<0.01) for NASH as well as for liver fibrosis regardless its stage.
The initial studies of CK-18Fs in the diagnosing NASH were promising yet the subsequent studies were disappointing32. Cusi et al.33 demonstrated that CK-18 when used alone had a limited diagnostic accuracy in distinguishing NASH from NAFLD or in determining the disease severity. They suggested combining CK-18 with other biological markers to achieve an accurate discrimination of NASH and liver fibrosis33. Polyzos et al.34 demonstrated that the CHA index with the following variables (CK-18, HOMA and AST) was significantly higher in NASH compared to NAFL or control groups and was significantly correlated with the severity of the histological lesions34. Boursier et al.35 proposed a new score MACK-3 combining the same variables in CHA index (HOMA-IR, AST and CK-18Fs) as a promising biomarker for diagnosing fibrotic NASH. The MACK-3 score was shown to be superior to other scores such as BARD score, NFS, FIB-4. They proposed MACK3 score, the algorithm of which is available as an online calculator, as a screening test for the fibrotic NASH with excellent diagnostic accuracy35. Nevertheless, Chuah et al.36 found that MACK-3 was superior to NFS and FIB-4 only in diagnosing the active component of fibrotic NASH. In advanced fibrosis stage >F2, MACK-3 was similar to NFS and FIB-4 in diagnosing fibrotic NASH36. The CHA index and MACK-3 score included the same parameters which are considered circulating reflectors of insulin resistance, hepatocellular dysfunction and apoptosis contributing to the pathogenesis of NAFLD. Higher ALT rather than AST is typical for NAFLD yet higher AST is more indicative of advanced liver disease. In this study, the replacement of AST by FIB-4 index in the current FICK-3 score significantly improved its diagnostic accuracy in predicting both early and advanced stages of fibrosis in NASH.
The results in this study showed not only significantly increased CK18-Fs levels in NASH, but also close correlations with the histological features like steatosis, ballooning, lobular inflammation and fibrosis stage in patients with NAFLD. The results in the present study evidenced that the CK18-Fs could serve as a reliable surrogate biomarker predicting not only NASH development, severity and progression but also the presence or absence of liver fibrosis in NAFLD patients. It is the only validated biomarker with the most consistent results differentiating steatosis from NASH.
Interestingly; the newly proposed FICK-3 score combining FIB-4, HOMA-IR and CK-18Fs in this study showed better diagnostic accuracy with higher prediction of NASH and liver fibrosis. Also, FICK-3 showed significant close correlations with the histological features like steatosis, ballooning, lobular inflammation and fibrosis stage in patients with NAFLD.
We compared the FICK-3 score proposed in this study with the previously proposed scores (such as FIC-22 and MACK-3 score) in the determination of fibrotic NASH. The FICK-3 score had the highest AUC95%CI, sensitivity and specificity denoting the best diagnostic performance in discrimination of advanced fibrosis in patients with NASH. The FICK-3 score had higher diagnostic ability for detecting early-stage liver fibrosis (F1-2) contrasted with FIC-22 score. Moreover, this study incorporated larger numbers of NAFLD patients with higher percentage of histopathologicaly evidenced NASH (66%). The results of FICK-3 score obtained in this work could ascertain the presence of NASH and/or liver fibrosis in NAFLD patients.
CONCLUSION AND RECOMMENDATIONS
In Egyptian patients with NAFLD, FIB-4 index, HOMA-IR and CK18-Fs were the most significant independent noninvasive predictors for NASH development and the presence or absence of liver fibrosis. The proposed FICK-3 score had reliable and acceptable diagnostic performance in discriminating NASH and liver fibrosis in NAFLD Egyptian patients. These observations could minimize the use of liver biopsy in diagnosis of NASH. Being a new score combing three important variables with greater diagnostic accuracy reflecting hepatic dysfunction, insulin resistance and apoptosis, it would offer adequate nucleus for a further validation study aiming to construct a screening test for fibrotic NASH.
Further large scale, multicenteric and validation cohort studies are adviced to validate this score as a screening test for NASH and liver fibrosis in patients with NAFLD.
SIGNIFICANCE STATEMENT
This study elucidated that FIB-4 index, HOMA-IR and CK18-Fs were reliable significant independent predictors for NASH development and progression in NAFLD Egyptian patients. Moreover, the new combined FICK3 score (the sum of HOMA-IR >2.11, CK18-Fs >307 U L–1 and FIB-4 index >1.46; one point for each variable) had significantly higher diagnostic accuracy for the prediction of early-as well as late-stage fibrotic NASH.
REFERENCES
- Zhu, J.Z., K. Hollis-Hansen, X.Y. Wan, S.J. Fei and X.L. Pang et al., 2016. Clinical guidelines of non-alcoholic fatty liver disease: A systematic review. World J. Gastroenterol., 22: 8226-8233.
CrossRefDirect Link - McCullough, A.J., 2004. The clinical features, diagnosis and natural history of nonalcoholic fatty liver disease. Clin. Liver Dis., 8: 521-533.
CrossRefPubMedDirect Link - Wong, R.J., M. Aguilar, R. Cheung, R.B. Perumpail, S.A. Harrison, Z.M. Younossi and A. Ahmed, 2015. Nonalcoholic steatohepatitis is the second leading etiology of liver disease among adults awaiting liver transplantation in the United States. Gastroenterology, 148: 547-555.
CrossRefDirect Link - Kanwar, P., J.E. Nelson, K. Yates, D.E. Kleiner, A. Unalp-Arida and K.V. Kowdley, 2016. Association between metabolic syndrome and liver histology among NAFLD patients without diabetes. BMJ Open Gastroenterol., Vol. 3.
CrossRefDirect Link - Marchesini, G., R. Marzocchi, F. Agostini and E. Bugianesi, 2005. Nonalcoholic fatty liver disease and the metabolic syndrome. Curr. Opin. Lipidol., 16: 421-427.
CrossRefDirect Link - Brunt, E.M., C.G. Janney, A.M. Di-Bisceglie, B.A. Neuschwander-Tetri and B.R. Bacon, 1999. Nonalcoholic steatohepatitis: A proposal for grading and staging the histological lesions. Am. J. Gastroentero, 94: 2467-2474.
CrossRefDirect Link - Sanyal, A.J., 2002. AGA technical review on nonalcoholic fatty liver disease. Gastroenterology, 123: 1705-1725.
CrossRefDirect Link - Angulo, P., D.E. Kleiner, S. Dam-Larsen, L.A. Adams and E.S. Bjornsson et al., 2015. Liver fibrosis, but no other histologic features, is associated with long-term outcomes of patients with nonalcoholic fatty liver disease. Gastroenterology, 149: 389-397.e10.
CrossRefDirect Link - Fierbinteanu-Braticevici, C., I. Dina, A. Petrisor, L. Tribus, L. Negreanu and C. Carstoiu, 2010. Noninvasive investigations for non alcoholic fatty liver disease and liver fibrosis. World J. Gastroenterol., 16: 4784-4791.
Direct Link - Chalasani, N., Z. Younossi, J.E. Lavine, A.M. Diehl and E.M. Brunt et al., 2012. The diagnosis and management of non‐alcoholic fatty liver disease: Practice guideline by the American association for the study of liver diseases, American college of gastroenterology and the American gastroenterological association. Hepatology, 55: 2005-2023.
CrossRefDirect Link - Machado, M.V. and H. Cortez-Pinto, 2013. Non-invasive diagnosis of non-alcoholic fatty liver disease. A critical appraisal. J. Hepatol., 58: 1007-1019.
CrossRefDirect Link - Ratziu, V., P. Giral, F. Charlotte, E. Bruckert and V. Thibault et al., 2000. Liver fibrosis in overweight patients. Gastroenterology, 118: 1117-1123.
CrossRefDirect Link - Angulo, P., J.M. Hui, G. Marchesini, E. Bugianesi and J. George et al., 2007. The NAFLD fibrosis score: A noninvasive system that identifies liver fibrosis in patients with NAFLD. Hepatology, 45: 846-854.
CrossRefDirect Link - Harrison, S.A., D. Oliver, H.L. Arnold, S. Gogia and B.A. Neuschwander-Tetri, 2008. Development and validation of a simple NAFLD clinical scoring system for identifying patients without advanced disease. Gut, Vol. 57.
CrossRefDirect Link - Feldstein, A.E., A. Wieckowska, A.R. Lopez, Y.C. Liu, N.N. Zein and A.J. McCullough, 2009. Cytokeratin‐18 fragment levels as noninvasive biomarkers for nonalcoholic steatohepatitis: A multicenter validation study. Hepatology, 50: 1072-1078.
CrossRefDirect Link - Yilmaz, Y., 2009. Systematic review: Caspase‐cleaved fragments of cytokeratin 18-the promises and challenges of a biomarker for chronic liver disease. Aliment. Pharmacol. Ther., 30: 1103-1109.
CrossRefPubMedDirect Link - Tada, T., T. Kumada, H. Toyoda, T. Saibara, M. Ono and M. Kage, 2018. New scoring system combining the FIB-4 index and cytokeratin-18 fragments for predicting steatohepatitis and liver fibrosis in patients with nonalcoholic fatty liver disease. Biomarkers, 23: 328-334.
CrossRefDirect Link - Alberti, K.G.M.M., P. Zimmet and J. Shaw, 2006. Metabolic syndrome-a new world-wide definition. A consensus statement from the international diabetes federation. Diabet. Med., 23: 469-480.
CrossRefDirect Link - Sterling, R.K., E. Lissen, N. Clumeck, R. Sola and M.C. Correa et al., 2006. Development of a simple noninvasive index to predict significant fibrosis in patients with HIV/HCV coinfection. Hepatology, 43: 1317-1325.
CrossRefDirect Link - Kruger, F.C., C.R. Daniels, M. Kidd, G. Swart, K. Brundyn, C. van Rensburg and M. Kotze, 2011. APRI: A simple bedside marker for advanced fibrosis that can avoid liver biopsy in patients with NAFLD/NASH. S. Afr. Med. J., 101: 477-480.
Direct Link - Matthews, D.R., J.P. Hosker, A.S. Rudenski, B.A. Naylor, D.F. Treacher and R.C. Turner, 1985. Homeostasis model assessment: Insulin resistance and β-cell function from fasting plasma glucose and insulin concentrations in man. Diabetologia, 28: 412-419.
CrossRefPubMedDirect Link - Kleiner, D.E., E.M. Brunt, M. van Natta, C. Behling and M.J. Contos et al., 2005. Design and validation of a histological scoring system for nonalcoholic fatty liver disease. Hepatology, 41: 1313-1321.
CrossRefPubMedDirect Link - Zaki, M., W. Ezzat, Y. Elhosary and O. Saleh, 2014. Predictors of non-alcoholic fatty liver disease in Egyptian obese adolescents. World Acad. Sci. Eng. Technol. Int. J. Med. Health Sci., 8: 685-688.
Direct Link - Kashyap, S.R., D.L. Diab, A.R. Baker, L. Yerian and H. Bajaj et al., 2009. Triglyceride levels and not adipokine concentrations are closely related to severity of nonalcoholic fatty liver disease in an obesity surgery cohort. Obesity, 17: 1696-1701.
CrossRefDirect Link - Gholam, P.M., L. Flancbaum, J.T. Machan, D.A. Charney and D.P. Kotler, 2007. Nonalcoholic fatty liver disease in severely obese subjects. Am. J. Gastroenterol., 102: 399-408.
PubMedDirect Link - Haring, R., H. Wallaschofski, M. Nauck, M. Dorr, S.E. Baumeister and H. Volzke, 2009. Ultrasonographic hepatic steatosis increases prediction of mortality risk from elevated serum gamma‐glutamyl transpeptidase levels. Hepatology, 50: 1403-1411.
CrossRefDirect Link - Anty, R., A. Iannelli, S. Patouraux, S. Bonnafous and V.J. Lavallard et al., 2010. A new composite model including metabolic syndrome, alanine aminotransferase and cytokeratin‐18 for the diagnosis of non‐alcoholic steatohepatitis in morbidly obese patients. Aliment. Pharmacol. Ther., 32: 1315-1322.
CrossRefDirect Link - Tamimi, T.I.A.R., H.M. Elgouhari, N. Alkhouri, L.M. Yerian and M.P. Berk et al., 2011. An apoptosis panel for nonalcoholic steatohepatitis diagnosis. J. Hepatol., 54: 1224-1229.
CrossRefDirect Link - Sumida, Y., M. Yoneda, H. Hyogo, Y. Itoh and M. Ono et al., 2012. Validation of the FIB4 index in a Japanese nonalcoholic fatty liver disease population. BMC Gastroenterol., Vol. 12.
CrossRefDirect Link - Mohammed, M.A. and N.M. Omar, 2019. Assessment of liver fibrosis after direct-acting antiviral therapy in compensated and decompensated HCV-related liver disease. Int. J. Innov. Res. Med. Sci., 4: 256-263.
CrossRefDirect Link - McPherson, S., S.F. Stewart, E. Henderson, A.D. Burt and C.P. Day, 2010. Simple non-invasive fibrosis scoring systems can reliably exclude advanced fibrosis in patients with non-alcoholic fatty liver disease. Gut, Vol. 59.
CrossRefDirect Link - Chan, W.K., P. Sthaneshwar, N.R.N. Mustapha and S. Mahadeva, 2014. Limited utility of plasma M30 in discriminating non-alcoholic steatohepatitis from steatosis-A comparison with routine biochemical markers. PLoS ONE, Vol. 9.
CrossRefDirect Link - Cusi, K., Z. Chang, S. Harrison, R. Lomonaco and F. Bril et al., 2014. Limited value of plasma cytokeratin-18 as a biomarker for NASH and fibrosis in patients with non-alcoholic fatty liver disease. J. Hepatol., 60: 167-174.
CrossRefDirect Link - Polyzos, S.A., J. Kountouras, A. Papatheodorou, E. Katsiki and K. Patsiaoura et al., 2013. Adipocytokines and cytokeratin-18 in patients with nonalcoholic fatty liver disease: Introduction of CHA index. Ann. Hepatol., 12: 749-757.
Direct Link - Boursier, J., R. Anty, L. Vonghia, V. Moal and T. Vanwolleghem et al., 2018. Screening for therapeutic trials and treatment indication in clinical practice: MACK‐3, a new blood test for the diagnosis of fibrotic NASH. Aliment. Pharmacol. Ther., 47: 1387-1396.
CrossRefDirect Link - Chuah, K.H., W.N.I.W. Yusoff, P. Sthaneshwar, N.R.N. Mustapha, S. Mahadeva and W.K. Chan, 2019. MACK‐3 (combination of hoMa, Ast and CK18): A promising novel biomarker for fibrotic non‐alcoholic steatohepatitis. Liver Int., 39: 1315-1324.
CrossRefDirect Link