
A. Mahjoub
Laboratory of Botanic of Inrat, Hedi Karray Street, 2049 Ariana, Tunisia
Mohamed Salah El Gharbi
Laboratory of Cereals Genetic of Inrat, Hedi Karray Street, 2049 Ariana, Tunisia
K. Mguis
Laboratory of Botanic of Inrat, Hedi Karray Street, 2049 Ariana, Tunisia
Mohamed El Gazzah
Genetic and Bio-Resources Unit, University of Sciences of Tunis, Tunis, Tunisia
N.B. Brahim
Laboratory of Botanic of Inrat, Hedi Karray Street, 2049 Ariana, Tunisia
Pakistan Journal of Biological Sciences
Year: 2009 | Volume: 12 | Issue: 14 | Page No.: 994-1003


ABSTRACT
Thirteen Aegilops geniculata Roth (geniculate goat grass) accessions from collection of the North and Central Tunisian (Cap-Bon, Mogodses, Kroumiry and the Dorsal areas) were used to assess its genetic diversity by morphological and Random Amplified Polymorphic DNA (RAPD) data and to evaluate relationship between morphological and RAPD markers. Nineteen morphological traits were analyzed on all accessions using Principal Analysis Component (PCA) and clusters were constrained based on median joining distances. Nineteen arbitrary universal primers were used for the amplification of random DNA sequences and generated 212 bands ranging from 0.5 to 3 kb with 71.27% polymorphism across the 13 accessions. Both RAPD and morphological data classified accessions in two main groups. Both methods were used to compare how morphological traits and RAPD molecular markers described accessions relationship and showed a high degree of variation among analyzed accessions, indicating an important source of genetic diversity that can be used in future breeding programs. Morphological PCA traits and cluster indicated climatic stage. In fact, they grouped Ae. geniculata accessions according to genetic criteria such as earliness and high kernel yield. Comparison of morphological and molecular data using the Mantel test indicated a non significant correlation (r = -0.268). Nevertheless, RAPD and selected morphological characters appear as useful and complementary techniques for evaluation of genetic diversity in Ae. geniculata.
PDF Abstract XML References Citation
How to cite this article
A. Mahjoub, Mohamed Salah El Gharbi, K. Mguis, Mohamed El Gazzah and N.B. Brahim, 2009. Evaluation of Genetic Diversity in Aegilops geniculata Roth Accessions using Morphological and RAPD Markers. Pakistan Journal of Biological Sciences, 12: 994-1003.
DOI: 10.3923/pjbs.2009.994.1003
URL: https://scialert.net/abstract/?doi=pjbs.2009.994.1003
DOI: 10.3923/pjbs.2009.994.1003
URL: https://scialert.net/abstract/?doi=pjbs.2009.994.1003
sINTRODUCTION
Aegilops geniculata Roth (Ae. ovata auct.) is an annual self-fertile plant, allo-tetraploid species (2n = 4x = 28) with MU genomes (Van Slageren, 1994), belonging to tribe Triticeae Dumort, subtribe Triticinae Griseb. It has a wide distribution in Asia and around the Mediterranean Sea region, characterized by a dry summer season with high ctemperature and high irradiance. Three annual species of Aegilops were reported in Tunisia (Cuénod et al., 1954): Ae. geniculata Roth, Ae. triuncialis L. and Ae. ventricosa Taush. Ae. geniculata Roth is widely distributed while the last two species are quite rare. Its geographical distribution would indicate a large distribution of climatic regions: cold and humid mountains, hot and dry valley. Habitats of Ae. geniculata Roth in the fertile crescent differ widely in the humid areas receiving around 800 mm and the lower arid area with less than 150 mm (Ben Brahim et al., 2002). Aegilops, is equally adapted to areas with altitude ranging from 10 to 900 m.
Several factors are contributed to the disappearance of the native flora, in particular, those of numerous local varieties and species. Consequently, loss of diversity is observed for all cultivated species and especially for gramineous species such as wild wheat and its cultivated derives. Efficient strategy to solve loss of plant diversity consists of exploiting wild germplasm genomes of wheat species, which preserve a good part of their adaptive factor, diseases tolerance and their genetic richness (Zaharieva et al., 2001). The introgression of a particular gene constituted the main objective of the improvement of wheat (Wang et al., 2000; Nevo et al., 2002). Therefore, it is necessary to have a thorough knowledge of the genetic relationship, ecological distribution and identification of desirable genes in the alien species to be used in breeding wheat varieties (Chan and Sun, 1997; Sun et al., 1999). Traditionally, evaluation of the genetic diversity in wheat has been based on the differences in agro-morphological traits or pedigree information (Sneller et al., 1997; Bernard et al., 1998). However, molecular markers are becoming essential tools in wheat breeding since they offer alternative solutions to many breeding problems resulting from the traditional phenotypic markers that are difficult and/or time-consuming to select by plant breeders (Najimi et al., 2003). They have been especially used for studying the genetic diversity among a number of species of the tribe Triticeae (Chalmers et al., 2001; Bai et al., 2003; Sun et al., 2003). In this context, several authors have already demonstrated the usefulness of RAPD at specific level in the genus of Aegilops (Zaharieva et al., 2001; Migdadi, 2006).
In order to assess, conserve and update the genetic diversity of the Tunisian Ae. geniculata Roth, we initiated a research program. It aims to collect the seeds of local Ae. geniculata species from different sites and evaluate their agro-morphological and molecular traits of breeding interest. Morphological distances clustering and phenologic RAPD clustering were compared to estimate correlation between morphological traits and RAPD marker.
MATERIALS AND METHODS
Plant material and morphological traits: Collecting missions were conducted in North and Central Tunisia (Cap-Bon, Mogodses, Kroumiry and the Dorsal areas) (Fig. 1), in spring during 2 years, 2000 and 2001. Thirteen accessions of Ae. geniculata have been collected. These wild materials were distributed in a wide range of climatic conditions (Table 1) with various site altitudes. Seeds of each accession were germinated in Jiffy pots placed in a greenhouse in early November 2002. Two weeks after emergence they were transplanted in the field of the National Institute of Agronomic Research of Tunisia (INRAT). The climate is typically Mediterranean, with mild winter and relatively hot summer. Plants were grown in natural conditions (under rain-fed conditions; no pesticides and no fertilizer were applied; weeds were manually eliminated).
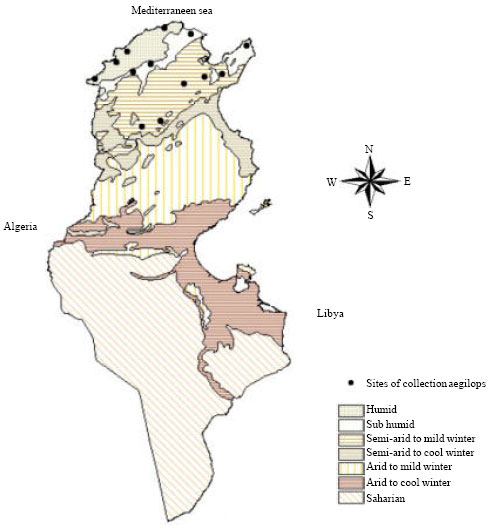 | |
| Fig. 1: | Distribution sites of Aegilops geniculata in Tunisia |
| Table 1: | Characteristics of the origin sites of Ae. geniculata accessions in Tunisia |
 | |
| Table 2: | Agro-morphological measured traits on Ae. geniculata |
 | |
Thirteen accessions were planted in completely randomized design with four replicates. Each replication consisted of a 10 plants row. Distance between plants was 70 cm. Rows were 80 cm apart. Heading was noticed 140 days after sowing and the plants were harvested at complete maturity (180 days after sowing). Quantitative characters were evaluated from leaves, ears and seeds from each plant. Morphological measurements of 19 traits were assigned in Table 2. Analysis of Principal Component (PCA), morphological distance clustering and phenologic RAPD markers tree were dealt.
RAPD analysis: The genomic DNAs were extracted from young leaves of Ae. geniculata accessions by the cetylmethylammoniumm bromide (CTAB) method with minor modification (Murry and Thompson, 1980). After purification, the DNA concentration was spectrophotometrically estimated. DNA integrity was assessed by 0.8% agarose gel electrophoresis (Sambrook et al., 1989). Twenty nanogram of the extracted genomic DNA was diluted and used for PCR amplifications. Some primers which generate variable amplification gave poor amplification products or non-repeatable banding patterns were discarded. Only nineteen primers purchased from Operon Technologies inc. (Alameda, USA) that showed numerous bands, were used for the amplification of random DNA sequences.
PCR reactions were performed, in a 25 μL volume reaction mixture containing between 20- 40 ng of total cellular DNA, 5 μL of 5x Taq DNA polymerase buffer, 0.5 μL dNTP (200 μM), 0.2 μ Taq DNA polymerase (5U μL-1), 1 μL de MgCl2 (2.5 mM) and 25 μM of primer. The reaction mix was overlaid with a drop of mineral water. PCRs were performed using a Biometra UNO II thermal-cycler and involved an initial denaturation step (94°C, 5 min), 40 amplification cycles (each 94°C, 30 sec; 38°C, 1 min and 72°C, 1 min) and a final extension step (72°C, 10 min). Amplification products were analysed by electrophoresis in 2% agarose gels in 1x TAE (Tris Acetate EDTA) buffer and visualized under UV light after Ethidium bromide staining (Sambrook et al., 1989). Amplification was performed and only reproducible products were taken into account for further data analysis.
Data analysis: Principal Component Analysis (PCA) was dealt and the genetic distances between the different accessions were calculated on the centred and standardized variates using measured data with MVSP 3.13 software (Kovach, 1993). To group the populations based on morphological similarity level, cluster analysis was conducted on the Euclidian distance matrix with linkage average method using SAS software. The relationship between the morphological distance matrix and the distances obtained with RAPD markers was analysed. The comparison between the two dendrograms was performed according to the approach developed by Mantel (1967) correlation tests using Mxcomp procedure from NTSYS program (Rohlf, 1993). The principle of this approach is to compare the observed Z-value or r-value with its permutational distribution according a null hypothesis, which is not difference between the distance matrix, Z = 0. In this comparison, 5000 random permutations were made. The null hypothesis of no correlation is rejected when Mentel statistic falls outside the 0.05 confidence level. Legendre and Legendre (1998), state that Mentels test is only reliable on datasets comprising more than four accessions.
RESULTS
RAPR markers: Analysis of the amplification patterns in Ae. geniculata showed a difference by position and number of generated fragments. A total of 212 DNA fragments were generated by 19 primers with an average of 11.15 fragments per primers and were scored as RAPD markers (Table 3). Of these amplified fragments, 153 were polymorphic (about 71.27%), with an average of 11.76 fragments per accession and 8.05 fragments per primers. For each primer, a considerable variation was present for the number of fragments produced (from 9 to 14) and the number of polymorphic fragments (from 3 to 14) that ranged in size from 0.5 to 3 kb. The number and sizes of the DNA fragments were strictly dependent upon primer sequence.
The number of DNA polymorphic fragments per accessions varied from 5.57 in Goussa to 7.26 in Djebel Oust (Table 4). Of the 13 studied accessions, Dj Oust, Tabarka and Ain Zana accession produced the maximum number of DNA polymorphic fragments. This level suggests an efficiency of tested primers. This result showed that the primers OPG02, OPG12, OPM12, OPA06, OPJ06, OPD18, OPG10, OPJ16 and OPA12 were more efficient to assess the genetic relationships, estimate genetic diversity and to explore the DNA polymorphism of studied genotypes.
Phylogenetic diagram was drowning using the Unweighted Pair Group Method with the Arithmetic Averaging (UPGMA) algorithm and referring to the similarity rate of 70 dendrogram obtained revealed three main clusters (Fig. 2). The first cluster A is formed by two sub-cluster. The first sub-cluster consisted of Dj Ressas, Ain Zana accessions, the second one is constituted by Bizerte, Dj Oust and Zaghouan accessions, their similarities percentage varied between 68.07 and 73.23%. The second cluster B is formed by two sub-clusters. The first sub-cluster is composed by Dj Serj and Sbeitla accessions, the second is constituted by Souk jemaa, Mekna, Goussa and Dj Abderhamen.
 | |
| Fig. 2: | Dendrogram constructed by UPGMA (weighted pair grouping of arithmetic means) and based on RAPD similarity values showing relationships among the Aegilops geniculata Roth |
| Table 3: | Nucleotide sequence of primers with the number of amplified products and percentages of polymorphic fragments in Ae. geniculata with respect to the total number of amplification fragments (212) are given |
 | |
| Table 4: | Number of DNA polymorphic fragments per accessions |
 | |
| Table 5: | PCA variable loadings |
 | |
The estimated similarity coefficients ranged from75.58 and 79.81%. A high similarity at the level of the DNA was showed between two combinations Mekna and Souk jemaa accessions with 82.16%. The third cluster C is formed by Nefza, Tabarka accessions showing a similarity of 73.70%. Ae. geniculata accessions exhibited a low level of intra-specific similarity that varied from 59.15 to 82.16%.
Morphology analysis: Based on eigen values of the order of 1.7 as was suggested by Tomassone et al. (1993), the PCA grouped variables into three components, which explained 83.98% of the total variation. The two first axes were considered as they elucidate the maximum simple variation (respectively 48.32 and 26.38% of the total variation) with the cumulative variation of 74.70%.
Loading variables and the PCA scores were also calculated (Table 5). Each principal component was interpreted by its correlation with the original variables. The PC1 accounted for 48.32% of the variation and showed the largest loading values with phenological, morphological and yield-related traits: Days to Germination (DG), days to the second leaf emergence(DL2T1), days to the first tiller (DT1), first tiller length (T1Le), spikelet number per spike (SpN/E), ear per plant (E/P), Plant height (PHt), ear length (ELe), seeds number per plant (SN/P), seeds weight per plant (SW/P), whereas, the PC2 accounted for 26.38% of the variation shared the largest loading values with phenological, morphological and yield-related traits: Number of leaves on the first tiller (NLT1), total number of tillers (NT), days to flowering (Dfl), days to 50% of heading (D50%H), days to full heading (DH), Seeds per ear (S/E). Considering the plot defined by the PC1 and PC2 and taking in account their projection on the third plan (PC3), most variables were correlated negatively with the first principal component (PC1) (p<0.01). A clear separation of Ae. geniculata accessions was observed and five main groups can be distinguished (Fig. 3).
The first group positively correlated to the two axes and gathered Ain Zana and Mekna accessions. They are originated from the sub humid area (mild and cool winter) at an altitude of 600 m. Moreover, Dj Abderhamen, Goussa, Tabarka and Dj Ressas accessions, are originated from humid and sub humid microclimate, formed the second group. This set is positively correlated to the PC 2 and negatively correlated to the PC 1. The third group is composed by Nefza accesions (from the sub humid area) and Dj Serj accessions (from the upper arid area). They are positively correlated to the PC 2 and negatively correlated to the PC1.
 | |
| Fig. 3: | Principal component analysis of Aegilops geniculata accessions |
 | |
| Fig. 4: | Dendrogram of Aegilops geniculata accessions clustered with average linkage method |
Bizerte and Zaghouan accessions are correlated negatively to the two axes and formed the fourth group. They are also belonging to the sub humid area. The fifth group is composed of Sbeitla, Souk jemaa and Dj Oust accessions which are negatively correlated to PC2 and positively correlated to PC1. They are collected from high altitudes (>400 m) of the upper semi arid with mild winter.
We used the Euclidian distance matrix with linkage average method to draw morphological distances. The dendrogram was constructed as indicated in Fig. 4. It shows three main Clusters (I, II and III) according to climatic regions. In fact, the first cluster contains the greatest number of accessions. It is composed by two sub-clusters (Tabarka, Dj Ressas, Goussa and Dj Abderhamen) accessions and (Bizerte, Zaghouan and Nefza) accessions originated from humid and sub humid microclimate. The average distance between accessions of the first sub-cluster varies between 0.10 and 0.16; but that of the second sub-cluster was ranged between 0.14 and 0.23. Cluster II is constituted by five accessions. Mekna and Ain Zana accessions originated from the sub humid area (mild and cool winter) at an altitude of 600 m, formed a sub-cluster. They are grouped at the distance of 0.15. Dj Serj, Souk jemaa and Dj Oust accessions joined the sub-cluster respectively at the distance of 0.29; 0.36; 0.66. They are collected from high altitudes (>400 m) of the upper semi arid with mild winter. Finally, cluster III represented by Sbeitla accession originated from the upper arid area and growing on an altitude of 670 m, is distinguished by a distance of 0.93.
Despite that the PCA of accessions showed five groups and the dendrogram clustering gave three groups, the most accessions gathered in the same group by PCA are also assembled in the same cluster. In fact, Ain Zana and Mekna accessions belong to the same group according to the two methods. The same remark is given for Zaghouan and Bizerte accessions. Also, we remark that Souk Jemaa and Dj Oust accessions are included in the same group. The 2 methods also showed Dj Abderhamen, Goussa, Tabarka and Dj Ressas accessions are associated in the same group.
Comparison between RAPD and morphology: To provide an objective comparison matrices, generated from RAPD and morphological data, were compared using Mentel test. Not significant and quite low correlation between the dendrograms was obtained (r = -0.268, p = 0.0198) with MxComp procedure from NTSYS programs. In fact, calculated distances between accessions by both methods are different.
DISCUSSION
The estimation of genetic similarities between genotypes gives useful information to address breeding program and germoplasm resource management (Roldan-Ruiz et al., 2001). In this study, morphological data analyses of 13 accessions of Ae. geniculata were coupled to molecular analysis (RAPD) to investigate the genetic diversity of Ae. geniculata. There has been an interest in differentiating between these accessions and there was low and non significant correlation between RAPD and morphological data.
Agro-morphological diversity among the Aegilops populations is further substantiated by principal component analysis, which indicated that the total variation was fairly distributed across all traits. Information obtained throughout principal component analysis may assist plant breeders to identify the number of highly differentiated population for use in crossing and selection programs (Louati-Namouchi et al., 2000). The PCA of agro-morphological traits classify populations according to climate regions. Several authors have shown that the geographic origin of the collected materiel was sufficient to obtain a reasonable grouping structure (Julier et al., 1995).
The first group is constructed by Ain Zana and Mekna accessions and originated from the sub humid area with mild and cool winter and located at an altitude of 600 m. They are defined by a late heading and flowering (an average of 180 days), a late germination, a weak kernel yield and high biomass production. Jaradat and Humeid (1990) also observed that genotypes from cooler sites and located at high elevations (900 m altitude) were characterized by late heading and longer filling periods. Moreover, Dj Abderhamen, Goussa, Tabarka and Dj Ressas accessions, formed the second group, originated from humid and sub humid microclimate. Tabarka accession collected from humid microclimate high land providing a sufficient argument for its belonging to this group, The presence in this second environmental pool of the accession Dj Ressas collected from upper semi arid climatic suggested that this accession is situated in the limit of the sub humid area with an annual rainfall of 453 mm. the last group is characterized by early germination, high grain yield and biomass production. Seed yield as well as biomass should be considered when evaluating wild accessions. So, plants of Dj Abderhamen, Goussa, Tabarka and Dj Ressas, exhibited high kernel yield (an average of 660 seeds per plant). In this context, Zaharieva et al. (2001) reported an average seed number of 1400 in Ae. geniculata plants grown under Mediterranean conditions. She concludes that Aegilops plants produce a considerably greater number of spikes and seeds than wheat. The third group is composed by two accessions (Nefza from the sub humid area and Dj Serj belonging to the upper arid area). In fact, these accessions were found in the same group because they belong to regions with rainfall >400 mm. They exhibited early germination, high kernel yield, late heading and flowering, high biomass production.
Bizerte and Zaghouan accessions formed the fourth group. They are also belonging to the sub humid area, characterized by weak biomass production and high kernel yield. They exhibited early germination, heading and flowering (flowering after 160 days). Van Slageren (1994) reported that the flowering time of Aegilops in Europe is from April-May until June-July, depending on the species and their ecogeographical location. This trait enables wild species to escape environmental stress during flowering and ensure seed production. Bizerte, Zaghouan and Dj Abderhamen, Goussa, Tabarka and Dj Ressas genotypes exhibited high plant height (PHt), high number of leaves on the first tiller (NLT1) and high Seed length (SLe). The last character could be useful in selecting populations with high seedling viability as seed size is directly correlated with the vigour of the seedling (Bullita et al., 1994).
The fifth group is composed of Sbeitla, Souk jemaa and Dj Oust accessions, collected from upper semis arid with mild winter and high altitudes (>400 m). They are defined by late germination, early heading and flowering and weak kernel yield and biomass production. These populations could be selected for their earliness. Dib Ali et al. (1992) reported that in Mediterranean conditions, early heading could represent an important trait favouring plant survival and reproduction under drought and heat stress in the end of the life cycle on seeds per ear (S/E). This result was also mentioned by Chibani (1991) on barley (Hordeum vulgare L.). Zaharieva et al. (2003) noticed that earliness was the trait with highest contribution of the inter-population variation to the total variation. In fact, elongation and development events are the most sensitive to climatic factors variation (Regan et al., 1992) and strong effect of climatic factors on development rate was noted in several crops (Whan et al., 1991). Concerning the variability of wild Jordanian emmer, Jaradat and Humeid (1990) found that accessions from a dry location are characterized by their high number of spikelets and high productive tilling capacity value. These accessions might harbour genes for drought tolerance and possibility to higher photosynthetic ability. In addition, the restricted geographical area of accessions, with a slight climatic difference between the sub humid and the semi arid area, could explain the proximity of most accessions. Furthermore, accessions originating from sub humid area have higher vigour compared to those originating from dry environment.
The use of RAPD for identification of cultivars through DNA profiling is the current method of choice in measuring genetic variation within germplasm collections (Hernendez et al., 1999). Consequently, the performance of RAPD markers was evaluated using various parameters such as percentage of polymorphism and clusters formed in the dendrogram. In this study, the high level of polymorphism (71.27%) observed in Ae. geniculata accessions was obtained by Tao et al. (1993) in Sorghum bicolour (L.) Moench. Moreover, this result was also reported by Zaharieva et al. (2001). The high level of polymorphism was probably due to the large number of primer used in this experiment. Guadagnuolo et al. (2001) affirmed that RAPD amplifications provided a largest set of polymorphic markers. Also, the UPGMA dendrogram for RAPD data showed that the structuration group is not depending on the geographical origin. This result is not in agreement with that found using PCA accession loading and the dendrogram of morphological traits. In this study, representative dendrograms for the accessions based on RAPD markers and morphological traits showed that the overall correspondence between the similarity matrices is low and the correlation between these two dendrograms is not significant (r = -0.268). This result is in agreement with those of Roldan-Ruiz et al. (2001) working with 16 ryegrass varieties and reporting very low correlation (r = -0.06) between AFLP and morphological characters. Similar result was found by Campos et al. (2005) in 63 Mandarin (Citrus sp.) cultivars, noticing a non significant correlation (r = 0.31) between morphological and molecular data. Moreover, our result corroborated with several studies such as European barley varieties (Schut et al., 1997), synthetic hexaploid wheats and their parents (Lage et al., 2003) and Squash germplasm (Ferriol et al., 2004). Two reasons have been mentioned by Semagn (2002) for this low relationship, molecular markers cover a larger proportion of the genome, including coding and noncoding regions, that the morphology and molecular markers are not subjected to artificial selection compared to morphology. For these reasons, RAPD and phenotypic data approaches will not necessarily yield closely matching results. The correlation between them could be improved if there was more morphological markers analyzed or more primer combinations of RAPD were used.
PCA and dendrogram analysis of both morphological traits and RAPD markers showed an important genetic diversity of Ae. geniculata accessions. In fact, they were distributed in different groups belonging to different bioclimatic location and on some genetic characteristics as earliness and high kernel yield.
CONCLUSION
Any one of these methods could be used to study diversity and group genotypes, but none would be fully interchangeable in use. The choice of genetic diversity estimate will depend largely upon the tools available to the researcher and how they fit into the breeding scheme. Therefore, phenotypic traits are relatively less reliable and inefficient for precise discrimination of closely related genotypes and analysis of their genetic similarities. However, phenotypic traits, are useful for preliminary, fast, simple and inexpensive varietals identification and can be used as a general approach for assessing genetic diversity among phenotipically distinguishable cultivars, although they are inefficient on account of the time and cost involved (Martinez et al., 2005). The utility of combining genetic (RAPD) and morphologic characteristics reveals combinations of variation among the Ae. geniculata accessions that would not be apparent with any single measurement and could provide a more complete understanding of the germplasm collections diversity.
REFERENCES
- Bai, G., P. Guo and F.L. Kolb, 2003. Genetic relationships among head blight resistant cultivars of wheat assessed on the basis of molecular markers. Crop Sci., 43: 498-507.
Direct Link - Bullita, S., R. Floris, M.D. Hayward, A. Loi, C. Porqueddu and F. Veronesi, 1994. Morphological and biochemical variation in Sardinian populations of Medicago polymorpha L. suitable for rainfed Mediterranean conditions. Euphytica, 77: 263-268.
CrossRefDirect Link - Campos, E.T., M.A.G. Spinosa, M.L. Warburton, A.S. Varella and A.V. Monter, 2005. Characterization of Mandarin using Morphological and AFLP Marker. Vol. 30, Interclencia, Venzuela, pp: 687-693.
Direct Link - Chalmers, J.K., A.W. Campbell, J. Krestschmer, A. Karakousis and P.H. Henschke et al., 2001. Construction of three linkage maps in bread wheat, Triticum aestivum L. Aust. J. Agric. Res., 52: 1089-1119.
CrossRefDirect Link - Chan, K.F. and M. Sun, 1997. Genetic diversity and relationships detected by isozyme and RAPD analysis of crop and wild species of Amaranthus. Theor. Applied Genet., 95: 865-873.
Direct Link - Ferriol, M., B. Pic�, C.P. de Fernandez and F. Nuez, 2004. Molecular diversity of germplasm collection of squash (Cucurbita moschata) determined by SRAP and AFLP markers. Crop Sci., 44: 653-664.
Direct Link - Guadagnuolo, R., D.S. Bianch and F. Felder, 2001. Specific genetic markers for wheat, spelt and four wild relatives: Comparison of isozymes, RAPDs and wheat microsatellites. Genome, 44: 610-621.
Direct Link - Hernendez, P., A. Martin and G. Dorado, 1999. Development of SCARs by direct sequencing of RAPD products: A practical tool for the introgression and marker assisted selection of wheat. Mol. Breed., 5: 245-253.
Direct Link - Louati-Namouchi, I., M. Louati and A. Chriki, 2000. A quantitative study of some agronomic characters in Sulla (Hedysarum coronarium L.). Agronomie, 20: 223-231.
Direct Link - Lage, J., M.L. Warburton, J. Crossa, B. Skovmand and S.B. Andersen, 2003. Assessment of genetic diversity in synthetic hexaploid wheats and their Triticum dicoccon and Aegilops tauschii parents using AFLPs and agronomic traits. Euphtytica, 134: 305-317.
CrossRef - Martinez, L., P. Cavagnaro and R. Masuelli, 2005. Evaluation of diversity among argentine grapevine (Vitis vinifera L.) varieties using morphological data and AFLP markers. Elect. J. Biotechnol., 6: 37-45.
Direct Link - Mantel, N., 1967. The detection of disease clustering and a generalized regression approach. Cancer Res., 27: 209-220.
Direct Link - Murray, M.G. and W.F. Thompson, 1980. Rapid isolation of high molecular weight plant DNA. Nucl. Acids Res., 8: 4321-4326.
CrossRefPubMedDirect Link - Najimi, B., S. El Jaafari, M. Jlib�ne and J.M. Jacquemin, 2003. Applications des marqueurs moleculaires dans l`amelioration du ble tendre pour la resistance aux maladies et aux insectes. Biotechnol. Agron. Soc. Environ., 7: 17-35.
Direct Link - Regan, K.L., K.H.M. Siddique, N.C. Turner and B.R. Whan, 1992. Potential for increasing early vigour and total biomass in spring wheat. II. Characteristics associated with early vigour. Aust. J. Agric. Res., 43: 541-553.
Direct Link - Rohlf, F.J., 1993. NTSYS-pc: Numerical Taxonomy and Multivariate Analysis System. Version 2.20, Exeter Software, New York, ISBN: 0-925031-30-5, pp: 1-38.
Direct Link - Roldan-Ruiz, I., F.A. van Eeuwijk, T.J. Gilliland, P. Dubreuil and C. Dillmann et al., 2001. A comparative study of molecular and morphological methods of describing relationships between perennial ryegrass (Lolium perenne L.) varieties. Theor. Applied Genet., 103: 1138-1150.
CrossRefDirect Link - Schut, J.W., X. Qi and P. Stam, 1997. Association between relationship measures based on AFLP markers pedigree data and morphological traits in barley. Theor. Applied Genet., 95: 1161-1168.
CrossRefDirect Link - Semagn, K., 2002. Genetic relationships among ten endod types as revealed by a combination of morphological RAPR and AFLP markers. Hereditas, 137: 149-156.
Direct Link - Sneller, C.H., J.W. Miles and J.M. Hoyt, 1997. Agronomic performance of soybean plant introductions and their genetic similarity to elite lines. Crop Sci., 37: 1595-1600.
CrossRef - Sun, G., M. Bond, H. Nass, R. Martin and Z. Dong, 2003. RAPD polymorphisms in spring wheat cultivars and lines with different level of Fusarium resistance. Theor. Applied Genet., 106: 1059-1067.
CrossRefDirect Link - Sun, G.L., O. Diaz, B. Salomon and R. Von Bothmer, 1999. Genetic diversity in Elymus caninus as revealed by isozyme, RAPD and microsatellite markers. Genome, 42: 420-431.
CrossRefDirect Link - Tao, Y., M.M. Manners, M.M. Ludlow and R.F. Henzell, 1993. DNA polymorphisms in grain sorghum (Sorghum bicolor (L.) Moench). Theor. Applied Genet., 86: 679-688.
CrossRefDirect Link - Whan, B.R., W.K. Anderson, R.F. Gilmour, K.L. Regan and N.C. Turner, 1991. A Role For Physiology in Breeding for Improved Wheat Yield Under Drought Stress. In: Physiology Breeding of Winter Cereals for Stressed Mediterranean Environments, Acevedo, E., A.P. Conesa, P. Monneveux and J.P. Srivastava (Eds.). I.N.R.A, les Colloques, Montpellier, France, pp: 179-191.
- Wang, Z.N., A. Hang, J. Hansen, C. Burton, C.A. Mallory-Smith and R.S. Zemetra, 2000. Visualization of A- and B-genome chromosomes in wheat (Triticum aestivum L.) x jointed goatgrass (Aegilops cylindrical Host) backcross progenies. Genome, 43: 1038-1044.
Direct Link - Zaharieva, M., A. Dimov, P. Stankova, J. David and P. Monneveux, 2003. Morphological diversity and potential interest for wheat improvement of three Aegilops L. species from Bulgaria. Genet. Resour. Crop Evol., 50: 507-517.
CrossRefDirect Link - Zaharieva, M., E. Gaulin, M. Havaux, E. Acevedo and P. Monneveux, 2001. Drought and heat responses in the wild wheat relative Aegilops geniculata Roth: Potential interest for wheat improvement. Crop Sci., 41: 1321-1329.
Direct Link