
Mushari A. Al-Naeem
Department of Environmental and Natural AgriculturalResources,
Collage of Agriculture and Food Sciences, King Faisal University,
Hofuf Al-Ahsa, Kingdom of Saudi Arabia
Pakistan Journal of Biological Sciences
Year: 2008 | Volume: 11 | Issue: 1 | Page No.: 68-73


ABSTRACT
Laboratory experiments were conducted at the Agricultural and Veterinary Training and Research Station, King Faisal University, Al-Hassa, Kingdom of Saudi Arabia to study the effect of pulse irrigation from a line source on sandy soil uniformly packed in soil tank using high flow rates. It was found that the increase in pulsed flows up to six times to that of the equivalent continuous flow can be used with little change to the soil wetting pattern. The water deep percolation reduced and horizontal spread increased with an increase in the pulsed flow up to twelve times to that of continuous flow (control treatment). A strong correlation was obtained between the water application rates and the vertical and horizontal advances which could be expressed as power function. The results showed an excellent potential to increase the emitter sizes up to 2.4-3.5 times and the emitter cross section area up to 6.0-12.0 times than the normal size for reducing the trickle clogging problem. Empirical analysis of the vertical and horizontal advance shows that both of these parameters can be expressed as a power function.
PDF Abstract XML References Citation
How to cite this article
Mushari A. Al-Naeem, 2008. Use of Pulse Trickles to Reduce Clogging Problems in Trickle Irrigation System in Saudi Arabia. Pakistan Journal of Biological Sciences, 11: 68-73.
DOI: 10.3923/pjbs.2008.68.73
URL: https://scialert.net/abstract/?doi=pjbs.2008.68.73
DOI: 10.3923/pjbs.2008.68.73
URL: https://scialert.net/abstract/?doi=pjbs.2008.68.73
INTRODUCTION
Saudi Arabia is an arid country where summer air-temperature often exceeds 45°C. Improved irrigation systems such as sprinkler, drip (surface or sub-surface) and the trickles face clogging problem mainly due to salt accumulation resulting from water evaporation in and around the water supply points. The terms drip, trickle and spray irrigation, have been supplanted by the term micro irrigation, by the American Society of Agricultural Engineers. Micro irrigation includes all methods of frequent water application, in small flow rates, on or below the soil surface. Ideally, the volume of water is applied directly to the root zone through small outlets (emitters) in quantities that approach the consumptive use of plants for optimal production. During the dry season in humid areas, or in arid climates, micro irrigation significantly affected the quality and quantity of yield, pest control and harvest timing. Also, limited soil wetting permits orchard cultural operations and minimized the labour scheduling problems (Nakayama and Bucks, 1986).
Normally water infiltration takes place in the region directly around the emitter, which is small compared with the total soil volume of the irrigated field. Previous studies on water infiltration into soils under a point-source dealt mainly with the soil moisture content or wetting front advance pattern during or just after the termination of the irrigation process following a continuous irrigation (Warrick, 1974; Oron, 1981; Mostaghimi et al., 1982; Wu et al., 1999; Elmaloglou and Malamos, 2006). On the other hand, many studies developed techniques to describe continuous trickle irrigation, whereas only few studies focused on the pulse trickle irrigation. Levin et al. (1979) and Mostaghimi et al. (1981), studied the effect of discharge rate and intermittent water application by a surface point-source. Revol et al. (1996) observed free water pond formation under a trickle irrigation. Revol et al. (1996) and Cote et al. (2003) investigated the effect of intermittent water application on the wetting front advance in subsurface trickle irrigation. They concluded that advance in wetting front is significantly affected by the total amount of water applied.
The distribution pattern of soil water resulting from trickle irrigation is quite different from those resulting from the conventional modes of irrigation. It was observed that If many emitters are close together on a line, the result is an effective line or strip source and the pattern of wetting will be two dimensional (horizontal in the direction perpendicular to the source and vertical) rather than three dimensional (Hillel, 1982).
Numerical solutions were developed to analyze multidirectional infiltration under trickle sources (Bresler et al., 1971; Brandt et al., 1971; Levin et al., 1979; Ragab et al., 1984; Taghavi et al., 1984; Svehlic and Ghali, 1984; Ghali and Svehlik, 1988; Lafolie et al., 1989). Bresler et al. (1971) and Elmaloglou and Malamos (1999) studied soil water movement and distribution in homogenous soil profiles under various rates of water application from a surface trickle line source. They found that for shallow rooted and widely spaced row crops, higher water application rates are advisable, while for deep rooted and closely row crops, lower application rates are recommended. Also, Elmaloglou and Malamos (2003) analyzed the local infiltration from a surface line source of trickle irrigation in two homogeneous and unsaturated soils, using three wetting rates in each soil. They concluded that the empirical model was successful and proved as a useful tool for predicting the depth of the wetting front throughout the soil profile under a surface line source of trickle irrigation.
The discharge of emitter was calculated by Roberson and Crowe (1993) as follow:
| Where: | ||
| Q | = | Discharge through orifice (m3 sec-1), |
| Ao | = | Area of cross-section of the orifice (m2), |
| g | = | Acceleration due to gravity, 9.81 (m sec-2), |
| h | = | Depth of water over the centre of the orifice (on the upstream side) in case of free flow orifice, or the difference in elevation between the water surface at the upstream and downstream faces of the orifice plate in case of submerged orifices (m). |
The principles of pulsing were first set out by Karmelli and Peri (1974). They described a pulse as consisting of an operating phase (to), during which water is applied to the soil at a discharge (Qp) and a resting phase (tr) when the flow is zero. The average pulsed discharge (Qa) over the irrigation period (to+tr) would be:
The average pulsed discharge (Qa) is equivalent to a continuous discharge (Qc). Thus the same amount of water would be applied with a continuous discharge (Qc) as in the pulsed regime provided the irrigation period was (to+tr).
Several investigations demonstrated the effect of pulsing flow compared with continuous applications.
Mostaghimi and Mitchell (1983) showed that pulsing significantly reduced the water losses from deep percolation in sandy soils and increased the lateral spread of water in the soil. Levin and Van Rooyen (1977) and Levin et al. (1979) also reported similar advantages in reducing percolation losses but also showed that wetting patterns for pulsed and continuous flow applications were almost identical at very low discharges for point sources.
Among the various problems associated with the trickle irrigation, Emitter clogging is considered as the most serious problem in trickle irrigation. The emission uniformity reduces greatly when this happens and the crop damage may occur before the clogging is detected.
Obviously, the effect of pulsing depends not only on the soil type but also on the discharge and operating and resting times chosen. This study discusses the results of a laboratory study to show that pulsing discharges, within the range of most commercial trickle systems, can produce similar wetting patterns as compared to those of low continuous discharges. Also to find out the possibility for increasing the emitter sizes in order to minimize the tendency of emitter clogging under arid environment.
MATERIALS AND METHODS
The experiments were conducted at the Agricultural Engineering Laboratories of Agricultural and Veterinary Training and Research Station, King Faisal University, Al-Hassa, Kingdom of Saudi Arabia during 2005-2006. The soils of the research station are mostly coarse textured (sandy soils). The physical and chemical properties of soil used can be shown in Table 1.
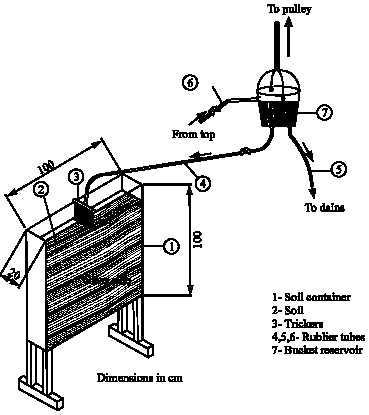
The experimental apparatus consisted of a soil container and a water application system. The frame of the soil container was made of aluminum with overall dimensions of 1x1x0.2 m length, depth and width, respectively. The soil profile was designed in such a way that its thickness, which coincides with the y-axis, was smaller than its length and depth whose directions were along the x-axis and z-axis, respectively. To observe and
| Table 1: | Physical and chemical properties of soil |
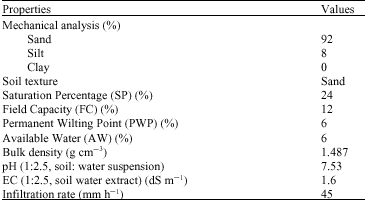 | |
record the advance of the wetting front, the front face of the container was constructed with a 20 mm thick glass plate supported by an aluminum frame while the back face was made of fiber plate. The soil water contents were sampled through 25 mm diameter holes drilled on a grid layout on the fiber plate panel to the rear. These holes were plugged with rubber bungs during the course of the experiment and could be removed when soil samples were taken. The remaining two sides forming the thickness of the container and the bottom side were made of hard fiber sheets firmly fixed to the frame to prevent water leakage. A 2 cm grid system was drawn on the outer side of the glass plate using a waterproof felt pen for plotting the wetting fronts easily and accurately.
The water application system consisted of a water supply reservoir and the drippers. The water supply reservoir was a bucket of 20 L capacity and connected to the drippers by means of rubber tubing. The emitter used is 125 mm PVC pipe in which 19 needles were fixed 10 mm apart and placed centrally across the soil tank to simulate a line source that would be used to irrigate a row crop. By using a line source, water movement along the y-axis was minimized so that the lateral and vertical movement of water along the x-axis and z-axis, respectively could be easily monitored. The water was supplied to the reservoir from a water supply tap by means of a rubber tubing connection. The discharge of the emitters from the reservoir was controlled by adjusting the height of the bucket above the soil sample container by means of a pulley system and using a valve. Uniform discharge was attained by means of an overflow siphon (Fig. 1).
Before each test, the soil was air-dried, mixed thoroughly to obtain a homogeneous mixture, then placed in the tank and compacted to a constant bulk density.
Four pulse application regimes were selected within the range of most commercially available trickle equipment for comparison with a continuous flow of 8 L min-1 h-1. The flow rates used were as follows:
| • | 1.33 cm3 min-1 cm-1 applied continuously (equivalent to 8 L min-1 h-1). |
| • | 2.66 cm3 min-1 cm-1 applied as 30 min on, 30 min off pulse (equivalent to 16 L min-1 h-1). |
| • | 4 cm3 min-1 cm-1 applied as 20 min on, 40 min off pulse (equivalent to 24 L min-1 h-1). |
| • | 8 cm3 min-1 cm-1 applied as 10 min on, 50 min off pulse equivalent to 48 L min-1 h-1). |
| • | 16 cm3 min-1 cm-1 applied as 5 min on, 55 min off pulse equivalent to 96 L min-1 h-1). |
The total quantity of water applied came to 12.8 L in each case which is equivalent to water application of
64 L min-1 run along a trickle lateral. The total running time for all the water applications came to 8 h. The soil wetting patterns were observed at regular time intervals. During each test, soil samples were taken at the end of each irrigation to determine soil moisture contents. Asymmetrical water distribution was assumed in the whole soil profile.
RESULTS AND DISCUSSION
The data in Fig. 2 and 3 show that the shape of the wetted soil zone was significantly affected by the discharge rate of different treatments. An increase in the water application rate from control (8 L min-1 h-1) to 16, 24 and 48 L min-1 h-1 resulted in 9.1, 14.5 and 19.1% increase in vertical advance and 4.1, 8.3 and 12.5% decrease in the horizontal advance, respectively as compared to the control (continuous) treatment. This would mean that pulsed discharges up to six times the equivalent continuous discharge caused only minor changes in the soil wetting zone (wetting front) both vertically and horizontally. On the other hand, increasing the water application rate to 96 L min-1 h-1 caused 63.6% increase in the vertical advance and 40% decrease in the horizontal advance when compared with the continuous treatment. This suggests that as the level of pulsed flow increased up to twelve times the continuous flow, it reduced the
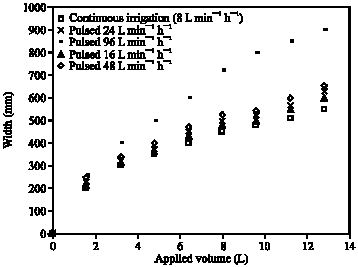 | |
| Fig. 2: | Horizontal advance of the wetting front from a trickle line source |
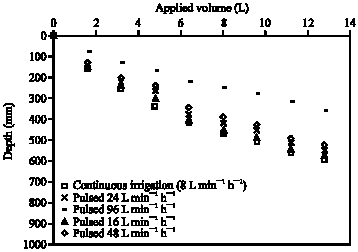 | |
| Fig. 3: | Vertical advance of the wetting front from a trickle line source |
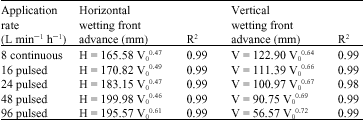
deep percolation and increased the horizontal spread. These findings support the work of Mostaghimi and Michell (1983), who reported that an increase in pulsed flow caused significant reduction in deep percolation and appreciable increase in horizontal spread. The ratios between the maximum width and the maximum depth of the wetted profiles were 0.92, 1.04, 1.15, 1.25 and 2.5 for 8, 16, 24, 48 and 96 L min-1 h-1 discharge rates, respectively. Mathematical analysis of the vertical and horizontal advance show that these can be expressed as a power function.
V = a V0c
H = b V0d
| Where: | ||
| V | = | Vertical advance (mm), |
| H | = | Horizontal advance (mm), |
| a, b, c and d | = | Constants, |
| Vo | = | Product of the discharge, L min-1 h-1 and time in min. |
A strong correlation was found between the total water applied and the vertical and horizontal advances at different water application rates (Table 2) and can be expressed by power function.
A major factor limiting the use of high pulsed discharges is the surface water ponding. Once this exceeds the initial infiltration capacity of the soil, the surface ponding spreads rapidly. At low discharges, surface ponding extended only 50 mm for the continuous flow and 305, 493 and 503 mm for the pulsed discharges of 16, 24 and 48 L min-1 h-1, respectively. Although at a discharge rate of 96 L min-1 h-1, the flow pulses lasted only for five minutes but the horizontal infiltration continued at the same rate for several minutes after the water supply was switched off. All this process could be subjected to ponding which acted as a reservoir on the soil surface. This may not only change the wetting pattern significantly but may also result in run-off losses and soil erosion. The results agree with findings of Mostaghami and Mitchell (1983) and Levin et al. (1979), who concluded that pulsing water discharge could significantly reduce deep percolation water losses in sandy soils and increase the lateral spread of water in soils.
Soil water contents measured across the wetted soil zone at a depth of 150 mm (Fig. 4) indicate that as the flow rates increased under a pulsed regime, the volume of wetted soil increased for the same volume of applied water. The results are in agreement with the findings of Elmaloglou and Malamos (1999), who found that for shallow rooted and widely spaced row crops, higher water application rates are advisable, while for deep rooted and closely spaced crops, lower water application rated are recommended. In conclusion, pulsing water discharge produced favorable soil moisture regime by maintaining higher soil water contents than the continuous flow in the active crop root zone area.
The results show that there is a good possibility to maintain and establish optimal wetting patterns in soils under trickle irrigation using pulsed discharges which are significantly higher as compared to the equivalent continuous flow. This could lead to the use of large emitter sizes thus reducing the emitter clogging problems and the soil water filtration. The data also indicate that the emitter sizes could be increased up to 2.4-3.5 times and the emitter cross section areas up to 6-12 times which would reduce the clogging tendency of emitters.
Although pulsing discharges might reduce emitter clogging but it may increase the cost of the system as
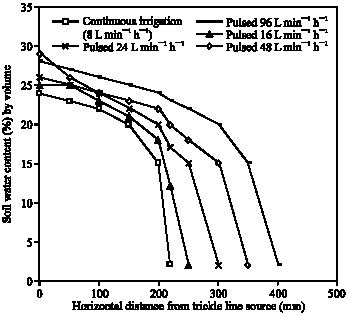 | |
| Fig. 4: | Soil water content with horizontal distance from trickle line source |
| Table 2: | The empirical equations describing the vertical and horizontal wetting front advance under different applications as a function of water applied |
 | |
large lateral pipes will be required to supply the large flows and automatic sequencing valves might be needed to pulse the flows. Moreover, this cost could be offset by reduction in maintenance and cleaning or replacing emitters. The costs of pumping should not be affected provided the pulsed discharge (Qp) is similar to that required in a continuous flow system (Qc). However, this can be achieved by careful selection of the number of trickle laterals required for efficient operation during each pulse.
CONCLUSIONS
The use of pulsed water supply reduced the vertical wetting front in soils thus reducing the deep water percolation losses in coarse textured soils. On hourly cycle basis, a pulsed flow rate up to six times the continuous flow rate did not significantly change the shape of the wetting bulb. From design point of view, water discharge rates between 48 and 96 L min-1 h-1 could be used and this will allow the use of large emitter sizes, reduce emitter clogging problems and appreciably reduce soil filtration. A strong correlation was obtained between the water application rates and the vertical and horizontal advances which could be expressed as power function. Pulsing the water supply wetted the soil more uniformly and produced more favorable moisture regime than continuous supply. The significance of surface ponding width in increasing the wetting bulb was noticed particularly in the 96 L min-1 h-1. The increase in the high pulse rate than the soil infiltration capacity caused rapid increase (spread) in the surface ponding thus showing a major factor limiting the use of high pulsing rates in trickle irrigation.
ACKNOWLEDGMENT
The author thanks the SABIC for financial support in carrying out this study and to procure necessary equipments for this research.
REFERENCES
- Brandt, A., E. BresIer, N. Diner, J. Ben-Asher, J. Heller and D. Goldberg, 1971. Infiltration from a trickle source: I. Mathematical models. Soil Sci. Soc. Am. Proc., 35: 675-682.
Direct Link - BresIer, E., J. Heller, N. Diner, J. Ben-Asher, A. Brandt and D. Goldberg, 1971. Infiltration from a trickle source: II. Experimental data and theoretical predictions. Soil Sci. Soc. Am. Proc., 35: 683-689.
Direct Link - Cote, C.M., K.L. Bristow, P.B. Charlesworth, F.J. Cook and P.J. Thorburn, 2003. Analysis of soil wetting and solute transport in subsurface trickle irrigation. J. Irrig. Sci., 22: 143-156.
CrossRefDirect Link - Elmaloglou, S. and N. Malamos, 1999. Analysis of soil-water movement under a trickle surface line source for irrigation design purposes. ICID J., 48: 53-60.
Direct Link - Elmaloglou, S. and N. Malamos, 2003. A method to estimate soil-water movement under a trickle surface line source, with water extraction by rootst. Irrig. Drain., 52: 273-284.
Direct Link - Elmaloglou, S. and N. Malamos, 2006. A methodology for determining the surface and vertical components of the wetting front under a surface point source, with root water-uptake and evaporation. J. Irrig. Drain., 55: 99-111.
Direct Link - Ghali, G.S. and Z.J. Svehlik, 1988. Soil-water dynamics and optimum operating regime in trickle irrigated fields. Agric. Water Manage., 13: 127-143.
CrossRef - Karmelli, D. and G. Peri, 1974. Basic principles of pulse irrigation American society of civil engineers. Proc. Irrig. Drain. Div. J., 100: 309-319.
Direct Link - Lafolie, F., R. Guennelon and M. Th. van Genuchten, 1989. Analysis of water flow under trickle irrigation: 1. Theory and numerical solution. Soil Sci. Soc. Am. Proc., 53: 1310-1318.
Direct Link - Levin, I. and F.C. van Rooyen, 1977. Soil water flow and distribution in horizontal and vertical directions as influenced by intermittent water application. Soil Sci., 124: 355-365.
Direct Link - Levin, I., P.C. van Rooyen and F.C. van Rooyen, 1979. The effect of discharge rate and intermittent water applications by point source irrigation on the soil water distribution pattern. Soil Soc. Am. J., 43: 8-16.
Direct Link - Mostaghimi, S., J.K. Mitchell and W.D. Lembke, 1982. Effect of discharge rate on distribution of moisture in heavy soil irrigated from trickle source. Trans. ASAE, 25: 975-980.
Direct Link - Mostaghimi, S. and J.K. Mitchell, 1983. Pulsed trickling effects on soil moisture distribution. Water Resour. Bull., 19: 605-612.
Direct Link - Nakayama, F.S. and D.A. Bucks, 1986. Trickle Irrigation for Crop Production. 1st Edn., Elsvier Science Publisher, Amesterdam, Netherland, ISBN-13: 978-0-444-42615-4.
Direct Link - Oron, G., 1981. Simulation of water flow in the soil under sub-surface trickle irrigation with water uptake by roots. Agric. Water Manage., 3: 179-193.
Direct Link - Ragab, R., J. Feyen and D. Hillel, 1984. Simulating infiltration in sand from a trickle line source using the matric flux potential concept. Soil Sci., 137: 120-127.
Direct Link - Revol, P., B.E. Clothier, P. Kosuth and G. Vachaud, 1996. The free water pond under a trickle source: A field test of existing theories. Irrig. Sci., 16: 169-173.
CrossRef - Taghavi, S.A., M.A. Marino and D.E. Rolsion, 1984. Infiltration from a trickle irrigation source. J. Irrig. Drain. Eng. Am. Soc. Civil Eng., 110: 331-341.
Direct Link - Warrick, A.W., 1974. Time dependent linearized infiltration 1. Point sources. Soil Sci. Soc. Am. Proc., 38: 383-387.
Direct Link - Wu, J., R. Zhanh and S. Gui, 1999. Modeling soil water movement with water uptake by roots. Plant Soil, 215: 7-17.
Direct Link