
Navid Ghavi Hossein-Zadeh
Department of Animal Science, Faculty of Agriculture, University of Tehran, Karaj, Iran
Ardeshir Nejati-Javaremi
Department of Animal Science, Faculty of Agriculture, University of Tehran, Karaj, Iran
Seyed Reza Miraei-Ashtiani
Department of Animal Science, Faculty of Agriculture, University of Tehran, Karaj, Iran
Hassan Mehrabani-Yeganeh
Department of Animal Science, Faculty of Agriculture, University of Tehran, Karaj, Iran
Pakistan Journal of Biological Sciences
Year: 2007 | Volume: 10 | Issue: 1 | Page No.: 145-147


ABSTRACT
In this research we used stochastic method to simulate litter size data under assumption that the phenotype of the trait of interest is categorically distributed with a liability of normally distributed background effect. For the phenotypic categorical measurements, normal distribution of liability was assumed. Analysis was conducted by DFREML for phenotypic categorical data set. In the simulation process, we applied different true background heritabilities in combination with different threshold points. The points with the lowest heritability had the lowest variation in estimated heritability and those with the highest heritability had the highest variation. Results clearly show that by moving threshold points from the population mean towards the two tails of the distribution and also by increasing the true heritability, the differences between estimated heritability and true heritability increases. The linear model has always underestimated true heritabilities. It is possible to use our estimates to obtain a confidence range for true heritability when we have information about approximate location of threshold and estimates of heritability obtained by linear model.
PDF Abstract XML References Citation
How to cite this article
Navid Ghavi Hossein-Zadeh, Ardeshir Nejati-Javaremi, Seyed Reza Miraei-Ashtiani and Hassan Mehrabani-Yeganeh, 2007. Effect of the Threshold Nature of Traits on Heritability Estimates Obtained by Linear Model. Pakistan Journal of Biological Sciences, 10: 145-147.
DOI: 10.3923/pjbs.2007.145.147
URL: https://scialert.net/abstract/?doi=pjbs.2007.145.147
DOI: 10.3923/pjbs.2007.145.147
URL: https://scialert.net/abstract/?doi=pjbs.2007.145.147
INTRODUCTION
Two general classes of phenotypes, continuous and discrete, are considered in animal breeding data. Many traits of importance, such as litter size, calving ease, disease resistance and livability are measured on a discrete scale. Genetic evaluation methodology for categorical traits is different from that of continuous traits (Abdel-Azim and Berger, 1999). Wright (1934) postulated that a linear variable underlies categorical traits and thresholds define which category is observed. Based on threshold concept, nonlinear methods for sire evaluation have been described for categorical traits (Gianola, 1982; Gianola and Foulley, 1983; Harville and Mee, 1984; Gilmour et al., 1985). Univariate (Gianola and Foulley, 1983; Harville and Mee, 1984; Gilmour et al., 1985) and multivariate methods (Foulley et al., 1983; Janss and Foulley, 1993; Hoeschele et al., 1995) with the generalization to Markov Chain Monte Carlo methods (Albert and Chib, 1993; Hoeschele and Tier, 1995; Sorensen et al., 1995; Moreno et al., 1997; Wang et al., 1997; Van Tassell et al., 1998), allow the analysis of categorical traits with models that consider their particular structure of probability. Among reproductive traits, litter size (number of lambs born per ewe lambing) has most often been used as a selection criterion. Litter size is relatively easy to measure and report and heritability estimates for this trait are generally higher than other reproductive traits such as fertility or lamb survival. Fogarty (1995) reported that the weighted average heritability estimate for litter size was 0.10 but the mean coefficient of variation for litter size was high (36%), indicating potential for genetic improvement. The objective of this study was to compare heritability estimates obtained using a linear model fitted to phenotypic data for different threshold points.
MATERIALS AND METHODS
The base population was simulated producing 2000 individuals (1000 of each sex) and the trait of interest was litter size, for which the mean and the phenotypic variance were zero and 1.0, respectively. For each case of simulation and depending on the heritability values, different values of genetic and residual variances were used. Subsequent generations were produced through random mating between the individuals for 5 generations. The breeding values for individuals of subsequent generations were simulated through the mean breeding values of their parents which were added to a Mendelian Sampling (MS) effect that was simulated from a normal distribution with mean zero and variance equal to half of that of the genetic variance. Phenotypic values were simulated using the following equation:
pi = μ+BVi+ei |
Where,
| pi is the phenotypic value of the ith individual, |
| μ is the phenotypic mean of the trait in the population, |
| Bvi is the breeding value of the ith individual and |
| ei is the environmental value of the ith individual. |
Creation of dichotomous phenotype: In the simulation process, we applied different true background heritabilities in combination with different threshold points. To confer the binomial phenotype to individuals, if underlying phenotype of each individual was greater than or equal to the proposed threshold point, the threshold phenotype of individual was set to be equal to two and that of other individuals was one.
Genetic analyses: For genetic analysis with linear animal model, Restricted Maximum Likelihood procedure and Derivative Free Maximum Likelihood algorithm (DFREML) (Meyer, 1998) was used and run for ten different replicates for each threshold and for each heritability for that threshold. For the phenotypic categorical measurements, normal distribution of liability was assumed.
RESULTS AND DISCUSSION
Minimum, maximum and mean heritability estimates at different threshold points are shown in Table 1. For each threshold value a wide range of heritability was used to simulate the data set. While the simulated heritability ranged form 0.05 up to 0.95, the estimates obtained from the analysis ranged from 0.005 to 0.632. This was the wide range of estimates for simulated heritability which was obtained for the threshold point of zero. But when threshold points of -2 or +2 were used the range of estimates for simulated heritability narrowed down and in general did not exceed 0.263. Downward bias of estimated heritability showed a clear dependence on the amount of departure of the threshold points from zero.
The minimum and maximum estimated heritability correspond to the threshold points of +2 and zero, respectively and the mean of estimated heritability decreased by departing the points of threshold from the population mean. The threshold points with the lowest heritability had the lowest average estimates of heritability and the threshold points with the highest heritability had the highest average estimates of heritability.
| Table 1: | Minimum, maximum and average estimates of simulated heritability at different threshold points* |
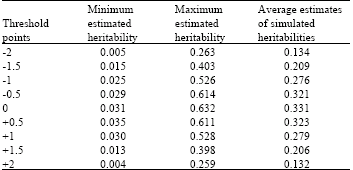 | |
*Heritability values from 0.05 to 0.95 (increments of 0.05) were used to simulate the data. Maximum estimates of simulated heritability correspond to the estimates of upper limit heritability and minimum estimates of simulated heritability correspond to estimates of lower limit heritability | |
| Table 2: | Minimum, maximum and average estimated heritability at different range of simulated heritabilities within different threshold points (threshold points are in the range of -2 to +2) |
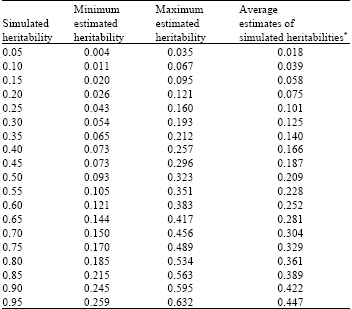 | |
* Average estimates of simulated heritabilities are the mean estimates of heritabilities at different range of simulated heritabilities within different threshold points | |
Minimum, maximum and average estimated heritability at different range of true (simulated) heritabilities within different threshold points are shown in Table 2. The minimum, maximum and average estimated heritability increased, as it is expected, along with the increase in simulated heritability. The minimum estimated heritabilities correspond to the extreme threshold points (i.e., Threshold points of +2 and -2) and the maximum estimated heritabilities correspond to the threshold point of zero.
These results clearly show that by departing the points of threshold from the population mean towards the two tails of the distribution and also by increasing the true heritability, the differences between estimated heritability and true heritability increases. The linear model has always underestimated true heritabilities. It is possible to use our estimates to obtain a confidence range for true heritability when we have information about approximate location of threshold and estimates of heritability obtained by linear model.
REFERENCES
- Abdel-Azim, G.A. and P.J. Berger, 1999. Properties of threshold model predictions. J. Anim. Sci., 77: 582-590.
Direct Link - Albert, J.H. and S. Chib, 1993. Bayesian analysis of binary and polychotomous response data. J. Am. Stat. Assoc., 88: 669-679.
Direct Link - Gianola, D., 1982. Theory and analysis of threshold characters. J. Anim. Sci., 54: 1079-1096.
Direct Link - Gianola, D. and J.L. Foulley, 1983. Sire evaluation for ordered categorical data with a threshold model. Genet. Select. Evol., 15: 201-224.
CrossRefDirect Link - Hoeschele, I. and B. Tier, 1995. Estimation of variance components of threshold characters by marginal posterior mode and means via Gibbs sampling. Genet. Select. Evol., 27: 519-540.
Direct Link - Hoeschele, I. and B. Tier and H.U. Graser, 1995. Multiple trait genetic evaluation for one polychotomous trait and several continuous traits with missing data and unequal models. J. Anim. Sci., 73: 1609-1627.
Direct Link - Janss, L.L.G. and J.L. Foulley, 1993. Bivariate analysis for one continuous and one threshold dichotomous trait with unequal design matrices and an application to birth weight and calving difficulty. Livest. Prod. Sci., 33: 183-198.
Direct Link - Sorensen, D.S., S. Andersen, D. Gianola and I. Korsgaard, 1995. Bayesian inference in threshold models using Gibbs sampling. Genet. Sel. Evol., 27: 229-249.
Direct Link - Van Tassel, C.P., L.D. Van Vleck and K.E. Gregory, 1998. Bayesian analysis of twinning and ovulation rates using a multiple-trait threshold model and Gibbs sampling. J. Anim. Sci, 76: 2048-2061.
Direct Link - Wang, C.S., R.L. Quaas and E.J. Pollak, 1997. Bayesian analysis of calving ease scores and birth weights. Genet. Select. Evol., 29: 117-143.
Direct Link