
Fazlul Huq
Discipline of Biomedical Science, School ofMedical Sciences,
Faculty of Medicine, Cumberland Campus, C42
The University of Sydney, Lidcombe, NSW, Australia
Journal of Pharmacology and Toxicology
Year: 2007 | Volume: 2 | Issue: 5 | Page No.: 447-455


ABSTRACT
Molecular modelling analyses based on molecular mechanics, semi-empirical (PM3) and DFT (at B3LYP/6-31G* level) calculations show that TGS and its major metabolites MIM, MIMA, MIMAG, ODMTGS, TGSG1, TGSG2 and TGSG3 have LUMO-HOMO energy differences ranging from 4.4 to 5.0 eV from DFT calculations so that they all would be moderately inert kinetically. The molecular surfaces of TGS and its metabolites are found to abound in neutral (green) and electron-rich (red and yellow) regions so that the compounds may undergo lyophilic and electrophilic attacks. The molecular surface of none of the compounds is found to abound in electron-deficient (blue) regions so that the compounds may not react readily with cellular nucleophiles such as glutathione and nucleobases in DNA. This means that none of the compounds may cause significant oxidative stress associated with glutathione depletion or DNA damage associated with oxidation of nucleobases.
PDF Abstract XML References Citation
How to cite this article
Fazlul Huq, 2007. Molecular Modelling Analysis of the Metabolism of Tegaserod. Journal of Pharmacology and Toxicology, 2: 447-455.
DOI: 10.3923/jpt.2007.447.455
URL: https://scialert.net/abstract/?doi=jpt.2007.447.455
DOI: 10.3923/jpt.2007.447.455
URL: https://scialert.net/abstract/?doi=jpt.2007.447.455
INTRODUCTION
Irritable Bowel Syndrome (IBS) is a common chronic functional disorder with different pathophysiologies and a spectrum of severity (Dossman, 1999; Appel-Dingemanse, 2002). Although both motor and sensory functions of the gut appear to be altered in individuals with IBS (Appel-Dingemanse, 2002), the exact pathophysiology of IBS remains unknown. Tagaserod (TGS; 3-(5-methoxy-1H-indol-3-ylmethylene-N-phenylcarbazimide) is a novel selective 5-HT4 receptor partial agonist that is indicated in patients with IBS. Clinical studies have shown TGS accelerates small bowel transit and improves overall GI symptoms in patients with constipation-predominant IBS (Sandham and Pfannkuche, 2006; Vickers et al., 2001). The drug is rapidly absorbed following oral administration with peak plasma concentrations being reached after about 1 h. It is approximately 98% bound to plasma proteins, primarily to α1-acid glycoprotein. It is well tolerated, with transient diarrhoea/soft stools being the most frequent adverse event (Camilleri, 2001; Fidelholtz et al., 2002; Hasler and Schoenfeld, 2004).
TGS is metabolized mainly via two pathways. The first is a pre-systemic acid-catalysed hydrolysis taking place in the stomach producing 3-(5-methoxy-1H-indol-methanal (MIM) which is oxidized to 3-(5-methoxy-1H-indol-methanoic acid (MIMA). MIMA is glucuroniated to form the terminal metabolite 3-(5- methoxy-1H-indol-methanoic acid-glucuronide (MIMAG). The main metabolite of TGS is O-desmethyl tegaserod (ODMTGS) formed from oxo-demethylation of TGS in liver microsomes. TGS can be glucuroniated at three nitrogen centres producing three isomeric glucorunides denoted as TGSG1, TGSG2 and TGSG3.
In this study, molecular modelling analyses have been carried out using the program Spartan ’02 (Spartan, 2002) to provide information on the relative toxicity of TGS and its metabolites MIM, MIMA, MIMAG, ODMTGS, TGSG1, TGSG2 and TGSG3.
COMPUTATIONAL METHODS
The geometries of TGS and its metabolites MIM, MIMA, MIMAG, ODMTGS, TGSG1, TGSG2 and TGSG3 (Fig. 1) have been optimised based on molecular mechanics, semi-empirical and DFT calculations, using the molecular modelling program Spartan ’04.
 | |
| Fig. 1: | Metabolic pathways for TGS in humans (Vickers et al., 2001) |
Molecular mechanics calculations were carried out using MMFF force field. Semi-empirical calculations were carried out using the routine PM3. DFT calculations were carried at B3LYP/6-31G* level. In optimization calculations, a RMS gradient of 0.001 was set as the terminating condition. For the optimised structures, single point calculations were carried out to give heat of formation, enthalpy, entropy, free energy, dipole moment, solvation energy, energies for HOMO and LUMO. The order of calculations: Molecular mechanics followed by semi-empirical followed by DFT ensured that the structure was not embedded in a local minimum. To further check whether the global minimum was reached, some calculations were carried out with improvable structures. It was found that when the stated order was followed, structure corresponding to the global minimum or close to that could ultimately be reached in all cases. Although RMS gradient of 0.001 may not be sufficiently low for vibrational analysis, it is believed to be sufficient for calculations associated with electronic energy levels. The study was carried out in the Discipline of Biomedical Science, The University of Sydney during January to March 2007.
RESULTS AND DISCUSSION
Table 1 gives the total energy, heat of formation as per PM3 calculation, enthalpy, entropy, free energy, surface area, volume, dipole moment and energies of HOMO (Hight occupied molecular orbital) and LUMO (Lowest occupied molecular orbital) as per both PM3 and DFT (Density functional thory) calculations for TGS and its metabolites MIM, MIMA, MIMAG, ODMTGS, TGSG1, TGSG2 and
| Table 1: | Calculated thermodynamic and other parameters of TGS and its metabolites – DM means dipole moment |
 | |
| * in au (atomic units) from DFT calculations | |
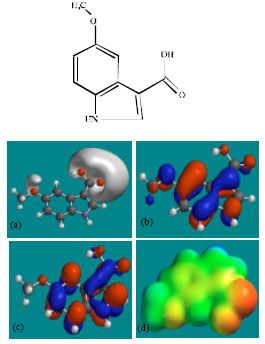
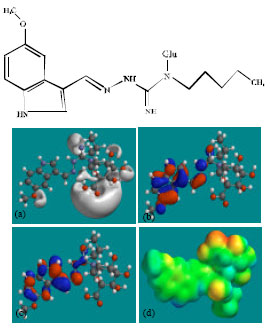
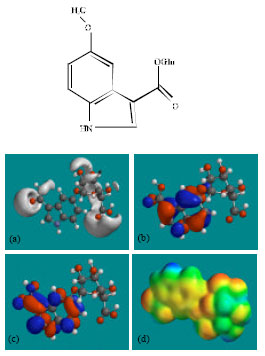
TGSG3. Figure 2-9 give the regions of negative electrostatic potential (greyish-white envelopes) in (a), HOMOs (where red indicates HOMOs with high electron density) in (b), LUMOs in (c) and density of electrostatic potential on the molecular surface (where red indicates negative, blue indicates positive and green indicates neutral) in (d) as applied to optimised structures of TGS, MIM, MIMA, MIMAG, ODMTGS, TGSG1, TGSG2 and TGSG3.
The LUMO-HOMO energy differences for TGS and its major metabolites MIM, MIMA, MIMAG, ODMTGS, TGSG1, TGSG2 and TGSG3 are found to range from 4.4 to 5.0 eV from DFT calculations indicating that they all would be moderately inert kinetically.
In the case of TGS, the electrostatic potential is found to be more negative around nitrogen and oxygen atoms, indicating that the positions may be subject to electrophilic attack. In the case of MIM, MIMA, ODMTGS, TGSG1, TGSG2, TGSG3 and MIMAG, the electrostatic potential is found to be more negative around the oxygen atoms, indicating that the positions may be subject to electrophilic attack.
In the case of TGS and ODMTGS, both the HOMOs with high electron density and the LUMOs are found to be located on the non-hydrogen atoms of the three rings. In the case of MIM and MIMA, both the HOMOs with high electron density and the LUMOs are found to be located on essentially all the non-hydrogen atoms. In the case of TGSG1, TGSG2 and TGSG3, both the HOMOS with high electron density and the LUMOs are found to be located on the non-hydrogen atoms of the three rings of TGS but on the non-hydrogen atoms of glucuronic acid moiety. In the case of MIMAG, both the HOMOS with high electron density and the LUMOs are found to be located on the non-hydrogen atoms of the two fused rings, but on the non-hydrogen atoms of glucuronic acid moiety.
The overlap of HOMO with high electron density and region of negative electrostatic potential at some positions, gives further support to the idea that the positions may be subject to electrophilic attack.
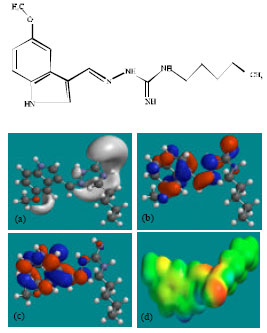 | |
| Fig. 2: | Structure of TGS giving in: (a) The electrostatic potential (greyish envelope denotes negative electrostatic potential), (b) The HOMOs, (where red indicates HOMOs with high electron density) (c) The LUMOs (where blue indicates LUMOs) and in (d) Density of electrostatic potential on the molecular surface (where red indicates negative, blue indicates positive and green indicates neutral) |
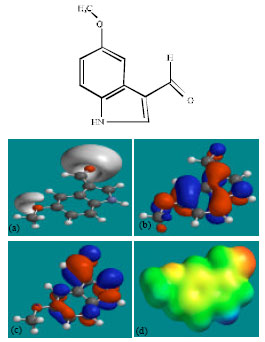 | |
| Fig. 3: | Structure of MIM giving in: (a) the electrostatic potential (greyish envelope denotes negative electrostatic potential), (b) the HOMOs, (where red indicates HOMOs with high electron density) (c) the LUMOs (where blue indicates LUMOs) and in (d) density of electrostatic potential on the molecular surface (where red indicates negative, blue indicates positive and green indicates neutral) |
 | |
| Fig. 4: | Structure of MIMA giving in: (a) the electrostatic potential (greyish envelope denotes negative electrostatic potential), (b) the HOMOs, (where red indicates HOMOs with high electron density) (c) the LUMOs (where blue indicates LUMOs) and in (d) density of electrostatic potential on the molecular surface (where red indicates negative, blue indicates positive and green indicates neutral) |
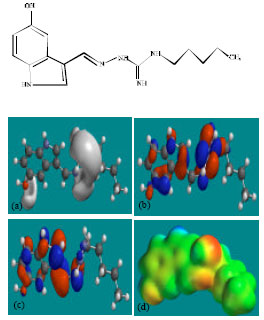 | |
| Fig. 5: | Structure of ODMTGS giving in: (a) the electrostatic potential (greyish envelope denotes negative electrostatic potential), (b) the HOMOs, (where red indicates HOMOs with high electron density) (c) the LUMOs (where blue indicates LUMOs) and in (d) density of electrostatic potential on the molecular surface (where red indicates negative, blue indicates positive and green indicates neutral) |
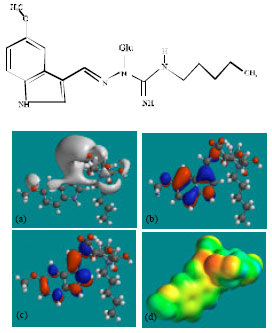 | |
| Fig. 6: | Structure of TGSG1 giving in: (a) the electrostatic potential (greyish envelope denotes negative electrostatic potential), (b) the HOMOs, (where red indicates HOMOs with high electron density) (c) the LUMOs (where blue indicates LUMOs) and in (d) density of electrostatic potential on the molecular surface (where red indicates negative, blue indicates positive and green indicates neutral) |
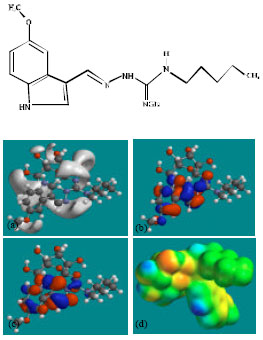 | |
| Fig. 7: | Structure of TGSG2 giving in: (a) the electrostatic potential (greyish envelope denotes negative electrostatic potential), (b) the HOMOs, (where red indicates HOMOs with high electron density) (c) the LUMOs (where blue indicates LUMOs) and in (d) density of electrostatic potential on the molecular surface (where red indicates negative, blue indicates positive and green indicates neutral) |
 | |
| Fig. 8: | Structure of TGSG3 giving in: (a) the electrostatic potential (greyish envelope denotes negative electrostatic potential), (b) the HOMOs, (where red indicates HOMOs with high electron density) (c) the LUMOs (where blue indicates LUMOs) and in (d) density of electrostatic potential on the molecular surface (where red indicates negative, blue indicates positive and green indicates neutral) |
 | |
| Fig. 9: | Structure of MIMAG giving in: (a) the electrostatic potential (greyish envelope denotes negative electrostatic potential), (b) the HOMOs, (where red indicates HOMOs with high electron density) (c) the LUMOs (where blue indicates LUMOs) and in (d) density of electrostatic potential on the molecular surface (where red indicates negative, blue indicates positive and green indicates neutral) |
The molecular surfaces of TGS and its metabolites are found to abound in neutral (green) and electron-rich (red and yellow) regions so that the compounds may undergo lyophilic and electrophilic attacks. The molecular surface of none of the compounds is found to abound in electron-deficient (blue) regions so that the compounds may not react readily with cellular nucleophiles such as glutathione and nucleobases in DNA. This means that none of the compounds is expected to cause significant oxidative stress associated with glutathione depletion or DNA damage associated with oxidation of nucleobases.
The solvation energy values of TGS and its metabolites from PM3 calculations are found to range from -12.0 to -30.3 kcal mol-1 with TGS having the lowest value, indicating that all the metabolites of TGS would be more soluble in water than the parent drug. When the dipole moments of the compounds are compared with solvation energy values, it is found that a high dipole moment does not necessarily correspond to a high solvation energy value, pointing out the complexity of the dissolution process in which processes such as hydrogen bonding and resonance stabilization may be playing key roles.
CONCLUSION
TGS is a novel selective 5-HT4 receptor partial agonist that is indicated in patients with IBS. Molecular modelling analyses based on semi-empirical and DFT calculations show that TGS and most of its metabolites have similar LUMO-HOMO energy differences so that they would not differ significantly in their kinetic lability. The molecular surfaces of TGS and any of its metabolites are found to abound in electron-deficient regions so that none is expected to react readily with glutathione and nucleobases in DNA. This means that TGS and its metabolites may not cause oxidative stress or damage to DNA.
ACKNOWLEDGMENTS
Fazlul Huq is grateful to the Discipline of Biomedical Science, School of Medical Sciences, The University of Sydney for the time release from teaching.
REFERENCES
- Appel-Dingemanse, S., 2002. Clinical pharmacokinetics of tegaserod, a serotonin 5-HT4 receptor partial agonist with promotile activity. Drug Dispos., 41: 1021-1042.
Direct Link - Camilleri, M., 2001. Review article: Tegaserod. Ailment Pharmacol. Ther., 15: 277-289.
PubMedDirect Link - Dossman, D.A., 1999. An integrated approach to the irritable bowel syndrome. Ailment Pharmacol. Ther., 13: 3-14.
Direct Link - Fidelholtz, J., W. Smith, J. Rawls, Y. Shi and A. Zack, 2002. Safety and tolerability of tegaserod in patients with irritable bowel syndrome and diarrhea symptoms. Am. J. Gastroenterol., 97: 1176-1181.
Direct Link