
Wu Xiao-lan
Triticeae Research Institute, Sichuan Agricultural University, Dujiangyan 611830, Sichuan, China
Lan Xiu-jin
Triticeae Research Institute, Sichuan Agricultural University, Dujiangyan 611830, Sichuan, China
Wei Yu-ming
Triticeae Research Institute, Sichuan Agricultural University, Dujiangyan 611830, Sichuan, China
Pu zhi-en
College of Agronomy, Sichuan Agricultural University, Dujiangyan 611830, Sichuan, China
Zheng You-liang
Triticeae Research Institute, Sichuan Agricultural University, Dujiangyan 611830, Sichuan, China
Journal of Plant Sciences
Year: 2009 | Volume: 4 | Issue: 1 | Page No.: 1-9
DOI: 10.3923/jps.2009.1.9


ABSTRACT
Although it is known that the compositions of gliadins have effects on bread-making quality of wheat, it is still not clear which gliadins confer improved bread-making quality and whether those gliadins interact with glutenins and other gliadins. Using a hard red winter wheat line 99E18 and zhengmai9023 with good bread-making quality as well as their progeny we identified gliadins associated with the bread-making quality. SDS-PAGE and APAGE method were used to analyze the gliadin composition and HMW-glutenin subunits of 45 wheat inbred lines and their relationships to bread-making quality were conducted. The significance of difference was calculated between the omega gliadins and bread-making quality. The positive and negative effects have been detected between the particular gliadin bands and baking quality. Thus, gliadin could be used as parameters when breeding for bread-making quality.
PDF Abstract XML References Citation
How to cite this article
Wu Xiao-lan, Lan Xiu-jin, Wei Yu-ming, Pu zhi-en and Zheng You-liang, 2009. Quality Evaluation of Gliadins from Zhengmai 9023x99E18 in Wheat. Journal of Plant Sciences, 4: 1-9.
DOI: 10.3923/jps.2009.1.9
URL: https://scialert.net/abstract/?doi=jps.2009.1.9
DOI: 10.3923/jps.2009.1.9
URL: https://scialert.net/abstract/?doi=jps.2009.1.9
INTRODUCTION
In wheat (Triticum aestivum L.) kernels, there are more than 100 different types of storage protein and it is well known that the protein constitution is of great significance for the baking quality of the dough. The storage proteins of wheat are composed mainly of gliadins and glutenins (Shewry and Tatham, 1990). The glutenins confer elasticity to the dough, while the gliadins are viscous and confer extensibility (Payne et al., 1984). Gliadins are heterogenous mixtures of single-chained polypeptide which are soluble in 70% aqueous alcohol. Based on their mobility in Acid polyacrylamide gel electrophoresis (A-PAGE), they are divided into four groups from fastest to slowest mobility as ![]() (Gianibelli et al., 2001). The high-molecular-weight glutenin subunits (HMW-GSs) are encoded by Glu-A1, Glu-B1 and Glu-D1 on the long arm of homoeologous group-1 chromosomes 1A, 1B and 1D, respectively. HMW-GSs are easily resolved by one-dimensional (1-D) sodium dodecyl sulphate-polyacrylamide gel electrophoresis (SDS-PAGE) and exhibit extensive variation among different cultivars (Payne et al., 1981; Branlard and Dardevet, 1985).
(Gianibelli et al., 2001). The high-molecular-weight glutenin subunits (HMW-GSs) are encoded by Glu-A1, Glu-B1 and Glu-D1 on the long arm of homoeologous group-1 chromosomes 1A, 1B and 1D, respectively. HMW-GSs are easily resolved by one-dimensional (1-D) sodium dodecyl sulphate-polyacrylamide gel electrophoresis (SDS-PAGE) and exhibit extensive variation among different cultivars (Payne et al., 1981; Branlard and Dardevet, 1985).
The correlation between gliadin components and flour quality has been reported (Sozinov and Poperelya, 1980; Mosleth and Uhlen, 1990). It has confirmed that γ-45 was positively correlated with gluten quality, while γ-42 gliadin band was negatively correlated with these criteria (Autran and Galterio, 1989).
It is known that HMW-GSs that confer good bread-making quality have been intensively studied. HMW-GS 5+10, encoded by the gene Glu-D1, plays an important role in dough properties appropriate for bread making, while the 2+12 subunit, encoded by the allelic gene, is not greatly involved (Payne et al., 1981, 1987). Zhengmai9023, without HMW-GS 5+10 and 99E18 with HMW- GSs 5+10 have been confirmed with good bread-making. It was not clear whether the gliadins of Zhengmai9023 were responsible for the good bread-making quality. The objective of this study was to identify the relationships between gliadins and bread-making quality in Zhengmai9023.
MATERIALS AND METHODS
Plant Materials
The Chinese winter wheat cultivars Zhengmai9023 and 99E18 which is a white winter wheat line developed at Crop Research Institute, Sichuan Academy of Agricultural Science, China were used. Both of them have good bread-making quality. Forty-five F6 inbred lines selected according to their elite agronomic traits derived from a cross between Zhengmai9023 and 99E18 were used to study flour properties.
Zhengmai9023, 99E18 and the forty-five F6 inbred lines were grown in 2006/2007 at Triticeae Research Institute, Sichuan Agricultural University, Dujiangyan, Sichuan, China. Seeds harvested were ground using a Brabender Jr test mill (Brabender Inc., Duisburg, Germany) and flour was obtained at an extraction rate of 60% from seeds harvested in 2007 using a test mill of Bühler Inc., Uzwil, Switzerland. The flour samples were used to evaluate flour properties and bread-making quality in baking tests.
SDS-PAGE
Total proteins were extracted from individually ground single seed. The reduced proteins were separated on polyacrylamide gels in the presence of SDS according to the method of Payne et al. (1980), with modifications according to Uhlen (1990). The glutenin pellet was dissolved in 100 μL of buffer containing 62.5 mM Tris (pH 6.8), 2% SDS (w/v), 10% glycerol (w/v),10% mercaptoethanol (v/v) and 0.002% bromophenol blue (BPB, w/v).The glutenin solution was subjected to SDS-PAGE, in which 7.5 μL of the solution was electrophoresed at 25 mA for 3 h at room temperature. The resultant. The gels were stained with 0.25% Coomassie brilliant blue solution overnight and destained with water for at least 1 day (Johansson et al., 1993). The HMW subunits of glutenin are designated according to the numbering system of Payne and Lawrence (1983).
A-PAGE of Gliadins
After grinding the one grains, the gliadins were extracted in 70% ethanol and fractionated by 1-D-polyacrylamide gel electrophoresis at pH 3.1 using the method of Bushuk and ZiUman (1987). The concentration of hydrogen peroxide, used as a catalyst for gel polymerization, was reduced according to Khan et al. (1985) to produce a firmer gel giving better resolution. The gels were stained with Coomassie brilliant blue solution as described by Uhlen (1990) and destained in 10% trichloracetic acid (TCA). The ghadin blocks are according to Metakovsky et al. (1984).
Bread-Making and Evaluation of Breads
The flour protein content was determined on a dry weight basis by near-infrared reflectance spectroscopy (Johansson and Svensson, 1995). SDS-sedimentation (SDSS) volume, described by Axford et al. (1979), is a good indicator of loaf volume. We performed a modified SDSS test in which the swelling time was prolonged and 100 mL of solution was added to 2.5 g of flour (Takata et al., 1999). All samples were milled into flour using a Brabender Quadrumat Jr. Mill and flour was standardized for ash 0.55%. Wet gluten content and Gluten Index were determined according to ICC standard method No. 155. Wet gluten in wheat flour is a plastic-elastic substance consisting of the proteins gliadin and glutenin, obtained after washing out the starch from wheat flour dough. Gluten separated from wheat flour is centrifuged to force wet gluten through a specially constructed sieve under standardized conditions. The percentage of wet gluten remaining on the sieve after centrifugation is defined as the Gluten Index. Rheological properties of doughs including development time, stability time, were tested by 80110-031035 type apparatus made Brabender company in Germany according to AACC54-21.
Statistical Analysis
All data analysis was performed under the software DPS (Data Proceeding System) version 6.5.
RESULTS
Relationship Between HMW-GSs and Bread-Making Quality
SDS-PAGE and APAGE of total protein extracts were used for a preliminary investigation of the composition of gliadins in ZM9023 and 99E18 (Fig. 1) as well as their 45 F6 inbred lines. ZM9023 contained HMW-GSs n, 7+8, 2+12 and 99E18 contained 1, 7+8, 5+10 (Fig. 1a). Two gliadin bands at mobility 0.15 and 0.18 were both found in parents, bands at mobility 0.29, 0.32 and 0.35 were found in the ZM9023 while bands at mobility 0.13, 0.23, 0.28, 0.30 and 0.36 were found in 99E18 (Fig. 1b).
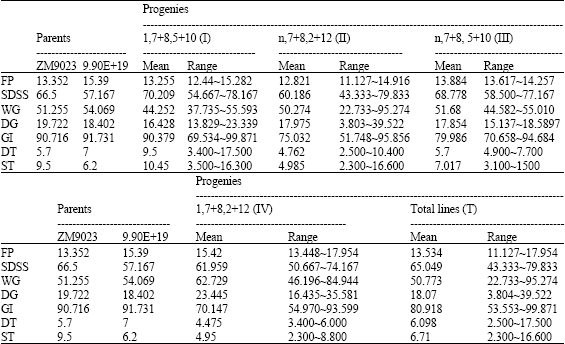
The HWM-GSs compositions in 45 inbred lines are shown in Table 1. Twelve lines carried HMW-GSs 1, 7+8, 5+10 (I), 26 lines carried HMW-GSs n, 7+8, 2+12 (II), 5 lines carried HMW-GSs n, 7+8, 5+10 (III) and 2 lines carried HMW-GSs 1, 7+8, 2+12 (IV). Parameters of bread-making quality of lines with different HWM-GSs were compared (Table 1). The parameters of the parents show that ZM9023 and 99E18 were all with good bread-making quality.
 | |
| Fig. 1: | SDS-PAGE (a) and APAGE (b) profile of gliadin and gluten proteins extracted from ZM9023 and 99E18 E , 99E118; Z, ZM9023; number in A, HMW-GSs; number in B, gliadin bands order of ω zone |
In total progeny lines (T), parameters of the progeny show that flour protein content varied from 11.127 to 17.954%, with the mean of 13.534%. SDS-sedimentation volume varied from 43.333 to 79.833 mL, with the mean of 65.094 mL. Gluten index varied from 22.733 to 95.274% and the stability time varied from 2.3 to 16.6 min. All of the quality parameters not only in type T but also in the different HMW-GSs show much high ranges. Most parameters in type I show better bread-making quality than in type II even though there is not significant difference between two parents.
Relationship Between Gliadin Bands and Bread-Making Quality
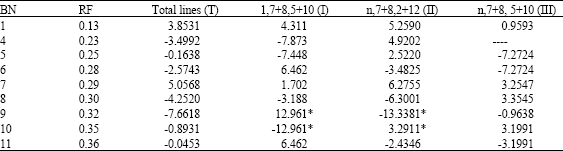
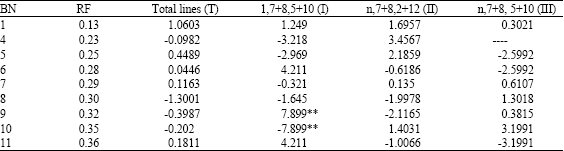
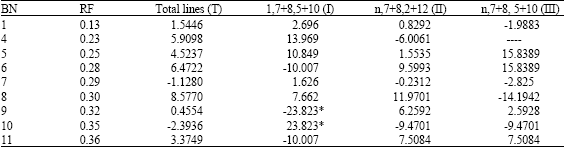
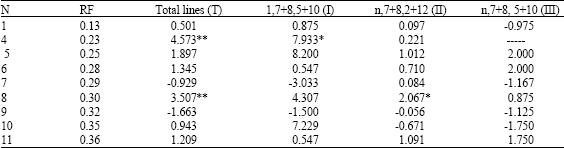
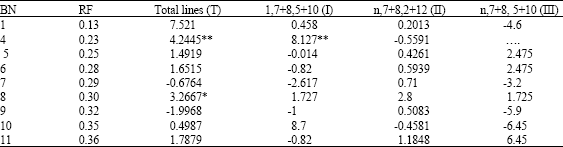
In 45 inbred lines, a total of 11 gliadin bands were identified at ω zone, each bands shows polymorphism except two bands at mobility 0.15 and 0.18. Namely ZM9023 0.29, 0.32, 0.35 and 99E18 0.13, 0.23, 0.25, 0.28, 0.30, 0.36. The number of total bands among the lines varied between lines whereas the lowest number was three bands while the highest number was eight bands at different electrophoretic mobility. By comparing the bread-making quality parameters between the lines with the bands or not, we identified that positive and negative significant effects have been established between particular gliadin bands and baking quality. Table 2-7 are displayed by minus values between the lines with the bands or not and all the significant difference were test though the analysis of unary random comparative experiment performed under the software DPS The two lines in type IV does not carry out analysis because of identical gliadin pattern.
| Table 1: | The bread-making quality of total materials |
 | |
| FP: Flour protein content (%); SDSS: SDS-sedimentation volume (mL); WG: Wet gluten (%); DG: Dry gluten (%); GI: Gluten index (%); DT, Development time (min); ST, stability time (min) | |
| Table 2: | The relationship between gliadin bands at various relative mobilities (RF) and flour protein content (%) |
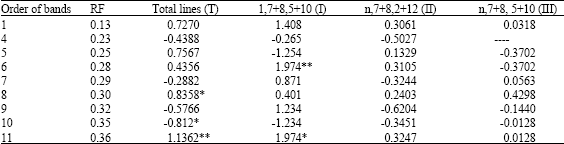 | |
| Mean without polymorphism; *,**Mean values significantly different at p = 0.05 and p = 0.01, respectively | |
| Table 3: | The relationship between wet gluten (%) and gliadin bands |
 | |
| Mean without polymorphism; *Mean values significantly different at p = 0.05 | |
| Table 4: | The relationship between dry gluten (%) and gliadin bands |
 | |
| Mean without polymorphism; **Mean significantly different at p = 0.01 | |
Flour Protein Content (FP)
The bands at mobility 0.13 do not show significantly different but show positive effect in four types while 0.23 show negative (Table 2). However, 0.25, as well as 0.29 and 0.32 show uncertain effects with flour protein content in the four types, respectively. The band at mobility 0.28 show significantly positive impact at p = 0.01 in type I. The band at mobility 0.30 and 0.36 show positive effect in the four types and significantly different at p = 0.05 and p = 0.01 in type T. The band at mobility 0.35 show consistently negative effect in the four types and significantly different at p = 0.05 in type T.
Wet Gluten (WG)
The bands at mobility 0.13 and 0.29 do not show significantly different, but show positive effects on flour protein content, while the other bands show uncertain effects in the four types (Table 3). The two bands at mobility 0.32 and 0.35 show significantly different at p = 0.05, respectively found in type I and II, but they give opposite direction between two types. It suggested that they have especial interaction with HMW-GS potentially.
Dry Gluten (DG)
The band at mobility 0.13 also show positive effect on dry gluten although not show significant difference, while the other bands show uncertain effects in the four types (Table 4). The two bands at mobility 0.32 and 0.35 show significantly different at p = 0.01, only found in type I. The band at mobility 0.32 show positive effects while the band at mobility 0.35 show negative (Table 4).
| Table 5: | The relationship between gluten index (%) and gliadin bands |
 | |
| Means without polymorphism; *Means significantly different at p = 0.05 | |
| Table 6: | The relationship between development time (min) and gliadin bands |
 | |
| Mean without polymorphism; *, **Mean values significantly different at p = 0.05 and p = 0.01, respectively | |
| Table 7: | The relationship between stability time (min) and gliadin bands |
 | |
| Mean without polymorphism; *, **Mean values significantly different at p = 0.05 and p = 0.01, respectively | |
Gluten Index (GI)
The band at mobility 0.25 show positive effect on gluten index although not show significant difference, while the other bands show uncertain effects in the four types. Two bands at mobility 0.32 and 0.35 were found in type I show significantly different at p = 0.05. The band at mobility 0.32 show negative correlation with DG while the band at mobility 0.35 show positive (Table 5).
Development Time (DT)
Two bands at mobility 0.23 and 0.30 show positive effects on bread-making quality in the four types and significant effects at p = 0.01 were detected in type T and at p = 0.05 in type I and II respectively. The other bands do not show significantly different and uncertain effects except the bands at mobility 0.25 and 0.28 which show positive effects among the four types (Table 6).
Stability Time (ST)
The band at mobility 0.23 shows positive effects on bread-making quality were detected at p = 0.01 in type T and in type I, respectively. The band at mobility 0.30 were found in type T at p = 0.05. The other bands do not show significantly different but show uncertain effects among the four types (Table 7).
DISCUSSION
The parameters between lines show high variation not only in type T but also in all the sub types of progeny (Table 1). The bread-making qualities varied from low to high attribute to the appearance of some particular gliadin bands even though with the same HMW-GSs. It indicates that some particular gliadin bands offer real effects to bread-making qualities in wheat.
Most parameters of the bread-making qualities for 45 inbreed lines show better in type I than in type II even though there is not significant difference between two parents. The result is identical with other previous studies that the HMW-GS 5+10 indeed contribute to good bread-making quality.
When the bread-making qualities of the 45 inbreed lines were compared considering the gliadin bands, the better bread-making quality was associated with the presence of bands at mobility 0.23, 0.28, 0.30 and 0.36. The bands at mobility 0.32 and 0.35 from ZM9023 have various impacts, the former is favorable for WG and DG against GI and the latter is just reversed (Table 3-5). It is well known that the stability time mean the stability of dough. The higher the stability time showed, the better bread-making quality the dough is. The band found in 99E18 at mobility 0.23 show higher stability time especially in type I (Table 7). The contribution of the gliadin band at mobility 0.23 present in type I to superior bread-making quality was also indicated by the development time_in baking tests (Table 6). Therefore, we hypothesized that in addition to HMW-GS 5+10, the gliadin bands found in 99E18 are responsible for the good bread-making quality. There is no significantly difference in the type III with every parameters of bread-making quality because of lacking sample. Apart from varietal identification, variation in prolamin composition is beginning to be exploited by wheat breeders in the development of new varieties with improved bread-making qualities. Several investigators have shown correlations between specific HMW-GSs and bread-making quality (Burnouf and Bouriquet, 1980; Moonen and Zeven, 1984; Branlard and Dardevet, 1985; Campbell et al., 1987; Cressey et al., 1987; Payne, 1987; Ng and Bushuk, 1987; Uhlen, 1990; Johansson and Svensson, 1995). The significant difference of some parameters of bread-making quality aroused by gliadins could be construed as either to the gliadins themselves or as special glutelin compositions associated with them (Payne, 1987).
Certainly, we don’t exclude the effects originated from low-molecular-weight glutenin subunit (LMW-GS), which will be studied soon. Both positive and negative effects of specific LMW-GS on wheat flour quality have been reported by Branlard et al. (2001) and Eagles et al. (2002). And in fact, Vazquez had detected that Low Mr subunits 1+14, tightly linked to γ-45 had a significant positive effect, whereas low Mr subunits 6+11, tightly linked to γ-42 had a significant negative effect on gluten quality (Vazquez, 1996). If this is in case, we should pay more attention to the links between gliadins and low Mr subunits as well as their contributions to bread-making quality.
Furthermore, analyses of random lines from this cross have shown that part of the progeny also show better bread-making quality than their parents. Thus, we can improve the baking quality of wheat by crossing varieties that have complementary, good-quality prolamins and to screen embryo less half grains at later generations by electrophoresis. A few of the progeny will have the best combination of prolamins possible for the cross and their bread-making qualities will be better than those of their parents. The remaining embryo-parts of these selected grains can then be grown and evaluated for other characters in later generations (Payne, 1987).
CONCLUSION
The present study analyzed the relation between bread-making quality and gliadins of progeny lines from Zhengmai9023x99E18. For flour protein content, the presence of bands at mobility 0.28 and 0.36 from 99E18 show obvious positive effects. It could be associated with high number of gliadin bands. About gluten, the bands at mobility 0.32 and 0.35 from ZM9023 have various impacts, the former is favorable for WG and DG against GI and the latter is just reversed. With property of paste, the bands at mobility 0.23 and 0.30 in 99E18 may be related to high DT and ST.
ACKNOWLEDGMENTS
The researchers are thankful to the National Natural Science Foundation of China (30471088, 30370883), National High Technology Research and Development Program of China (863 program 2006AA10Z1F8), the Science and Technology Committee and Education Committee of Sichuan Province. Y.-M.Wei was supported by the Program for New Century Excellent Talents in Universities of China (NCET-05-0814), Y.-L. Zheng was supported by the Program for Changjiang Scholars and Innovative Research Teams in Universities of China (IRT0453).
REFERENCES
- Autran, J.C. and G. Galterio, 1989. Associations between electrophoretic composition of proteins, quality characteristics and agronomic attributes of durum wheat. II. Protein-quality associations. J. Cereal Sci., 9: 195-215.
CrossRef - Axford, D.W.E., E.E. McDermott and D.G. Redman, 1979. Note on the sodium dodecyl sulfate test of breadmaking quality: Comparison with Pelshenke and Zeleny tests. Cereal Chem., 56: 582-584.
Direct Link - Bushuk, W. and R.R. Zillman, 1978. Wheat cultivar identification by gliadin electrophoregrams. I. Apparatus, method and nomenclature. Can. J. Plant. Sci., 58: 505-515.
Direct Link - Burnouf, T. and R. Bouriquet, 1980. Glutenin subunits of genetically related European hexaploid wheat cultivars: Their relation to bread-making quality. Theory Applied Genet., 58: 107-111.
CrossRef - Branlard, G. and D. Dardevet, 1985. Diversity of grain protein and bread wheat quality. II. Correlation between high molecular weight subunits of glutenin and flour quality characteristics. J. Cereal Sci., 3: 345-354.
CrossRef - Branlard, G., M. Dardevet, R. Saccomano, F. Lagoutte and J. Gourdon, 2001. Genetic diversity of wheat storage proteins and bread wheat quality. Euphytica, 119: 59-67.
CrossRef - Campbell, W.P., C.W. Wrigley, P.J. Cressey and C.R. Slack, 1987. Statistical correlations between quality attributes and grain-protein composition for 71 hexaploid wheats used as breeding parents. Cereal Chem., 64: 293-299.
Direct Link - Cressey, P.J., W.P. Campbell, C.W. Wrigley and W.B. Griffin, 1987. Statistical correlations between quality attributes and protein composition for 60 advanced breeding lines of crossbred wheat. Cereal Chem., 64: 299-301.
Direct Link - Eagles, H.A., G.J. Hollamby, N.N. Gororo and R.F. Eastwood, 2002. Estimation and utilization of glutenin gene effects from the analysis of the unbalanced data from the wheat breeding programs. Aust. J. Agric. Res., 53: 367-377.
CrossRefDirect Link - Gianibelli, M.C., O.R. Larroque, F. MacRitchie and C.W. Wrigley, 2001. Biochemical, genetic and molecular characterization of wheat glutenin and its component subunits. Cereal Chem., 78: 635-646.
CrossRef - Johansson, P., G. Henriksson Svensson and W.K. Heneen, 1993. Detection, chromosomal location and evaluation of the functional value of anovel high Mr glutenin subunit found in Swedish wheats. J. Cereal Sci., 17: 237-245.
CrossRef - Johansson, E. and G. Svensson, 1995. Contribution of the high molecular subunit 21* to bread-making quality of Swedish wheats. Cereal Chem., 72: 287-290.
Direct Link - Khan, K., A.S. Hamada and J. Patek, 1985. Polyacrylamide gel electrophoresis for wheat variety identification: Effect of variables on gel properties. Cereal Chem., 62: 310-313.
Direct Link - Mosleth, E. and A.K. Uhlen, 1990. Identification of quality-related gliadins and prediction of bread-making quality of wheat from the electrophoretic patterns of gliadins and high molecular weight subunits of glutenin. Norw. J. Agric. Sci., 4: 27-45.
Direct Link - Metakovsky, E.V., A.Y. Novoselskaya, M.M. Kopus, T.A. Sobko and A.A. Sozinov, 1984. Blocks of gliadin components in winter wheat detected by one-dimensional polyacrylamide gel electrophoresis. Theory Applied Genet., 67: 559-568.
CrossRef - Ng, P.K.W. and W. Bushuk, 1987. Glutenin of Marquis wheat as a reference for estimating molecular weights of glutenin subunits by sodium dodecyl sulfate-polyacrylamide gel electrophoresis. Cereal Chem., 64: 324-327.
Direct Link - Payne, P.I., C.N. Law and E.E. Mudd, 1980. Control by homologous group 1 chromosomes of the high-molecular-weight subunits of glutenin, a major protein of wheat endosperm. Theor. Applied Genet., 58: 113-120.
CrossRef - Payne, P.I., L.M. Holt and C.N. Law, 1981. Structural and genetical studies on the high-molecular-weight subunits of wheat glutenin. Part I: Alleic variation in subunits amongst varieties of wheat (T. aestivum). Theor. Applied Genet., 60: 229-236.
CrossRefDirect Link - Payne, P.I., L.M. Holt, J. Hutchingson and M.D. Bennett, 1984. Development and characterisation of a line of bread wheat, Triticum aestivum, which lacks the short-arm satellite of chromosome 1B and the Gli-B1 locus. Theory Applied Genet., 68: 327-334.
CrossRef - Payne, P.I., 1987. Genetics of wheat storage proteins and the effect of allelic variation on bread-making quality. Annu. Rev. Plant Physiol., 38: 141-153.
CrossRefDirect Link - Sozinov, A.A. and F.A. Poperelya, 1980. Genetic classification of prolamines and its use for plant breeding. Ann. Technol. Agric., 29: 229-245.
Direct Link - Shewry, P.R. and A.S. Tatham, 1990. The prolamin storage protein of cereal seeds: Structure and evolution. Biochem. J., 267: 1-12.
PubMed - Takata, K., H. Yamauchi, N. Iriki and T. Kuwabara, 1999. Prediction of bread-making quality by prolonged swelling SDS-sedimentation test. Breeding Sci., 49: 221-223.
Direct Link