
M.A.M. Alsafy
Department of Anatomy, Faculty of Veterinary Medicine, Alexandria University, Egypt
S.A.A. El-Gendy
Department of Anatomy, Faculty of Veterinary Medicine, Alexandria University, Egypt
M.H. El-Kammar
Department of Surgery, Faculty of Veterinary Medicine, Alexandria University, Egypt
M. Ismaiel
Department of Internal Medicine, Faculty of Veterinary Medicine, Alexandria University, Egypt
Journal of Medical Sciences
Year: 2013 | Volume: 13 | Issue: 5 | Page No.: 316-326


ABSTRACT
The present study was performed to observe and examine the abdominal organs structure and position by contrast X-ray, ultrasonography and Computed Tomography (CT) and the function of the gastrointestinal tract to establish a basics diagnostic aid to be for use by anatomists, radiologists, surgeons and veterinary students. The stomach, intestine, liver, spleen, the caudal vena cava, portal vein and gall bladder were examined by contrast X-ray, ultrasonography and CT scans in twelve zaraibi goats aging 1-1.5 years and weighing 25-30 kg. The caudal vena cava, portal vein and gall bladder diameters decreased from the 9th to the 12th intercostal spaces through ultrasonographic imaging measurement. The fatty liver infiltration determined by ultrasonography. The radiographic examined the structural pattern of the abdominal organs by contrast X-ray, ultrasonography and computed tomography and the function of the gastrointestinal tract to establish a basics diagnostic aid. The obtained results cleared that contrast X-ray, ultrasonography and CT were safe, practical and easily performed in goat. Both radiographic and ultrasonographic procedures were complimentary in the evaluation of the gastrointestinal tract, spleen and liver condition while CT scans was a superior soft tissue differentiation over conventional X-ray techniques.
PDF Abstract XML References Citation
Received: March 29, 2013;
Accepted: May 06, 2013;
Published: June 13, 2013
How to cite this article
M.A.M. Alsafy, S.A.A. El-Gendy, M.H. El-Kammar and M. Ismaiel, 2013. Contrast Radiographic, Ultrasonographic and Computed Tomographic Imaging Studies on the Abdominal Organs and Fatty Liver Infiltration of Zaraibi Goat. Journal of Medical Sciences, 13: 316-326.
DOI: 10.3923/jms.2013.316.326
URL: https://scialert.net/abstract/?doi=jms.2013.316.326
DOI: 10.3923/jms.2013.316.326
URL: https://scialert.net/abstract/?doi=jms.2013.316.326
INTRODUCTION
The contrast X-ray is helpful in studying the structure and function of the gastrointestinal tract as well as diagnosing the diseased condition (Abu zaid, 1995) in goat, (Sharma et al., 1984) in sheep and (Rubesin et al., 2008) in human. The contrast radiology in diagnosis of reticular hernia in bovine has been stressed (Kumar et al., 1980; Singh et al., 1990; Athar et al., 2010; Saini et al., 2007) compared both the intravenous and oral cholecystography in goats. Abdominal ultrasonography is a safe procedure with no risk for the patient and sonographer and it enables a serial examination to monitor the progression of the condition and response to treatment (Kofler and Hittmair, 2006). It provides the best diagnosis in combination with radiology (Yamaga and Too, 1984; Torkelson, 2002; Braun, 2003). Hepatic, gall bladder and splenic sonography were widely applied (Abu zaid, 1995). Computed tomography has a potential advantage over routine radiography. CT provides soft tissue differentiation, no superimposition of overlying structure. CT cross-sectional images that used not only to diagnose abnormalities, but also to quantify the severity of these abnormalities (Hathcock and Stickle, 1993; Abu zaid, 1995; Sandrasegaran et al., 2007). CT is now perceived as central to the diagnosis and clinical management of many cases (Goh et al., 2005).
So, the aim of the present study performed to observe and examine the radiographic structure pattern of the abdominal organs by contrast X-ray, ultrasonography and computed tomography and the function of the gastrointestinal tract to establish a basics diagnostic aid to be for use by anatomists, radiologists, surgeons and veterinary students.
MATERIALS AND METHODS
Twelve native breed zaraibi goats aging 1-1.5 years and weighing 25-30 kg were used. The study was approved by the committee of animal welfare and ethics at the Faculty of Veterinary Medicine, Alexandria University. This study was start at January 2011 and expanded 1.5 year.
Topographic anatomy: Two goats were used to explain the position and the different anatomical features of the abdominal digestive organs (Fig. 1a, b).
Contrast radiography: Three goats were administered barium sulfate suspension (70% w/v) by stomach tube as a positive contrast medium at dose of 25 mL kg-1 b.wt. after 48 h of fasting and were subjected to right lateral and ventrodorsal serial radiographs after 10, 20, 30 min, 1, 12, 24 and 48 h.
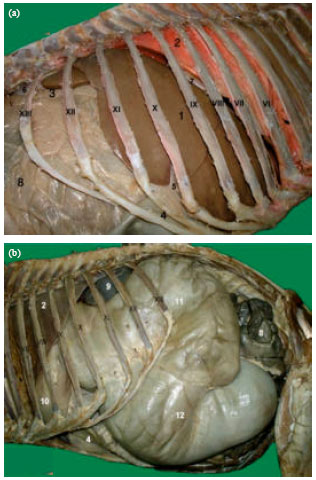 | |
| Fig. 1(a-b): | Topographic anatomy of the abdominal organs, (a) Right view of the abdominal cavity and (b) Left view of the abdominal cavity, 1: Liver, 2: Lung, 3: Duodenum, 4: Abomasum, 5: Gall bladder, 6: Right kidney, 7: Diaphragm, 8: Intestine, 9: Spleen, 10: Reticulum, 11: Dorsal ruminal sac and 12: Ventral ruminal sac |
Contrast X-ray was employed, using 25-40 kilovolt energy source along with current of 12-20 million sec-1 for 0.2 sec diandon, a distance of 60-80 cm.
Ultrasonographic examination: Four goats were fasted for 12 h prior to the ultrasonographic examination by 6 MHZ linear transducer. The hair of the right and left sides of the animals was clipped from the vertebrae dorsally to the linea Alba ventrally and from the 5th rib cranially to the pelvic inlet caudally. Acousting coupling gel was applied to the skin. Each goat was examined at ventral thorax, lateral abdominal wall and from the 5th to the last intercostal spaces on the right and left sides on standing position with the animal head was directed either dorsally or craniodorsally (El-Kammar et al., 2012).
Computed tomographic scans: Three goats were used for the CT scans after physical examination and fasting for 24 h. The goats were sedated with 2% xylazine HCl (0.1 mg kg-1 b.wt.) and positioned in sternal recumbancy during scanning time. A slice thickness 1 cm a part interval on the abdomen at 120 K.V., 200 mps, F3 HF/S and W 200+64 was used for all CT images (Abuzaid and Imam 2000; Alsafy, 2008).
Statistical analysis: All values of the diameter and depth of the caudal vena cava as well as the length and width of the gall bladder were expressed as Mean±SE. The data were analyzed using general linear model of SAS (1996), while the difference between means was detected by ANOVA and Duncan’s Multiple Range Test.
RESULTS
Contrast radiography
Rumen: The Rumen appeared completely in lateral and ventrodorsal abdominal radiograph (Fig. 2, 3). It extended from the 8th rib cranially to the pelvic inlet caudally and from the vertebral column dorsally to the abdominal floor ventrally.
Reticulum: the reticulum appeared piriform structure just behind diaphragm from the left 6th to the left 8th intercostal spaces in contact with the abdominal floor in the xiphoid region. It was demonstrated immediately just after barium administration until 48 h (Fig. 2, 3).
Omasum: The omasum appeared bean shape after 10 min of barium administration then appeared circular shaped from the 8th to the 12th interchondral space in the right side of abdominal cavity (Fig. 2, 3) and it was seen clearly in the ventrodorsal radiograph than the lateral one.
Abomasum: The abomasum appeared after 20 min from barium administration in the ventral part of the cranial abdominal region between the reticulum cranially and ventral ruminal sac caudally (Fig. 2, 3). The fundic region was clear in lateral radiograph due to superimposition of the rumen (Fig. 2c). In ventrodorsal radiographs, the abomasum located completely in the right side of the abdominal cavity, it extended from the 8th intercostal space to the 12th intercostal spaces (Fig. 3a).
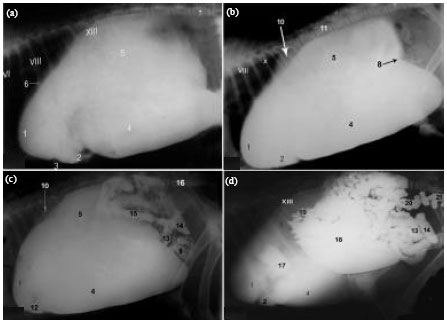 | |
| Fig. 2(a-d): | Lateral abdominal radiograph of the gastrointestinal tract, (a) After 20 min of barium administration, (b) After 1 h of barium administration, (c) After 4 h of barium administration, (d) After 24 h of barium administration, 1: Reticulum, 2: Abomasum, 3: Ruminoreticular groove, 4: Ventral ruminal sac, 5: Dorsal ruminal sac, 6: Diaphragm, 7: 5th lumbar vertebrae, 8: Caudal transverse pillar or groove, 9: Duodenum, 10: Spleen, 11: 1st lumbar vertebrae, 12: Fundus abomasum, 13: Ileum, 14: Cecum, 15: Ascending colon, 16: 6th lumbar vertebrae, 17: Omasum, 18: Spiral colon, 19: Transverse colon, 20: Sigmoid flexure of descending colon and 21: Rectum, VI,VIII, XIII, XIII indicates the number of ribs |
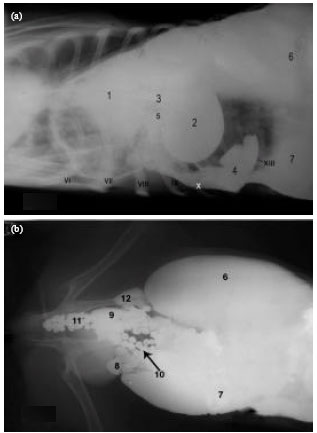 | |
| Fig. 3(a-b): | Ventrodorsal abdominal radiograph of the gastrointestinal tract, (a) After 1 h of barium administration and (b) After 24 h of barium administration, 1: Reticulum, 2: Omasum, 3: Reticuloomasal opening, 4: Abomasum, 5: Omasoabomasal opening, 6: Dorsal ruminal sac, 7: Ventral ruminal sac, 8: Duodenum, 9: Cecum, 10: Sigmoid flexure of the descending colon, 11: Rectum and 12: Ascending colon, VI, VII, VIII, IX, X, XIII indicates the number of costal cartilages |
The pylorus was noticed to be directed cranial to reached 11th intercostal space after one hour, it was filled with contrast media and appeared until 48 h.
Intestine: The duodenum, jejunum and ileum demonstrated convoluted radiolucent bands which appeared 1-3 h after barium administration in lateral radiographs (Fig. 2c, d). In ventrodorsal radiographs, the duodenum indicated in the right side of the abdominal cavity between the rumen and the right abdominal wall (Fig. 2b). The cecum, colon and rectum occupied the right middle and upper thirds of abdominal cavity. The cecum demonstrated after 3 to 4 h after barium administration. In lateral radiograph, the cecum appeared as cylindrical or u-shape structure under the 4th lumbar vertebrae until the pelvic inlet (Fig. 2c-d). In ventrodorsal radiograph, it located at the right side of the abdominal cavity. The shape and position of the cecum influenced by its content, it floated high when filled with gases and sinked when filled by ingesta. The proximal part of the ascending colon demonstrated 4 h after barium administration (Fig. 2c), whatever the complete filling of the ascending colon was after 6 h; it appeared u-shape in lateral radiograph. The contrast medium observed in the spiral colon after 8 h from barium administration (Fig. 2d). The spiral loops were not clearly demonstrated where the coils obscured by the rumen, cecum and the overlapping of the loops over each other. In lateral radiographs, the descending colon identified by its contents of the fecal pellet that covered by barium after 9 h at the roof of the abdomen, the sigmoid colon demonstrated under the 6th lumbar vertebrae (Fig. 2d).
Ultrasonographic examination
Rumen: The rumen appeared a thick smooth echogenic line (Fig. 4a) adjacent to the left abdominal wall. The craniodorsal blind sac was seen as echogenic lines caudal to the reticulum (Fig. 4e) while the ruminal contents could not be visualized because of their gaseous nature.
Reticulum: The reticulum visualized a half moon-shaped structure with a smooth contour (Fig. 4b, e). The different layers of the reticular wall could not be imaged and honeycomb like structure of the mucosa was not often seen clearly. The reticular motility characterized by contracted and relaxed reticulum (Fig. 4b, c).
Omasum: The omasal wall was seen a circular echogenic line medial to the duodenum and its wall was appeared thick than that of the reticulum (Fig. 4d). The omasum contents were not imaged, whatever the omasal lamina was seen clearly (Fig. 4f).
Abomasum: The abomasum was visualized from the ventral midline caudal to the xiphoid process. It was seen immediately caudal to the reticulum between the rumen and ventral abdominal wall (Fig. 4e). The wall of the abomasum appeared a thin echogenic line and it was easily differentiated from neighboring organs because of its contents which appeared a moderate heterogeneous echogenic structure with echogenic stippling.
Spleen: The spleen indicated between the rumen and left abdominal wall from the 9th to the 12th intercostal spaces. The parenchyma of the spleen appeared consisted of numerous weak echoes homogenously distributed over the entire area of the organ (Fig. 5a).
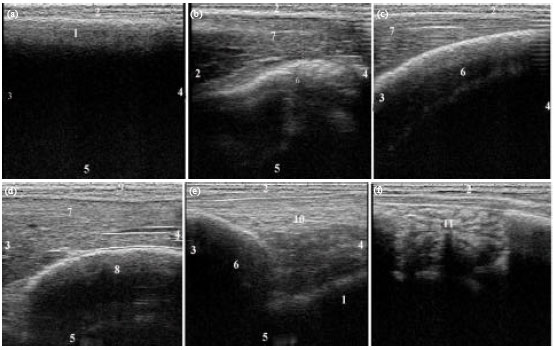 | |
| Fig. 4(a-f): | Sonogram of the stomach parts (rumen, reticulum, omasum and abomasum), (a) Sonogram of rumen (at the left paralumbar fossa), (b) Sonogram of contracted reticulum (at the ventral part of the right 6th intercostal space), (c) Sonogram of relaxed reticulum (at the ventral part of the right 6th intercostal space), (d) Sonogram of omasum and liver (at the right 8th intercostal space), (e) Sonogram of abomasum and related structures (at the ventral part of the right 7th intercostal space) and (f) Sonogram of abomasal folds (at the ventral part of left flank), 1: Rumen, 2: Left abdominal wall, 3: Dorsal side, 4: Ventral side, 5: Medial side, 6: Reticulum, 7: Liver, 8: Omasum, 9: Right abdominal wall, 10: Abomasum and 11: Omasal folds |
The spleen capsule demonstrated by a fine echogenic line. The splenic vessels appeared an echoic oval or elongated structures (Fig. 5a).
Liver: The liver was examined from the 9th to the 11th right intercostal spaces. The liver appeared high echogenic than the cortex of the kidney and low echogenic than the spleen (Fig. 5b, d).
Caudal vena cava: The caudal vena cava appeared as anechoic triangular area dorsomedial to the portal vein from the 9th to the 12th right intercostal spaces and its wall was not visible (Fig. 5d, e). The caudal vena cava diameter was 1.28±0.26, 1.22±0.11, 1.04±0.11 and 1.13±0.15 cm at the 9th, 10th, 11th and 12th right intercostal spaces, respectively. Whatever, the depth of the caudal vena cava was 3.40±0.30, 3.27±0.35, 2.2±0.42 and 2.58±0.52 cm at the 9th, 10th, 11th and 12th right intercostal spaces, respectively (Table 1).
Portal vein: The portal vein appeared as anechoic circular area surrounded by an echogenic wall and star shaped ramifications into the liver tissue. It was examined from the 9th to the 12th right intercostal spaces (Fig. 5d-e/13, 13`). The portal vein diameter was 0.91±0.15, 0.98±0.23, 1.04±0.11 and 1.12±0.20 cm at the 9th, 10th, 11th and 12th right intercostal spaces, respectively. Whatever the depth of the portal vein was 2.5±0.24, 2.42±0.26, 2.2±0.42 and 2.38±0.35 cm at the 9th, 10th, 11th and 12th right intercostal spaces, respectively (Table 1).
Gall bladder: The gall bladder was scanned between the liver dorsally and the small intestine ventromedial at the right side of the abdominal cavity at ventral part of the 9th to the 10th intercostal spaces deep to the costal arch. It appeared as anechoic oval or pear shaped structure with a bright margin adjacent to the abdominal wall (Fig. 5f). The liver parenchyma appeared more echogenic deep to the gall bladder due to presence of an area of enhancement (Fig. 5f). The size of the gall bladder varied greatly; its average dimensions were 3.82±1.11 cm length and 1.53±0.51 cm width. The average thickness of the gall bladder wall was 0.11±0.02 cm (Table 2).
Computed tomographic scans
Rumen: The dorsal ruminal sac appeared medium density in its ventral part due to the presence of ingesta and low density in its upper part due to the presence of the gases (Fig. 6b). With scanning sequences; the dorsal ruminal sac appeared between the spleen to the left and omasum and liver to the right.
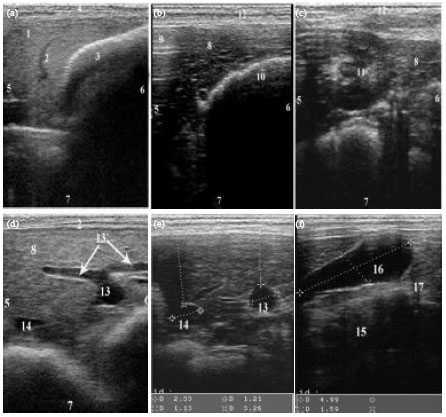 | |
| Fig. 5(a-f): | Sonogram of the spleen, liver, portal vein, caudal vena cava and gall bladder, (a) Sonogram of normal spleen texture, splenic vessels and the rumen (at the left 11th intercostal space), (b) Sonogram of normal liver, lung and reticulum (at the right 7th intercostal space), (c) Sonogram of normal liver and the right kidney (at the right 12th intercostal space), (d) Sonogram of the portal vein and caudal vena cava (at the right 12th intercostal space), (e) Sonogram showing the diameter and depth of the portal vein and caudal vena cava (at the right 12th intercostal space), (f) Sonogram showing the length and width of the gall bladder (at the ventral half of right 10th intercostal space), 1: Spleen, 2: Splenic vessels, 3: Rumen, 4: Left abdominal wall, 5: Dorsal side, 6: Ventral side, 7: Medial side, 8: Liver, 9: Right lung, 10: Reticulum, 11: Right kidney, 12: Right abdominal wall, 13: Portal vein with its branches, 13: Portal vein branches, 14: Caudal vena cava, 15: Omasum, 16: Gall bladder and 17: Small intestine |
| Table 1: | Ultrasonographic measurements of the caudal vena cava and portal vein at 9th, 10th, 11th and 12th intercostal spaces (ICS) |
 | |
| Values expressed in Means±SD | |
| Table 2: | Ultrasonographic measurements of the gall bladder |
 | |
| Values expressed in Means±SD | |
Whatever the ventral ruminal sac was medium density filled with ingesta (Fig. 6b-i). The right and left longitudinal pillars were detected (Fig. 6e) and the caudal transverse pillars clearly demonstrated (Fig. 6f). The caudodorsal blind sac detected at the level of 5th lumbar vertebrae, while the caudoventral blind sac demonstrated in the left side of abdomen at the level of pelvic inlet (Fig. 6f).
Reticulum: The reticulum appeared an oval medium density structure (Fig. 6a).
Omasum: The omasum detected low density circular or bean shape structure dorsomedial to the abomasum between the dorsal ruminal sac and liver (Fig. 6). The omasal lamina demonstrated obviously in lung window (Fig. 6i).
Abomasum: The abomasum appeared a hypo density mass ventromedial to the dorsal ruminal sac on the right side of ventral abdominal wall (Fig. 6d-h).
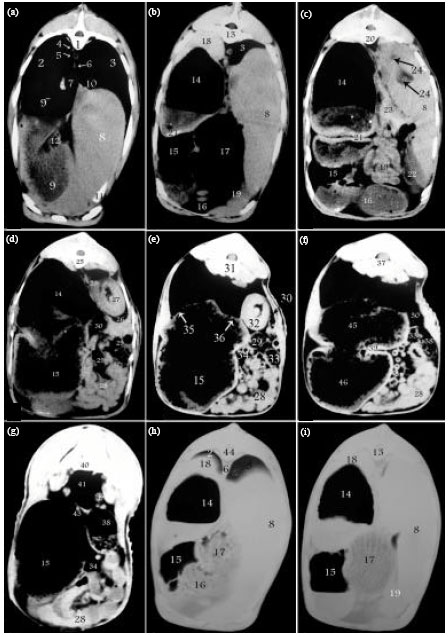 | |
| Fig. 6(a-i): | CT images of the goat abdomen showing the stomach parts, liver, spleen, intestine and pancreas, 1: 8th thoracic vertebra, 2: Left caudal lobe of the lung, 3: Right caudal lobe of the lung, 4: Left vena azygos, 5: Aorta, 6: Diaphragm, 7: Esophagus, 8: Liver, 9: Reticulum, 9': Reticulum filled with gases, 10: Caudal vena cava, 11: Right costal arch, 12: Reticular groove, 13: 10th thoracic vertebrae, 14: Dorsal ruminal sac, 15: Ventral ruminal sac, 16: Abomasum, 17: Omasum, 18: Spleen, 19: Pyloric part, 20: 13th thoracic vertebra, 21: Cranial transverse pillar, 22: Gall bladder, 23: Pancreas, 24: Portal vein, 24`: Hepatic vein, 25: 1st lumbar vertebrae, 26: Duodenum, 27: Right kidney, 28: Jejunum, 29: Distal loop of the ascending colon, 30: Descending colon, 31: 2nd lumbar vertebra, 32: Left kidney, 33: Proximal loop of the ascending colon, 34: Spiral colon, 35: Left longitudinal pillar, 36: Right longitudinal pillar, 37: 4th lumbar vertebra, 38: Cecum, 39: Caudal transverse pillar, 40: Lumbosacral space, 41: Rectum, 42: Ovary, 43: Uterine horn, 44: 9th thoracic vertebra, 45: Caudodorsal blind sac and 46: Caudoventral blind sac |
Spleen: The spleen observed a homogenous soft tissue on the dorsal ruminal sac (Fig. 6b).
Liver: The liver appeared a triangular homogenous soft tissue in the right side of the abdominal cavity between the right abdominal wall and reticulum, with the caudal scans it identified between the dorsal ruminal sac, omasum and abomasum in left and the right lateral abdominal wall in right (Fig. 6a-c).
Gall bladder: The gall bladder appeared elongated pear shaped structure on the ventral part of the visceral surface of the liver. It had a homogenous lower density than the liver tissue (Fig. 6c).
Intestine: The small intestine appeared homogeneously hypo dense highly convoluted band adjacent to the ventral ruminal sac (Fig. 6d). The proximal loop of the ascending colon represented by u-shape structure and had not mucosa folds at the middle and upper thirds of the right side (Fig. 6e-f). The distal loop of the ascending colon appeared hypo dense and characterized by presence of consecutive constrictions representing the fecal pellets inside (Fig. 6d-e). The spiral loop of the ascending colon demonstrated by scattered small circles and some of them had folded mucosa (Fig. 6e-g). The descending colon located dorsolateral to the left kidney and with the caudal scans; it was detected near the medial plane and has characteristic folded mucosa (Fig. 6d-f).
Ultrasonography of fatty liver infiltration revealed hyperechoic hepatic parenchyma near the abdominal wall (bright pattern), round margins of liver, poor visualization of blood vessels and hepatic edge (vascular and edge blurring) in hyperechoic area in addition to echo weakness as the distance from the abdominal wall increased (deep attenuation or dark pattern) (Fig. 7a-d).
DISCUSSION
Contrast radiographic X-ray technique appeared helpful in demonstrating the various parts of the gastrointestinal tract depending on the degree of the barium sulfate contrast material utility (Abu zaid, 1995). Whatever the ultrasonographic imaging considered the most valuable modern imaging techniques was used for evaluation of the abdominal cavity and its organs including; liver, biliary system, pancreas, stomach, small intestine and kidney (Cruz-Arambulo and Wrigley, 2003).
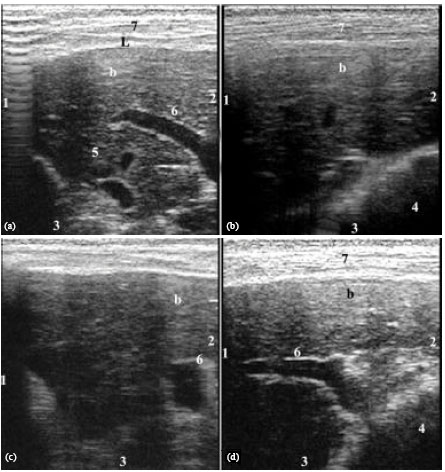 | |
| Fig. 7(a-d): | Sonogram of the liver showing fatty infiltration (a-d) represented by hyperechoic area (b), (a) Sonogram of the liver at the ventral part of right 10th intercostal space, Note the margin of liver is rounded (L), (b) Sonogram of the liver at the ventral part of right 10th intercostal space, Note blurring of hepatic vessels and edge and (c-d) Sonogram of the liver at the ventral part of right 11th intercostal space, 1: Dorsal side, 2: Ventral side, 3: Medial side, 4: Omasum, 5: Caudal vena cava, 6: Portal vein with its branches and 7: Right abdominal wall |
While the CT scans is a cross sectional image modality that provided unique and diagnostic information in which radiography or diagnostic ultrasonography unrewarded without contrast materials (Hathcock and Stickle, 1993).
The rumen appeared completely in the lateral and ventrolateral X-ray radiograph with contrast media after 1 h from administration of barium sulphate, it extended from the 8th rib cranially to the junction between the 6th lumbar vertebra and sacrum caudally and from the vertebral column dorsally to the abdominal floor ventrally. These result on line with Cegarra and Lewis (1977) and Sharma et al. (1984) in goat. The reticulum appeared in lateral abdominal radiographs with contrast media as piriform radiographic structure and located just behind the diaphragm from the 6th to the 8th intercostal space and ventrally it touched the abdominal floor in the xiphoid region, these results similar to obtained by (Abu zaid, 1995) in goat. In the lateral radiograph with contrast media, the omasum identified after 10 min from barium administration as bean structure extended from the 8th to the 10th rib while in the ventrodorsal view, it appeared as oval shape organ was extended between the 8th or the 9th to the 12th interchondral space similar result obtained by Abu zaid (1995) in goat. In the lateral radiograph the abomasum fundus appeared after 20 min, while in the ventrodorsal radiograph the abomasum appeared in the right side of abdominal cavity, similar results observed by Cegarra and Lewis (1977) in goat. The small intestine had a contrast material after one to three hrs after barium administration. In the lateral radiographs, it was not appeared in the area covered by the rumen but only detected just behind it as convoluted radiolucent bands, similar results observed by Cegarra and Lewis (1977) and Abu zaid (1995) in goat. The cecum appeared after 3.5 to 4 h from barium administration, after 6 h in the lateral radiograph, the cecum appeared as cylindrical radiographic structure under the 4th lumbar vertebrae until the pelvic inlet, while in the ventrolateral view it appeared in the right side of the abdominal cavity, these results detected in line with Abu zaid (1995) in goat. The barium appeared in the proximal part of ascending colon after 4 h. However, the complete filling appeared after 6.5 h. The contrast media observed in the spiral colon after 8h, the spiral loop was not clearly demonstrated to the superimposition of cecum and rumen and overlapping of its loops over each other, while the descending colon identified by its contents of the fecal pellet that covered by barium after 9 h, similar results obtained by Abu zaid (1995) in goat.
Ultrasonography examined the rumen, reticulum and omasum, whatever the contents of these parts could not be visualized because of their gaseous nature, four biphasic contractions of reticulum were observed during a 4 min period, these results agreed with that reported in cattle by Kaske et al. (1994); Braun and Marmier (1995); Braun et al. (1997) and Braun (2003). The abomasum examined at the ventral midline caudal to xiphoid process right and left to the thorax. The abomasum wall appeared thin echogenic line and its contents appeared a heterogenous moderately echogenic structure with echogenic stippling, these results agreed with that observed in cattle by Braun et al. (1997) and Braun (2003). The spleen was seen ultrasonographically between the rumen and left abdominal wall, its parenchyma appeared numerous weak echoes homogenously distributed, its capsule appeared as a fine echogenic line. The spleen vessels appeared as anechoic round to oval structures, these results agreed with that observed in cattle by Braun (2003) and Braun and Sicher (2006). The liver was imaged effectively at the 9th to the 11th right intercostal spaces. Only a small portion of the liver was seen in the 8th intercostal spaces because of the position of the lung, these results agreed with that seen in sheep by Braun and Hausammann (1992). The normal hepatic ultrasonography showed numerous weak echoes homogenously distributed over the entire area of the liver that appeared more echogenic than the cortex of the kidney and a comparatively less echogenic than the spleen, this result agreed with that reported by Braun (1990), Braun and Hausammann (1992) and Abu zaid (1995). The caudal vena cava appeared anechoic triangular area, its wall appeared while the main portal vein appeared as anechoic circular lumen surrounded by echogenic wall and characterized by star shaped-ramifications into the liver tissue, this result agreed with that reported in goat by Yamaga and Too (1984) and Abu zaid (1995) and in cattle by Braun et al. (1996) and in sheep by Braun and Hausammann (1992). The diameter and depth of the caudal vena cava noticed greater than that of the portal vein and they decreased from the 9th to the 12th intercostal spaces, these results were similar to that recorded in sheep by Braun and Hausammann (1992) and disagreed with that recorded in cattle by Braun (1990) whose recorded that the diameter of the portal vein detected bigger than that of the caudal vena cava. The gall bladder scanned ultrasonographically between the hepatic parenchyma dorsally and the small intestine wall ventrally in the right side of the abdominal cavity deep to the costal arch, these results agreed with that reported in sheep by Braun and Hausammann (1992) and in goat by Yamaga and Too (1984) and Abu zaid (1995).
CT imaging identified clearly the various parts of the gastrointestinal tract including the four compartments of the stomach, small and large intestine and rectum without using contrast materials, where the position and grooves of the ruminal sacs identified with the sequential CT scanning, the ruminal papilla was not demonstrated, the shape and configuration of the stomach was extremely variable according to the scanning sequences where the dorsal ruminal sac scanned first after reticulum and the ventral ruminal sac scanned lastly near the pelvic inlet as that confirmed by radiographic imaging by Dyce et al. (1987) and Abu zaid (1995). The omasum was clearly identified between the liver and rumen by its characteristic omasal lamina as the result of alternative hypodense lamina and dense free gas lines. The walls of rumen and omasum were clearly demonstrated with fine irregularity as a result of ruminal papillae and omasal lamina, whatever the abomasum identified with its spiral mucosal folds, these observations appeared in a line with the anatomic and radiographic findings of Abu zaid (1995), El-Gendy and Derbalah (2010).
The small intestine CT scans was differentiated by its homogenous density from ascending colon, cecum and spiral colon constriction representing fecal pellets. On CT scans the liver and spleen were demonstrated as homogenous soft tissue density, the large portal vein, hepatic vein, caudal vena cava and gall bladder were demonstrated as hypodense than hepatic tissue, these results appeared similar with that recorded by Dyce et al. (1987), Abu zaid (1995) and Sandrasegaran et al. (2007).
Goats of fatty liver suffered from decrease in body weight as was previously observed in cattle by Mohamed et al. (2004) in similar conditions. Regarding to ultrasonographic appearance; Ultrasonogram of liver revealed hyperechoic area near the abdominal wall, poor visualization of hepatic vessels, round margin and lower deep attenuation. This result agrees with the image described in cattle by Acorda et al. (1994), Braun et al. (1996) and Ibrahim (2004) and attributed to deposition of fat in hepatocytes which characterized by high echogenicity due to its lower acoustic impedance in contrast to that of normal liver tissue (Sanders and Everette, 1980; Ibrahim, 2004).
CONCLUSION
The present study demonstrated the ruminal details as well as small and large intestine by CT scans that indicate the CT could be effectively used to evaluate the gastrointestinal tract and soft tissues changes. The obtained results cleared that contrast X-ray images, ultrasonography and CT scans were safe, practical and easily performed in goat. Both radiographic and ultrasonographic procedures were complimentary in the evaluation of the gastrointestinal tract, spleen and liver condition while CT scans was a superior for soft tissue differentiation over conventional X-ray techniques.
REFERENCES
- Acorda, J.A., H. Yamada and S.M. Ghamsari, 1994. Ultrasonographic features of diffuse hepatocellular disorders in dairy cattle. Vet. Radiol. Ultrasound, 35: 196-200.
CrossRefDirect Link - Alsafy, M.A.M., 2008. Computed tomography and cross-sectional anatomy of the thorax of goat. Small Rumin. Res., 79: 158-166.
CrossRef - Athar, H., J. Mohindroo, K. Singh, A. Kumar and M. Raghunath, 2010. Comparison of radiography and ultrasonography for diagnosis of diaphragmatic hernia in bovines. Vet. Med. Int., Vol. 2010.
CrossRef - Braun, U., 1990. Ultrasonographic examination of the liver in cows. Am. J. Vet. Res., 51: 1522-1526.
PubMedDirect Link - Braun, U., 2003. Ultrasonography in gastrointestinal diseases in cattle. Vet. J., 166: 112-124.
PubMed - Braun, U. and K. Hausammann, 1992. Ultrasonographic examination of the liver in sheep. Am. J. Vet. Res., 53: 198-202.
PubMed - Braun, U. and O. Marmier, 1995. Ultrasonographic examination of the small intestine of cows. Vet. Record, 136: 239-244.
CrossRef - Braun, U. and D. Sicher, 2006. Ultrasonography of the spleen in 50 healthy cows. Vet. J., 171: 513-518.
CrossRef - Braun, U., K. Wild and F. Guscetti, 1997. Ultrasonographic examination of the abomasum in 50 cows. Vet. Record., 140: 93-98.
CrossRef - Cegarra, I.J. and R.E. Lewis, 1977. Contrast study of the gastro intestinal tract in the goat (Capria hircus). Am. J. Vet. Res., 38: 1121-1128.
PubMed - Cruz-Arambulo, R. and R. Wrigley, 2003. Ultrasonography of the acute abdomen. Clin.Tech. Small Anim. Pract., 18: 20-31.
Direct Link - El-Gendy, S.A.A. and A. Derbalah, 2010. Macroscopic and microscopic anatomy of the omasum of the baladi goat. J. Biol. Sci., 10: 596-607.
CrossRef - El-Kammar, M.H., M.A.M. Alsafy, M.I. Mohammed and M.S. EL-Neweshy, 2012. Ureteric obstruction and hydronephrosis in baladi goats: Topographical anatomy, ultrasonographical, hematological and pathological findings. Small Rumin. Res., 104: 169-178.
CrossRef - Goh, V., S. Halligan, J.M. Anderson, J. Hugill and A. Leonard, 2005. Is direct radiologist supervision of abdominal Computed Tomography (CT) scans necessary? Clin. Radiol., 60: 758-761.
CrossRef - Hathcock, J.T. and R.L. Stickle, 1993. Principles and concepts of computed tomography. Vet. Clin. North Am. Small Anim. Pract., 23: 399-415.
PubMedDirect Link - Kaske, M., A. Midasch and J. Rehage, 1994. Sonographic investigation of reticular contractions in healthy sheep, cows and goats and in cows with traumatic reticulo-peritonitis. J. Am. Vet. Med. Assoc., 41: 748-756.
PubMedDirect Link - Kofler, J. and K. Hittmair, 2006. Diagnostic ultrasonography in animal's continuation of the clinical examination? Vet. J., 171: 393-395.
CrossRef - Kumar, R., R.N. Kohli, B. Prasad, J. Singh and S.N. Sharma, 1980. Radiographic diagnosis of diaphragmatic hernia in cattle. Vet. Med. Small Anim. Clin., 73: 305-309.
PubMed - Rubesin, S.E., M.S. Levine and I. Laufer, 2008. Double-contrast upper gastrointestinal radiography: A Pattern approach for diseases of the stomach. Radiology, 246: 33-48.
Direct Link - Sharma, S.K., A.P. Singh, R. Tayal and I.S. Chandna, 1984. Contrast radiography of the ovine gastrointestinal tract. Vet. Radiol., 25: 17-22.
CrossRef - Singh, G.R., H.C. Setia, N.N. Pandey and I.V. Mogha, 1990. Cholecystography in goats. Indian J. Anim. Sci., 60: 766-768.
Direct Link - Saini, N.S., A. Kumar, S.K. Mahajan and A.C. Sood, 2007. The use of ultrasonography, radiography and surgery in the successful recovery from diaphragmatic hernia in a cow. Can. Vet. J., 48: 757-759.
Direct Link - Torkelson, J., 2002. Perirectal abscess, colic and dyschezia in a horse. Can. Vet. J., 43: 127-128.
Direct Link - Yamaga, Y. and K. Too, 1984. Diagnostic ultrasound imaging in domestic animals: Fundamental studies on abdominal organs and fetuses. Nihon Juigaku Zasshi, 46: 203-212.
PubMed