
G.P. Oyeyiola
Department of Microbiology, University of Ilorin, Ilorin
Research Journal of Microbiology
Year: 2010 | Volume: 5 | Issue: 2 | Page No.: 137-143


ABSTRACT
The bacteria present in the root zone of Amaranthus hybridus were isolated and identified. The bacteria were Bacillus subtilis, Bacillus megaterium, Aerococcus viridans, Bacillus cereus, Pseudomonas fluorescens, Pseudomonas putida, Agrobacterium radiobacter, Flavobacterium ferrugineum, Flavobacterium lutescens, Serratia marcescens, Micrococcus varians, Citrobacter freundii, Pediococcus pentosaceus and Staphylococcus saprophyticus. The predominant bacteria in the rhizosphere soil were Pseudomonas fluorescens, Bacillus subtilis and Bacillus megaterium. The predominant bacterias in the rhizoplane were Flavobacterium, ferrugineum, Flavobacterium lutescens and Bacillus subtilis. The predominant bacterias in the non-rhizosphere soil were Staphylococcus saprophyticus and Bacillus subtilis. The experimental soil was sandy loam in texture. There was a progressive increase in the rhizosphere effect with increase in plant age until the tenth week after seed sowing and subsequently there was a decline until the fourteenth week.
PDF Abstract XML References Citation
How to cite this article
G.P. Oyeyiola, 2010. Rhizosphere Bacterial Flora of Amaranthus hybridus. Research Journal of Microbiology, 5: 137-143.
URL: https://scialert.net/abstract/?doi=jm.2010.137.143
URL: https://scialert.net/abstract/?doi=jm.2010.137.143
INTRODUCTION
Rhizosphere is the soil immediately surrounding the plant roots (Oyeyiola and Hussain, 1991). The rhizosphere is not a uniform well-defined region, but a region with a microbial gradient extending from the root surface or rhizoplane; and the extent of this microbial gradient depends principally on the plant species (Brown, 1975; Yang and Crowkey, 2000; Morgan et al., 2005). The rhizosphere is a soil volume characterized by increased activities of microorganisms especially bacteria (Klemedtsson et al., 1987; Toal et al., 2000). Microbial proliferation in the rhizosphere and the rhizoplane occurs in response to the input of organic compounds exuded by roots (Liljeroth and Baath, 1988; Whipps, 2001; Barea et al., 2005).
The present study was carried out to determine the bacteria in the rhizosphere of Amaranthus hybridus which is a vegetable crop grown widely for consumption in Nigeria. The vegetable is consumed by millions of Nigerians as soup with various foods such as amala (made from yam flour), agidi (made from fermented corn) and eba (made from fermented cassava). This study was undertaken because it has been reported that microorganisms growing on the plant roots can influence plant growth positively or negatively; therefore the study of differences in microbial colonization among plant varieties may have practical implications (Liljeroth and Baath, 1988). Such practical implications may include effect on the productivity of a particular plant.
MATERIALS AND METHODS
Description of the Study Site and Procurement of Amaranthus hybridus Seeds
The study site was situated in the Biological Garden of University of Ilorin, Ilorin, Kwara State, Nigeria. The study was carried out from 10th June to 25th November, 2008.
The seeds used for this study were bought from an agricultural seed seller in Ilorin. The seeds were bought in already sealed sachet and taken to the laboratory unopened. The sachet was opened in a sterile atmosphere when the seeds were needed and kept, sealed with sellotape, in a locker at room temperature (25±3°C) when the seeds were not needed. The sachet was opened, each time, in a sterile atmosphere to prevent the introduction of foreign microorganisms onto the seeds.
Physical and Chemical Analysis of Soil Samples
Soil Texture Determination
The soil hydrometer method of Pramer and Schmidt (1964) was used for the determination of soil texture. Fifty grams of oven dried soil was put in a 1 L beaker. Then 200 mL of distilled water and 50 mL of disperson agent (80 g Na0H dissolved in 2 L of distilled water) were added. The suspension was stirred for 5 min and then transferred into a 1 L measuring cylinder; distilled water was used to rinse any part of the suspension left in the beaker into the measuring cylinder. Distilled water was used to make the suspension in the measuring cylinder to 1 L mark. The top of the cylinder was covered with the palm of one hand to firmly seal it completely. The cylinder was vigorously shaken by turning end-over several times to mix the suspension. The cylinder was placed on the bench and the time noted. The cylinder was allowed to stand for 30 sec and soil hydrometer was inserted gently into the soil suspension. The hydrometer was read after 10 sec of insertion. This gave the first hydrometer reading (H1). Then, the hydrometer was removed and a thermometer was inserted into the suspension. The temperature of the suspension was taken. This gave the first temperature reading (T1). The thermometer was removed. The suspension was allowed to stand for 2 h. Then the second hydrometer reading (H2) and the second temperature reading (T2) were taken. T1 and T2 were converted to degrees Fahrenheit (0F) and the following formulae were used to calculate % of sand, clay and silt.
| • | % sand = 100.0-( H1+ 0.2 ( T1- 68 )-2.0) 2 |
| • | % clay = (H2+ 0.2 (T2-68) – 2.0) 2 |
| • | % silt = 100.0 – (% sand + % clay) |
After calculating the percentages of sand, clay and silt in the soil, reference was made to appropriate textural triangle (Pramer and Schmidt, 1964; Olaitan and Lombin, 1984) to get the soil texture.
Soil Water Holding Capacity Determination
A circle of filter paper was cut to size and placed on the screen of a Hilgard cup. The filter paper was moistened with a jet of distilled water from a wash bottle; the unit was then weighed and the weight noted (xg). The cup was then filled 75% with oven dried soil and compacted by dropping the cup a few times from a height of 2.5 cm. The soil surface was leveled and the unit reweighed (yg). The cup was then placed in a 250 mL beaker containing water deep enough to wet the bottom of the soil column. Water got drawn through the soil by capillary action, until the soil became saturated. The cup was then removed and placed in a Petri dish lid for 2 min to allow excess water to drain off. The cup was then removed and weighed (zg). The water holding capacity was calculated using the formula below:
One gram of water is equivalent to 1 mL of water. The value, q mL g-1, is the water holding capacity of the soil.
Soil Moisture Content Determination
Five grams of freshly collected soil sample was dried to a constant weight in the oven at 105°C. The moisture content was calculated using the following formula:
Organic Matter Content Determination
A crucible was heated to redness in the furnace, maintained at red hot for ten minutes and then placed in a desiccator to cool and weighed. Five grams of oven dried soil was put in the crucible and the total weight noted. The crucible and soil were heated in the furnace at 550°C for 24 h. The crucible containing the heated soil was removed, cooled in the desiccator and reweighed. The heating in the furnace, cooling in the desiccator and reweighing were repeated until a constant weight was obtained. The organic matter content was calculated using the following formula:
Soil pH Determination
Twenty grams of soil sample was put in a beaker and 20 mL of distilled water added. The suspension was left for 30 min with occasional stirring, to enable it reach equilibrium. The pH of the suspension was then taken with a pH meter Corning Model 440, equipped with a glass electrode.
Isolation, Preservation and Identification of Bacteria
Rhizosphere soil, non-rhizosphere soil and plant root samples were collected and serial (decimal) dilutions were prepared from them following standard methods (Odunfa and Oso, 1979; Akinyanju and Fadayomi, 1989; Oyeyiola and Hussain, 1991, 1992) using fresh samples in all cases.
One gram of rhizosphere soil sample, non-rhizosphere soil sample or 5 mm pieces of roots was put in a sterile test tube or a sterile boiling tube (for pieces of roots) and 9 mL of sterile distilled water was added. This was further diluted serially. One millilitre of a desired dilution was removed for the isolation of bacteria using the spread plate method. Each plate was incubated at 37°C. Nutrient Agar (NA) was used. Colony counts and subculturing were carried out after 24 h. Representative colonies were taken for purification and stock cultures were prepared on NA slants in McCartney bottles. Stock cultures were preserved in the refrigerator. Identification of isolates was done by making reference to appropriate publication (Buchaman and Gibbons, 1974) after determining their colonial, morphological and biochemical characteristics.
Determination of Rhizosphere Effect
The ratio of the number of bacteria in the rhizosphere soil and non- rhizosphere soil (R/S ratio) was calculated using the formula:
RESULTS AND DISCUSSION
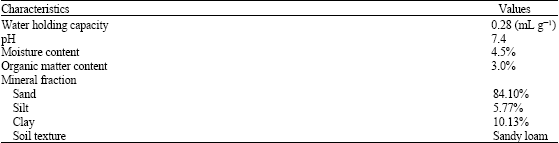
The experimental soil had a pH of 7.4 and sandy loam texture prior to seed sowing (Table 1). There were fluctuations in the pH and moisture content of the non-rhizosphere soil without any definite pattern as the plants aged (Table 2). However, the organic matter content increased progressively as the plants aged (Table 2). For the rhizosphere soil (Table 2), the moisture content, water holding capacity and organic matter content increased progressively as the plant aged, while the pH decreased. The amounts of organic matter were higher in the rhizosphere soil than non-rhizosphere soil (Table 2).
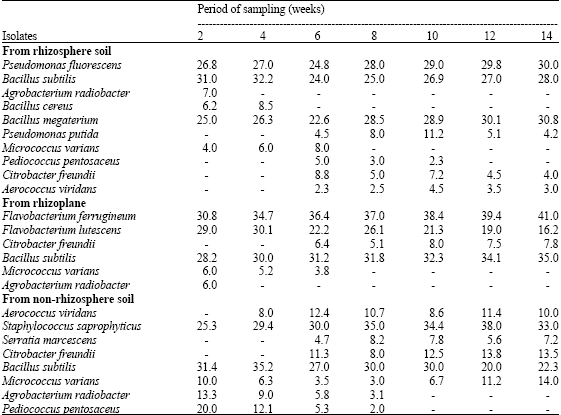
More bacteria occurred, qualitatively, in the rhizosphere soil than the rhizoplane or the non-rhizosphere soil (Table 3). Pseudomonas fluorescens, Bacillus cereus, Bacillus megaterium and Pseudomonas putida were present in the rhizosphere soil but absent from the rihzoplane and non-rhizosphere soil. However, the non-rhizosphere soil also contained more bacteria, qualitatively, than the rhizoplane. There was consistency in the patterns of numbers of bacteria in the rhizosphere soil, rhizoplane and non-rhizosphere soil. Throughout the experimental period the rhizosphere soil had the highest numbers of bacteria, followed by the rhizoplane and lastly by the non-rhizosphere soil (Fig. 1). Moreover, the numbers of bacteria in both the rhizosphere soil and the rhizoplane increased progressively from the second week after seed sowing to the tenth week and subsequently declined progressively till the end of the experimental period in the fourteenth week. Such clear pattern in the numbers of bacteria did not occur in the non-rhizosphere soil. The R/S ratios increased progressively with increase in plant age until the tenth week after seed sowing and then declined progressively until the fourteenth week (Fig. 2).
The pH and texture of the experimental soil were found to be favorable for the growth of Amaranthus hybridus because the plant grew well and healthy.
This could be because the ideal soil for most plants is slightly acid to neutral (Kellogg, 1998) and sandy loam soil has been found to be favorable for the growth of okro (Hartman et al., 1988), which is also a vegetable crop like Amarnthus hybridus. The progressive decrease in the pH of the rhizosphere soil as the plants grew could be attributed to the presence of root exudates.
| Table 1: | Physical and chemical characteristics of the experimental soil (prior to sowing of seeds) |
 | |
| Table 2: | Physical and chemical characteristics of non-rhizosphere soil and rhizosphere soil as the plants aged |
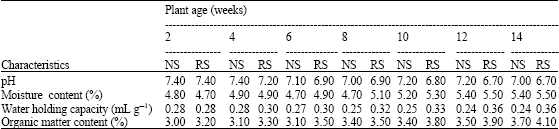 | |
NS: Non-rhizosphere soil; RS: Rhizosphere soil | |
| Table 3: | Frequency of occurrence of bacteria in the rhizosphere soil and rhizoplane of Amaranthus hybridus and the non-rhizosphere soil |
 | |
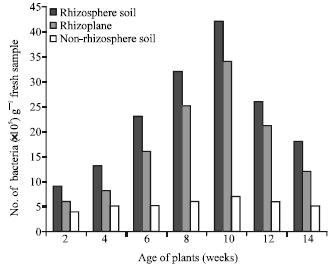 | |
| Fig. 1: | Number of bacteria per gram fresh sample of the rhizosphere soil, rhizoplane and non-rhizosphere soil as the plants aged |
The amount of exudates normally increases as a plant grows actively. The greater amounts of organic matter in the rhizosphere soil than non-rhizosphere soil could also be attributed to the presence of exudates and dead root cells in the former, as well as greater proliferation of micro-organisms in the former.
The occurrence of more bacteria, qualitatively in the rhizosphere soil could be because it is an area of intense microbial activity where a general increase in microorganisms is always noted, as a rule (Morgan et al., 2005), although the community structure and functional consequences of the increase are not well understood.
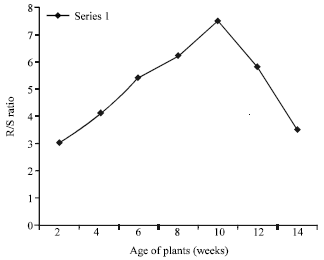 | |
| Fig. 2: | Variation in the ratio of the number of bacteria isolated from rhizosphere soil and non-rhizosphere soil as the plants aged |
It has also been reported that plant rhizosphere is a dynamic environment in which many factors affect the microbial structure and species composition (Barea et al., 2005). Pseudomonas and Bacillus have been reported by Barea et al. (2005) to be the genera most commonly described as having plant growth promoting activity-this means that there are plant growth promoting species in the two genera which are usually present in the rhizosphere. Moreover, Pseudomonads have been traditionally considered to be important rhizosphere organisms (Morgan et al., 2005). The higher numbers of bacteria in the rhizosphere soil than the non-rhizosphere soil could be because microorganisms in the rhizosphere soil react to the many metabolites released by plant roots (Morgan et al., 2005); such metabolites serve as sources of nutrients for growth of bacteria (Oyeyiola, 1992). However, the greater numbers of bacteria in the rhizosphere soil than the rhizoplane could be attributed to the rhizoplane being made a specialized surface by the selective nature of the root exudates (Odunfa, 1979; Abdel-Hafez, 1982; Yang and Crowkey, 2000). Also, microbial communities associated with the rhizosphere vary according to the plant species, the soil type and cultural practices (Yang and Crowkey, 2000). The R/S ratio is a reflection of how the number of rhizosphere microorganisms compares with the number of non-rhizosphere microorganisms.
A progressive increase in the number of rhizosphere microorganisms and the R/S ratios up to a particular plants age, with a subsequent fall has been reported by Rovira (1965), Abdel-Rahim et al. (1983) and Oyeyiola (1992, 2002).
REFERENCES
- Abdel-Hafez, S.I.I., 1982. Rhizosphere and rhizoplane fungi of Triticum vulgare cultivated in Saudi Arabia. Mycopathologia, 78: 79-86.
CrossRefDirect Link - Abdel-Rahim, A.M., A.M. Baghadami and M.H. Abdalla, 1983. Studies on the fungus flora in the rhizosphere of sugar cane plants. Mycopathologia, 81: 183-186.
CrossRefDirect Link - Akinyanju, J.A. and O. Fadayomi, 1989. Effect of diuron on sugarcane rhizosphere microbial populations. Nig. J. Bot., 2: 49-58.
Direct Link - Barea, J.M., M.J. Pozo, R. Azcon and C. Azcon-Aguilar, 2005. Microbial co-operation in the rhizosphere. J. Exp. Bot., 56: 1761-1778.
CrossRefDirect Link - Klemedtsson, L., P. Berg, M. Clarholm, J. Schnurer and T. Rosswall, 1987. Microbial nitrogen transformations in the root environment of barley. Soil Biol. Biochem., 19: 551-558.
Direct Link - Liljeroth, E. and E. Baath, 1988. Bacteria and fungi on roots different barley varieties (Hordeum vulgare L.). Biol. Fertil. Soil, 7: 53-57.
CrossRefDirect Link - Morgan, J.A.W., G.D. Bending and P.J. White, 2005. Biological costs and benefits to plant-microbe interactions in the rhizosphere. J. Exp. Bot., 56: 1729-1739.
CrossRefDirect Link - Odunfa, V.S.A. and B.A. Oso, 1979. Fungal populations in the rhizosphere and rhizoplane of cowpea. Trans. Br. Mycol. Soc., 73: 21-26.
CrossRef - Rovira, A.D., 1965. Interactions between plant roots and soil microorganisms. Ann. Rev. Microbiol., 19: 241-266.
CrossRefDirect Link - Toal, M.E., C. Yeomans, K. Killlham and A.A. Meharg, 2000. A review of rhizosphere carbon flow modeling. Plant Soil, 222: 263-281.
CrossRefDirect Link - Yang, C.H. and D.E. Crowkey, 2000. Rhizosphere microbial community structure in relation to root location and plant iron nutritional status. Applied Environ. Microbiol., 66: 345-351.
Direct Link - Whipps, J.M., 2001. Microbial interactions and biocontrol in the rhizosphere. J. Exp. Bot., 52: 487-511.
PubMedDirect Link