
N.Z. Zulikha
Department of Biology, Faculty of Science, Universiti Putra Malaysia, 43400 Serdang, Selangor, Malaysia
F.M. Yusoff
Department of Aquaculture, Faculty of Agriculture, Universiti Putra Malaysia, 43400 Serdang, Selangor, Malaysia
J. Nishikawa
Atmosphere and Ocean Research Institute, The University of Tokyo, 5-1-5 Kashiwanoha, Kashiwa, Chiba 277-8564, Japan
A. Arshad
Department of Aquaculture, Faculty of Agriculture, Universiti Putra Malaysia, 43400 Serdang, Selangor, Malaysia
H.M. Matias-Peralta
Department of Science and Mathematics, Faculty of Science, Technology and Human Development, Universiti Tun Hussein Onn Malaysia, 86400 Parit Raja, Batu Pahat, Johor, Malaysia
Journal of Fisheries and Aquatic Science
Year: 2013 | Volume: 8 | Issue: 3 | Page No.: 430-440


ABSTRACT
The study was undertaken to determine zooplankton composition and abundance along Perak River estuarine system during the Northeast (NE) monsoon. Monthly samplings were conducted from November 2009 until February 2010. Four sampling stations were selected along the salinity gradient covering stations from the upstream down to 1 km off the coastal sea area. The zooplankton samples were collected by vertical tows using conical plankton net (100 μm mesh size). Throughout the monsoon season, a total of 11 higher taxa of zooplankton groups were recognized, of which copepods were the dominant group comprising 96% (including nauplii and copepodites) 95 and 99% of the total zooplankton abundance in the marine, estuarine and upstream station, respectively. Seventeen species of copepods from 10 genera were identified. Total zooplankton abundances recorded during the sampling period were 45.5±18.9x10³, 34.9±25.9x10³ and 45.9±30.5x10³ individual m-3 in the upstream, estuarine and marine station, respectively. Multidimensional Scaling (MDS) analysis based on zooplankton abundance revealed three distinct groups separating the upstream from the estuarine and marine stations. Similarly, lower diversity index was recorded in the estuarine station (H’ = 2.04±0.28) compared to marine area (H’ = 2.20±0.26), suggesting that less copepod species were tolerant to the drastic changes of the estuarine environment. Low copepod densities were recorded in the beginning of the monsoon season, but progressively increased with a peak in the middle of the monsoon season. The results demonstrated that the Perak estuary was a turbid environment with drastic changes in salinity levels due to high inflow of freshwater during the monsoon season which affect the distribution of the zooplankton populations.
PDF Abstract XML References Citation
Received: September 19, 2012;
Accepted: September 28, 2012;
Published: February 09, 2013
How to cite this article
N.Z. Zulikha, F.M. Yusoff, J. Nishikawa, A. Arshad and H.M. Matias-Peralta, 2013. Mesozooplankton Composition and Abundance in a Tropical Estuary During Monsoon Season. Journal of Fisheries and Aquatic Science, 8: 430-440.
DOI: 10.3923/jfas.2013.430.440
URL: https://scialert.net/abstract/?doi=jfas.2013.430.440
DOI: 10.3923/jfas.2013.430.440
URL: https://scialert.net/abstract/?doi=jfas.2013.430.440
INTRODUCTION
Perak river is the second longest river in Peninsular Malaysia after Pahang river with an approximate length of 400 km (Yusoff et al., 2006). The river system originates from Titiwangsa range from the North which flows and drains into the Straits of Malacca at Bagan Datoh village (3°59’N-100°46’E). Due to its large watershed (14,700 km2), the upstream of the Perak river provides a large volume of freshwater input into the riverine system which results in the wide range of salinity variations in its estuary and the associated coastal sea. Perak estuary has been known as an important fishing site for the jellyfish, Acromitus hardenbergi which is one of the most important fishery products in the area (Nishikawa et al., 2008; Yusoff et al., 2010).
In an ecotone, such as an estuary ecosystem, zooplankton composition is strongly determined by the environmental factors. According to Rezai et al. (2005), salinity was one of the main factors that determine the composition of zooplankton in that particular area. Zooplankton community structure is influenced by salinities and water circulation and there are many species which are tolerant to drastic salinity fluctuations in the estuaries. Northeast (NE) monsoon is one of two main monsoon seasons that characterised the weather in Malaysia. Northeast monsoon usually brings heavy rainfall from November until early March (Yoshida et al., 2006). This wet season becomes important as there will be more water input into the estuarine systems and will be a main dilution factor to this transition zone between the river and the sea. This study therefore was conducted to evaluate the influence of salinity fluctuations during the NE monsoon on zooplankton abundance and community structure in Perak river.
MATERIALS AND METHODS
Four sampling stations were allocated in Perak estuary based on salinity distribution during high tide (Fig. 1). Station 1 was located 1 km away from the river mouth, two stations (Stations 2 and 3) in the estuary and Station 4 was in the upstream. Since there were no significant differences between Stations 2 and 3, they were pooled together to represent the estuarine area.
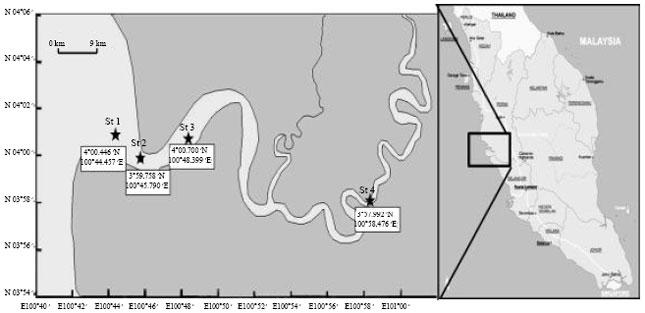 | |
| Fig. 1: | Map of the sampling location in Perak river showing the sampling stations |
The monthly samplings were carried out during the NE Monsoon starting from November 2009 until February 2010. Environmental parameters such as salinity, temperature, dissolved oxygen, pH and turbidity at each station were investigated using the Hydrolab multiparameter probe (Surveyor DS4). Water samples were taken using Niskin bottle and the concentrations of total ammonium nitrogen (TAN) and nitrite and nitrate (NO2+NO3) were measured according to the methods described by Kitamura et al. (1982). Soluble reactive phosphorus (SRP) concentrations were also measured using the spectrophotometric methods described by Parsons et al. (1984). Zooplankton samples were obtained by vertical hauling of conical plankton net (0.3 m mouth diameter, 100 μm mesh size) from the deepest depth of each station (1 m above the bottom) to the surface. Three replicates were taken for each station. The samples were immediately fixed with 4-5% buffered-formalin/seawater solution just after collection.
The zooplankton samples were then transferred to the laboratory for identification and enumeration. A 10 mL subsample was splitted from an original sample and examined using the Bogorov counting chamber under dissecting microscope. Zooplankton were identified to the lowest possible taxa and further identification to species were made to copepods, the most dominant taxa. Number of each taxon of zooplankton was counted and numerical density was expressed as individuals m-3.
Non-metric Multidimensional Scaling (MDS) was applied to examine the zooplankton community structure using the software package, PRIMER (ver. 6.1.9, PRIMER-E Ltd). Statistical test between parameter factors and zooplankton assemblage were analyzed using Analysis of Variance (ANOVA). Shannon-Wiener diversity index (H’) was used to evaluate the species diversity of dominant zooplankton using the software package, SPSS Statistics (version 17.0, IBM).
RESULTS
Water temperature in the study area varied from 27.7 to 31.7°C throughout the sampling season in all the sampling stations (Table 1). However, mean temperature values were similar at all stations, 29.72±1.01, 29.58±0.8 and 29.66±1.02°C for the upstream, estuarine and marine stations, respectively.
| Table 1: | Physicochemical parameters in the different sampling stations in Perak river during northeast monsoon 2009-2010 |
 | |
| DO: Dissolved oxygen, TDS: Total dissolved solid, TAN: Total ammonia nitrogen, SRP: Soluble reactive phosphorus, NTU: Nephelometric turbidity unit, Ranges are given in the parenthesis | |
 | |
| Fig. 2: | Rainfall data for Perak river during February 2009 until May 2010 |
Likewise, dissolved oxygen showed only a little variation throughout the sampling months at all stations (Table 1). However, there were significant differences (ANOVA: p<0.05) in dissolved oxygen between stations. The highest dissolved oxygen was recorded in the upstream station (5.45±0.03 mg L-1) followed by marine station (4.8±0.3 mg L-1) and the lowest was recorded in estuarine station (4.25±0.38 mg L-1). In addition, a wide range of salinity variation was observed in both the estuarine and marine stations. In the estuarine stations, the salinity varied from 1.2 to 20.6 ppt, whereas, in the marine station, salinity ranged from 14.80 to 25.39 ppt (Table 1). On the other hand, relatively constant salinities were observed in the upstream station ranging from 0.00 to 0.02 ppt. Highest turbidity levels were recorded in estuarine station compared to other stations with the turbidity readings ranging from 10.3 to >1000 NTU (mean turbidity = 505.2±247.5 NTU). This was followed by the upstream station (50.75±20.4 NTU), while the lowest turbidity reading was recorded in the marine station (0.3±0.05 NTU). Monthly total rainfall recorded for Perak river varied from 23.4 mm to 311.9 mm (Fig. 2) with the highest rainfall recorded in November 2009 (311.9 mm) and decreased towards the inter-monsoon season.
Nutrient concentrations during the study period did not show significant variations (ANOVA: p>0.1) amongst all the sampling stations (Table 1). Overall, marine station showed the lowest concentration of total ammonia nitrogen, TAN (0.02±0.01 mg L-1) and nitrite and nitrate, NO2+NO3 (0.03±0.01 mg L-1) followed by the estuarine stations (0.03±0.01 and 0.11±0.05 mg L-1 for TAN and NO2+NO3, respectively) and the highest in the upstream stations (0.04±0.01 and 0.23±0.04 mg L-1 for TAN and NO2+NO3, respectively). On the other hand, the estuarine station showed the lowest concentration in soluble reactive phosphorus, SRP (0.02±0.00 mg L-1) followed by the estuarine stations and the highest in the marine station (0.03±0.01 mg L-1).
Total zooplankton abundance fluctuated throughout the monsoon season with the peak appearing in the middle of the monsoon. Eleven groups of zooplankton were found from the Perak river estuary. Among them, copepods (including nauplii and copepodites) were the most numerically dominant group throughout the sampling period, contributing 96% of the total zooplankton abundance on average. Copepods also dominated zooplankton count in all sampling stations with the percentage of 98.5, 94.7 and 96.0% in the upstream, estuarine and marine stations, respectively (Fig. 3). Cirripedia was the second most abundant group, contributing only 1.5% of the total zooplankton abundances and the remaining percentage of less than 1% were contributed by other zooplankton groups (Fig. 3). Among the copepods (Fig. 4), calanoids were the most abundant (36.2% of total), followed by cyclopoids (33.3%), harpacticoids (28.6%) and poecilostomatoids (2.0%).
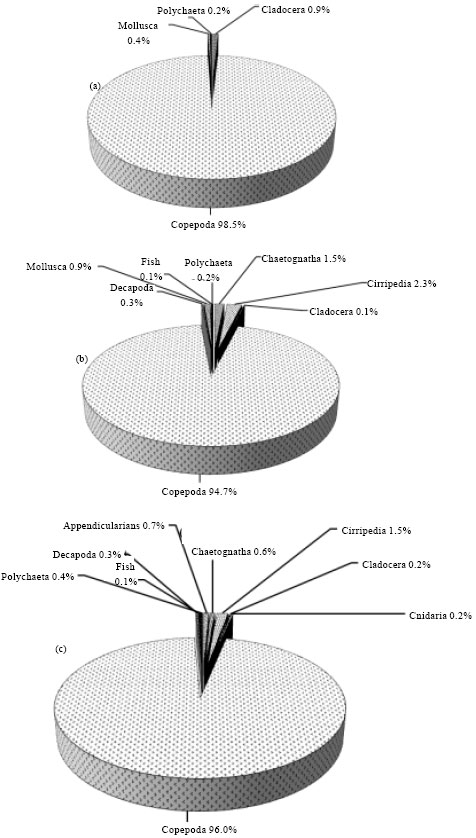 | |
| Fig. 3(a-c): | Percentages of zooplankton groups in (a) Upstream, (b) Estuarine and (c) Marine stations of Perak river, during northeast monsoon season |
| Table 2: | Density (individuals m-3) of copepods at different sampling stations in Perak river during the monsoon season 2009-2010 |
 | |
 | |
| Fig. 4: | Percentage of copepods during northeast monsoon season in Perak river, Malaysia |
In upstream station, copepod community was dominated by Oithona aruensis (77.5%) and Hemicyclops sp. (22.1%). On the other hand, estuarine station was dominated by Microsetella norvegica which contributed 19.6% of total copepods count (Table 2), followed by Parvocalanus crassirostris (18.7%) and Oithona aruensis (15.8%). Similarly, marine station was also dominated by Microsetella norvegica (33.1%), followed by Oithona simplex (30.6%) and Euterpina acutifrons (14.7%).
The highest mean density of 45.94x10³±30.52x10³ individuals m-3 was recorded in the marine station (Fig. 5), while the lowest was recorded in the estuarine station at 34.88x10³±25.85x10³ individuals/m3. However, there was no significant difference (p>0.05) in terms of zooplankton density in all stations.
 | |
| Fig. 5: | Zooplankton density and salinity in different sampling stations during northeast monsoon season in Perak river, Malaysia, Values are Mean±SE |
 | |
| Fig. 6: | Density of zooplankton in different months and stations during northeast monsoon season in Perak river, Malaysia, Values are Mean±SE |
The highest zooplankton density was recorded in December 2009 for upstream station (86.35x10³±28.63x10³ individuals m-3) while highest zooplankton density in estuarine and marine stations were recorded in January 2010 (112.01x10³±18.57x10³ individuals/m3 and 136.37x10³±39.81x10³ individuals m-3 for estuarine and marine stations, respectively) (Fig. 6). On the other hand, the lowest zooplankton density for upstream and estuarine station were recorded in November (3.48x10³±1.12x10³ individuals m-3 and 1.77x10³±0.33x10³ individuals m-3 for upstream and estuarine station, respectively) while lowest zooplankton density for marine station was recorded in February 2010 (5.00x10³±1.07x10³ individuals m-3).
Highest copepod diversity index, H’ (2.20±0.23) was recorded at the marine station while the lowest was recorded at the upstream station (H’ = 1.59±0.01) (Fig. 7). Multi dimensional scaling based on zooplankton density showed three major groups at 43% similarities, stress value: 0.17 (Fig. 8). The first group consisted mainly of the zooplankton from the upstream station and a few from the estuarine area, whereas the marine group contained mainly of marine species and a few from the estuarine area. On the other hand, the estuarine group consisted of the combination of the zooplankton found in both estuary and marine stations. In the upstream station, the zooplankton community mainly consisted of zooplankton that adapted to freshwater including some copepods, polychaetes and cladocerans.
 | |
| Fig. 7: | Copepod diversity index (Mean±SE) at Perak river, Malaysia |
 | |
| Fig. 8: | Multi dimensional scaling analysis based on zooplankton abundance at Perak River sampling stations, Malaysia |
DISCUSSION
A dynamic ecosystem such as an estuary is subjected to the influence from the marine and freshwater influxes, preserving nutrient and other substances that stimulate its productivity (Elliott and McLusky, 2002). In Perak river mouth, the salinity was lower than other estuaries bordering the Straits of Malacca probably due to the large size of this river and its catchment area. Huge flush of freshwater from the upstream, surface runoff and rain result in drastic salinity oscillation in Perak estuary. Rainfall can be a major source of variation in surface-water quality (Matias-Peralta, 2010). In this study, high precipitation during NE monsoon season might be a causative factor.
Based on the Interim Malaysia Water Quality Standard (IMWQS), Perak River can be characterised as Class II A (Water supply II: conventional treatment required, Fishery II: Sensitive aquatic species). In this study, the concentrations of all nutrients measured in the study area were below the maximum levels standard of water quality limits, where the maximum concentration limit of phosphorus, ammoniacal-nitrogen and nitrate-nitrogen were 200, 300 and 400 μg L-1, respectively (DOE, 2010).
Zooplankton abundance and distribution in Perak River showed that the zooplankton density fluctuated with the influence of the salinity. Rezai et al. (2009) stated that higher zooplankton abundances may be partly due to the intrusion of more saline waters, as the mixing of these waters may provide favourable conditions for zooplankton development. In this study, the lowest zooplankton density was recorded in the estuarine station and highest in the marine station. In the contrary, Jayasinghe (2005) found that the highest zooplankton densities occurred in the estuarine area rather than in the river or the sea. In this study, low zooplankton density in the estuary was probably due to high predation pressure from the high abundance of jellyfish populations. In addition, the estuarine water was more turbid compared to the marine station, thus less phytoplankton was available as food item for the zooplankton. Low zooplankton density in estuarine station might also be due to the fact that the estuary area was exposed to more drastic salinity fluctuations compared to the other stations. Thus, only species with high tolerance to salinity changes can survive in this brackish environment. Rezai et al. (2004) and Wickstead (1958) stated that a variety of physical, chemical and biological factors, including salinity might affect the density of some zooplankton. The zooplankton species of Perak river were mainly comprised a combination of marine and freshwater tolerant species. According to Champalbert et al. (2007), the changes in salinity will cause changes in zooplankton composition.
On the other hand, zooplankton density in Perak estuary showed low density in the beginning of NE monsoon and increased gradually with the peak appearing in the middle of the monsoon. Contrary to the study by Yoshida et al. (2006), zooplankton abundance normally peaked in the beginning and decreased gradually towards the end of the monsoon. The differences could be due to the differences in the environmental quality associated with a particular estuary, which, could affect to the zooplankton temporal and spatial fluctuations. High precipitation in the beginning of NE monsoon caused high water turbulence which led to turbidity increment. Low light penetration due to high turbidity level was probably a limiting factor for phytoplankton growth (Cloern, 1987), thus resulted in less food concentration for zooplankton.
Multi-dimensional scaling analysis based on zooplankton abundance in Perak river showed that there was a gradient of changes of zooplankton community with three distinct patterns. In the upstream station, the zooplankton community was dominated by the freshwater species and a few estuarine types, whilst the marine area consisted mainly of marine species and a few estuarine species. In the estuarine area, there was a mixture of estuarine and marine species with small overlap with the river species. Rundle et al. (1998) stated that estuarine ecosystems work as a continuum of overlapping communities along the salinity gradient. The direction of estuarine colonization, as evidenced by the species preferences, is from the sea rather than from fresh water. Factors such as river flow and tidal movement drive the marine communities towards estuaries (Waniek, 2003) thus form the estuarine communities (Froneman, 2004). In the present study, cladocerans were only found in the upstream station, while copepods were found in all stations, even though only copepod nauplii and copepodite stages were found in the upstream station. A number of studies stated that crustaceans, especially copepods form a major portion of the zooplankton community in most tropical estuarine systems (Day et al., 1989; Mishra and Panigrahy, 1999). Likewise, in this study, Perak river-estuarine ecosystem was dominated by copepods where they contributed more than 90% of the total zooplankton count. The huge freshwater input from the large Perak river might have caused the marine station to have a similar zooplankton composition as the estuary. The highest copepod diversity index of copepods was observed in the marine station and decreased as the salinity decreased. Diversity index, H’ in this study ranged from 1.59 to 2.20 which was comparable to the study done by Jayasinghe (2005) in Langat river estuary.
Zooplankton distribution is greatly related to various environmental, physical and chemical factors. In this study, salinity played important roles to control diversity. On the other hand, turbidity and predation pressure play important roles in controlling zooplankton abundance in Perak river.
ACKNOWLEDGMENTS
The study was supported by E-science fund (04-01-04-SF0418) and Research University Grant Scheme (RUGS), UPM (05-01-09-0727) and the grants from the Japan Society for the Promotion of Science (JSPS): Grant-in-Aid for Scientific Research (B) 23405031 awarded to JN. The authors would like to acknowledge Prof. Shuhei Nishida for his professional assistance in confirming copepod species. The authors wish to thank Perumal K., Azmi A., Nursuhayati, A.S., Safura, S. and Marinni, K. from the Laboratory of Marine Biotechnology, Institute of Bioscience, UPM for their technical assistance.
REFERENCES
- Champalbert, G., M. Pagano, P. Sene and D. Corbin, 2007. Relationship between meso-and macro-zooplankton communities and hydrology in the Senegal River Estuary. Estuarine Coastal Shelf Sci., 74: 381-394.
CrossRef - Cloern, J.E., 1987. Turbidity as a control on phytoplankton biomass and productivity in estuaries. Continental Shelf Res., 7: 1367-1381.
CrossRef - Elliot, M. and D.S. McLusky, 2002. The need for definitions in understanding estuaries. Estuarine Coastal Shelf Sci., 55: 815-827.
CrossRef - Froneman, P.W., 2004. Zooplankton community structure and biomass in a South African temporarily open/closed estuary. Estuarine Coastal Shelf Sci., 60: 125-132.
CrossRef - Parsons, R.T., M. Yoshiaki and G.M. Lalli, 1984. A Manual of Chemical and Biological Methods for Seawater Analysis. 1st Edn., Pergamon Press, Oxford, UK., ISBN: 9780080302874, Pages: 173.
Direct Link - Rezai, H., F.M. Yusoff, A. Arshad, A. Kawamura, S. Nishida and O.B.H. Ross, 2004. Spatial and temporal distribution of copepods in the Straits of Malacca. Zool. Stud., 43: 486-497.
Direct Link - Rezai, H., F.M. Yusoff, A. Arshad and B.H.R. Othman, 2009. Abundance and composition of zooplankton in the Straits of Malacca. Aquat. Ecosyst. Health Manage., 12: 264-270.
CrossRefDirect Link - Rundle, S.D., M.J. Attrill and A. Arshad, 1998. Seasonality in macroinvertebrate community composition across a neglected ecological boundary, the freshwater-estuarine transition zone. Aquat. Ecol., 32: 211-216.
CrossRef - Waniek, J.J., 2003. The role of physical forcing in the initiation of spring blooms in the Northeast Atlantic. J. Mar. Syst., 39: 57-82.
CrossRef - Wickstead, J.H., 1958. A survey of the larger plankton of Singapore Straits. J. Cons. Int. Explor. Mer., 23: 340-353.
CrossRef - Yoshida, T., T. Toda, F.M. Yusoff and B.H.R. Othman, 2006. Seasonal variation of zooplankton community in the coastal waters of the Straits of Malacca. Coastal Mar. Sci., 30: 320-327.
Direct Link - Yusoff, F.M., M. Shariff and N. Gopinath, 2006. Diversity of Malaysian aquatic ecosystem and resources. Aquat. Ecosyst. Health Sustainabil. Manage., 9: 119-135.
CrossRefDirect Link