
Heru Kuswantoro
Indonesian Legume and Tuber Crops Research Institute, Indonesian Agency for Agricultural Research and Development, Jl. Raya Kendalpayak Km. 8, P.O. Box 66, Malang, 65101, Indonesia
Siti Zubaidah
Department of Biology, Faculty of Mathematics and Natural Sciences, Malang State University, Jl. Surabaya 6 Malang, 65145, Indonesia
Sulisetijono
Department of Biology, Faculty of Mathematics and Natural Sciences, Malang State University, Jl. Surabaya 6 Malang, 65145, Indonesia
Journal of Biological Sciences
Year: 2014 | Volume: 14 | Issue: 8 | Page No.: 508-514


ABSTRACT
CpMMV-resistant soybean genotype is required in all of soil types, because the incidence of CpMMV is spreaded out in broad and various areas including various soil types. Therefore, CpMMV-resistant soybean genotype is also needed to other soil type such as Ultisols and associated Entisols-Inceptisols. The objective of the research was to study the response of CpMMV-resistant soybean lines in Ultisols and associated Entisols-Inceptisols soil types. A total of 16 F8 generation of CpMMV-resistant soybean lines were grown those two soil types by using randomized complete block design with three replications. The site of Ultisols was in Kalimantan Island while Entisols-Inceptisols site was in Java Island. Results showed that genotype×environment interaction was found on plant height, number of reproductive nodes per plant, number of pods per plant, grain size and grain yield. In Ultisols some of agronomical characters decreased such as number of branches per plant, grain size and grain yield but some agronomical characters also increased such as plant height, number of reproductive nodes per plant and number of filled pods per plant. Decreasing seed size was found on all of the genotypes grown in Ultisols and it caused decreasing grain yield. The higher number of filled pods per plant in Ultisols rather than in Entisols-Inceptisols could not increase grain yield in Ultisols. G1 achieved the heighest grain yield (1.6 t ha-1) in Ultisols suggesting this genotype can be developed as CpMMV-resistant soybean genotype in acid soil area.
PDF Abstract XML References Citation
Received: October 13, 2014;
Accepted: December 17, 2014;
Published: March 25, 2015
How to cite this article
Heru Kuswantoro, Siti Zubaidah and Sulisetijono, 2014. Decreasing Grain Size Caused Declining Grain Yield of CpMMV-Resistant Soybean
Lines Grown in Ultisols. Journal of Biological Sciences, 14: 508-514.
DOI: 10.3923/jbs.2014.508.514
URL: https://scialert.net/abstract/?doi=jbs.2014.508.514
DOI: 10.3923/jbs.2014.508.514
URL: https://scialert.net/abstract/?doi=jbs.2014.508.514
INTRODUCTION
Soybean is a susceptible crop to various viral diseases. One of the virus causing low soybean production is CpMMV (Cowpea mild mottle virus), the primarily virus infecting soybean plantation in Indonesia. This virus causes plant vegetative growth disorder, predominantly on the leaf morphology where the leaf experiencing malformation become curling and cup-like form (Iwaki et al., 1982, 1986), necrotic on the stem (Almeida et al., 2005) and plant height shortening in severe infection (Zubaidah et al., 2006). However, before appearing morphological symptoms, physiological changes occur previously such as leaf chlorotic due to decreasing total chlorophyll (Goodman et al., 1986), causing leaf mosaic (Thouvenel et al., 1982) and finally decreasing quantity and quality of the product (Tavassoli et al., 2008). Yield loss due to viral diseases reaching 10-100% depends on virus-host-vector interaction and epidemiology factors (Kareem and Taiwo, 2007).
Viral diseases are difficult to be controlled because virus is obligate parasit. Therefore, the usage of resistant plant is the effective scheme to controll this disease, because resistant plant is capable to hinder replication and transportation of the virus in the plant. Consequently, it decreases virus distribution in plant organs. Beside, the usage of resistant plant is the best alternative controll because the cost is cheap, no detrimental effect to the environment and no adding cost production. However, the resistant plant is also required to adapt to the environment including the soil types. It is because a plant will perform differently when grown on different fertility levels of the same soil type. Depending on the characteristic of the soil, different response also will appear when a plant grown on different soil types.
The soil type of associated Entisols-Inceptisols is a transition soil type from Entisols to Inceptisols, where the soil property is a combination of both soil types. Entisols is soil with lack or no profile development (no pedogenesis process) due to the short duration formation. As a mineral soil, Entisols has no pedogenic horizons and dominated by sand particles causing low aggregate stability (Bondansari and Susilo, 2011). Inceptisols are soils that have undergone modifications of the parent material by soil-forming processes that are sufficiently great to distinguish the soils from Entisols but not intense enough to form the kinds of horizons that are required for classification into other soil orders (Aydinalp and Fitzpatrick, 2003). Ultisols is included as a marginal land. This soil has chemical properties constraints such as low CEC, macronutrients deficiency (N, P, K, S, Ca and Mg), micronutrients deficiency (Zn, Cu, B and Mo), low base saturation and high aluminum saturation that toxic to the plant (Bondansari and Susilo, 2011). In this study, CpMMV-resistant soybean genotypes that usually grown in optimal land condition were tested in two distinct soil types, i.e., associated Entisols-Inceptisols as optimal soil condition and Ultisols as suboptimal soil condition.
MATERIALS AND METHODS
Plant materials: Plant materials used in this study were 16 CpMMV-resistant soybean lines of the F8 generation derived from Gumitir×MLGG 0021 crossing (Table 1). Gumitir is a high yielding soybean variety while MLGG 0021 is the CpMMV-resistant genotypes. The crossing of the two genotypes was conducted in 2006 by using Gumitir as female parent and MLGG 0021 as male parent. From F3 to F6 generation, the hybrid populations were selected to find out CpMMV-resistant genotypes. In F7 generation, the seeds of selected genotypes were propagated to provide seeds for this experiment.
Experimental sites: Two separate sites were used for this experiment. The first site was in Malang, East Java with soil type of associated Entisols-Inceptisols while the second site was in Tambang Ulang, South Kalimantan with soil type of Ultisols and pH 5.29.
Land preparation and planting: Before planting, the land was ploughed and harrowed to obtain good soil condition.
| Table 1: | Code and genotype name |
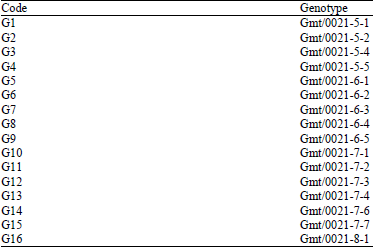 | |
Drainage canals were made every 3 M with 20 cm depth and 40 cm width. In Tambang Ulang, planting was conducted from April to July 2013 while in Malang was conducted from June to September 2013. Four seeds of soybean were sown per hole with spacing of 15 cm within rows and 40 cm between rows. After 14 days the plants were thinned became two plants per hole. Fertilizers were applied using 56.25 kg N, 90 kg P2O5, 75 kg K2O ha-1 in Ultisols and 22.5 kg N, 27 kg P2O5, 37.5 kg K2O ha-1 in Entisols-Inceptisols. Weed controls were carried out at 14 and 28 day after planting.
Data collection: In each location the design was randomized complete block design with three replications. Data was recorded for plant height, number of branches per plant, number of reproductive nodes per plant, number of filled pods per plant, grain size and grain yield. Grain size was measured by measuring 100 grains weight.
Statistical analysis: Data was analyzed by using analysis of variance and followed by Honestly Significant Difference (HSD) α 5%. Relationship among yield and yield components were analyzed by using correlation analysis.
RESULTS
Combined analysis of CpMMV-resistant soybean lines grown in associated Entisols-Inceptisols and Ultisols showed genotype×environment interaction on plant height, number of reproductive nodes per plant, number of pods per plant, grain size and grain yield. There was no genotype×environment interaction and no genotype different on number of branches per plant but the environments were significantly different (Table 2).
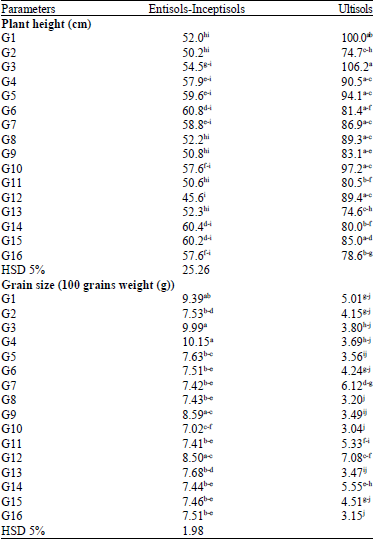
Genotype×environment interaction on plant height revealed that G3 was the highest soybean line followed by G1 in Ultisols while the lowest soybean line was G12 in Entisols-Inceptisols. All of the genotypes had higher plant height when grown in Ultisols than in Entisols-Inceptisols. The lowest genotypes G1 and G13 with plant height 74.7 and 74.4 cm, were remain higher than the highest genotypes in Entisols-Inceptisols (Table 3).
| Table 2: | Combine analysis of CpMMV-resistant soybean lines grown in associated Entisols-Inceptisols and Ultisols |
 | |
| **Significant at 1%, *Significant at 5%, Height: Plant height (cm), Branch: No. of branches per plant, Pod: No. of filled pods per plant, Grain: 100 grains weight (g), Yield: Yield per hectare (t ha-1) | |
| Table 3: | Genotype×environment interaction on plant height and on number of grains of CpMMV-resistant soybean lines grown in associated Entisols-Inceptisols and Ultisols |
 | |
| Values followed by the same letters were not significantly different at HSD 5% | |
In this study, effect of low pH could not decrease soybean plant height. Average plant height in Ultisols was 87 cm while in Entisols-Inceptisols was 55.1 cm. It was 22.9 cm or 37% plant height in Ultisols higher than in Entisols-Inceptisols.
There was environment difference and no genotype difference on number of branches per plant was observed (Fig. 1a-c). It meant that statistically there were no differences among the genotypes in Entisols-Inceptisols and among the genotypes in Ultisols. A difference was found between the two soil types (Fig. 1a). The average of number of branches per plant was higher in Entisols-Inceptisols than in Ultisols, i.e., 5.37 and 2.49 branches, respectively.
Number of reproductive nodes per plant also showed genotype×environment interaction effect. Th e highest number of reproductive nodes per plant was achieved by G7 and G5 in Entisols-Inceptisols while the lowest was achieved by G5 in Ultisols. Three genotypes showed large decreasing number of reproductive nodes per plant from Entisols-Inceptisols to Ultisols, i.e., G5, G6 and G7. G1 was the only genotype with number of reproductive nodes per plant in Ultisols higher than in Entisols-Inceptisols while the others were as same as or lower than in Entisols-Inceptisols (Fig. 1b).
The largest number of filled pods per plant was shown by G10 in Ultisols while the smallest number was shown by G12 in Ultisols and G3 in Entisols-Inceptisols (Fig. 1c). Similar to plant height, effect of low pH could not decrease number of filled pods per plant, where the average number of filled pods per plant in Ultisols was higher than in Entisols-Inceptisols. However, some genotypes had number of filled pods per plant in Entisols-Inceptisols higher than in Ultisols such as G7, G12 and G14. Genotype G7 also had the highest number of filled pods per plant in Ultisols with 74.8 pods. The other genotypes with number of filled pods higher than 70 pods per plant were G5, G6 and G10.
Grain size was measured based on 100 grains weight. Heavier 100 grains weight means larger grain size and vice versa. There was genotype×environment interaction effect on grain size. The largest grain size was achieved by G4 in Entisols-Inceptisols while the smallest grain size was achieved by G10, G16 and G8 in Entisols-Inceptisols. The lowest grain size in Etisols-Inseptisols was achieved by G10 with 7.02 g per 100 seeds. There was only one genotype with grain size higher than 7.02 g per 100 seeds (Table 3). Therefore, average of grain size in Ultisols was lower than in Entisols-Inceptisols.
Genotype×environment interaction on grain yield revealed the highest grain yield by G5, G7, G6 and G16 in Entisols-Inceptisols that achieved 2.0 or 2.1 t ha-1 while the lowest by G8 and G15 in Ultisols that achieved 0.8 t ha-1. The highest grain yield in Ultisols was achieved by G1 with 1.6 t ha-1. All of the genotypes grown in Ultisols had lower grain yield than grown in Entisols-Inceptisols. Genotype G1 with the highest grain yield in Ultisols also was higher than grain yield of G3 and as same as G10 in Entisols-Inceptisols (Fig. 2). It meant that only one genotype in Entisols-Inceptisols had lower grain yield than genotype with the highest grain yield in Ultisols. Associated Entisols-Inceptisols soil types produced higher grain yield than Ultisols.
Relationship of yield and grain yield components showed that in Entisols-Inceptisols yield significantly correlated to all of observed characters while in Ultisols grain yield only correlated to grain size.
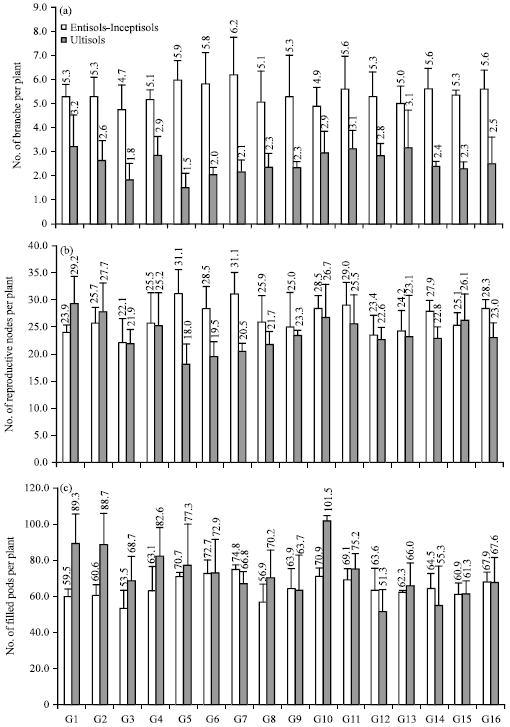 | |
| Fig. 1(a-c): | (a) Number of branches, (b) No. of reproductive nodes and (c) No. of filled plant of CpMMV-resistant soybean lines grown in associated Entisols-Inceptisols and Ultisols |
In Entisols-Inceptisols six relationships among the yield components were found, i.e., relationship between plant height with number of nodes and filled pods per plant, number of branches per plant with number of nodes and filled pods per plant, number of nodes per plant with number of pods per plant and number of nodes per plant with grain size. In Ultisols only three relationships among yield components were found, i.e., number of branches per plant with number of nodes per plant, number of nodes per plant with number of filled pods per plant and number of pods per plant with grain size (Table 4).
DISCUSSION
Genotype×environment interaction suggested that the rank of a soybean line in the two environments were different and one genotype or some genotypes well grew in a specific environment and the other in another environment. In this case, the ranking of the genotypes in Entisols-Inceptisols differed to those in Ultisols. Generally, the good season for soybean growth in Entisols-Inceptisols is dry season, while in Ultisols is wet season. Therefore, the experiment was conducted in these two different seasons.
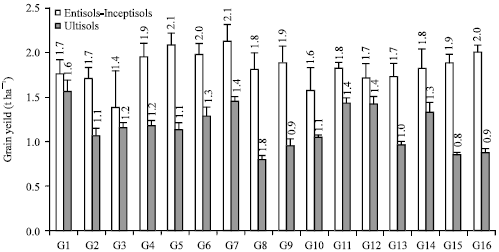 | |
| Fig. 2: | Genotype×environment interaction on grain yield of CpMMV-resistant soybean lines grown in associated Entisols-Inceptisols and Ultisols |
| Table 4: | Relationship of yield and yield components of CpMMV-resistant soybean lines grown in associated Entisols-Inceptisols and Ultisols |
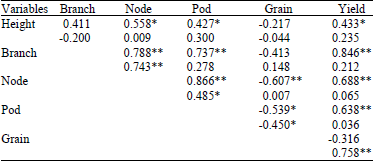 | |
| Upper: Entisols-Inceptisols, Lower: Ultisols, *,**Significant at 5 and 1%, Height: Plant height (cm), Branch: No. of branches per plant, Pod: No. of filled pods per plant, Seed: 100 grains weight (g), Yield: Yield per hectare (t ha-1) | |
When the soybeans were grown in dry season, the soybeans performance were very bad in Ultisols (Kuswantoro and Zen, 2013).
Generally, acidity leads plant height growth but in this study the average of plant height in Ultisols was higher than in Entisols-Inceptisols with normal pH. It occurred because in Ultisols the soybean lines were grown in rainy season while in Entisols-Inceptisols soybean lines were grown in dry season. The duration of vegetative growth in rainy season is longer than in dry season (Kuswantoro and Zen, 2013). It is also supported by studies in water deficit (Desclaux et al., 2000) that water deficit shortened plant height. Bondansari and Susilo (2011) also reported that plant height in Ultisols was higher than in Entisols after adding with organic manure.
Even though genotype×environment interaction was significant in number of reproductive nodes per plant but the environment was not significantly different (Table 2). It is suggested that number of reproductive nodes per plant in Ultisols was statistically as same as in Entisols-Inceptisols. There was a significant relationship between plant height and number of reproductive nodes in Entisols-Inceptisols but no relationship between those two characters in Ultisols (Table 4). It indicated that in Ultisols the plant height remained to grow well if the water was available but the reproductive nodes was suppressed. It also because number of branches was suppressed in Ultisols (Fig. 1a) causing lower number of reproductive nodes. Further, there were environment differences and no genotype difference on number of branches per plant (Fig. 1a) suggested that environment played primary role on the performance of the soybean lines. It also indicated equally adding or subtracting value on each genotype causing the ranking of the genotypes between Ultisols environment and Entisols-Inceptisols environment were statistically similar. Deficiency and toxicity in Ultisols (Bondansari and Susilo, 2011), lead the lower number of branches per plant. However, number of reproductive nodes per plant in this study was higher than other study in Ultisols that achieved average 17.3 reproductive nodes per plant (Kuswantoro et al., 2014).
Usually, in Ultisols pod setting and pod filling is disrupted and lead decreasing number of filled pods but in this study number of filled pods per plant in Ultisols was higher than in Entisols-Inceptisols. Probably it occurred because the Ultisols environment was still capable to support pod setting. Kuswantoro and Zen (2013) reported large number of pods per plant in Ultisols with average upto 114 pods per plant when soybean grown in rainy season but only 32 pods per plant when grown in dry season. Therefore, water also presumably the main factor regulating pod setting except the soil pH. Different results were reported by Bondansari and Susilo (2011) that number of pods per plant was larger in Entisols than in Ultisols.
The smaller average of grain size in Ultisols than in Entisols-Inceptisols and (Table 3) describing that acidity in Ultisols decreased the grain size. Even though pod setting in Ultisols was better than in Entisols-Inceptisosl but the pod filling process worst, consequently the grain size decreasing. For pod filling process, it is needed nutrients as the raw materials. If the raw materials is limited, the process can not perform normally. The availability of nutrients in Ultisols is lower than Entisols-Inceptisols. Beside, Ultisols is constrained by micronutrients toxicities such as Al and Mn. These constrains also may hamper pod filling process by two ways, i.e., destructing plant organ (Merino-Gergichevich et al., 2010) and/or suppressing essential nutrients when entering the plant (Bose et al., 2011).
Grain yield in Entisols-Inceptisols was higher than in Ultisols and consistent relationships were observed between yield and soil variables, where soybean yield related negatively to pH (Anthony et al., 2012). Grain yield is the resultant of other agronomical characters. The most important characters supporting grain yield were number of pods per plant and grain size, where grain yield has significant relationship to number of pods per plant (Arshad et al., 2014; Egli, 2013; Koladiya et al., 2012; Kuswantoro and Zen, 2013) and grain size (Athoni and Basavaraja, 2012; El-Badawy and Mehasen, 2012; Malik et al., 2011). In this study, there was no correlation between number of filled pods per plant to grain yield in Ultisols but grain size had correlation to grain yield. On the other hand, there was no correlation between grain size and grain yield in Entisols-Inceptisols. It demonstrated the different role of the two characters to produce grain yield in each environments. Number of pods was more important in Entisols-Inceptisols while grains size was more important in Ultisols. However, grain size could decrease grain yield in Ultisols although number of filled pods in Ultisols was larger than in Entisols-Inceptisols. Therefore, in this Ultisols grain size was more important than number of filled pods.
CONCLUSION
Grain yield is the main character that improved in plant breeding. Genotype×environment interaction was found on most agronomical characters suggested that selecting soybean genotype for improving grain yield in a particular environment need to be carried out by considering many agronomical characters that supported the grain yield. All of genotypes grown in Ultisols showed decreasing grain size and it caused decreasing grain yield. The higher number of filled pods per plant in Ultisols could not increased grain yield higher than in Entisols-Inceptisols. Therefore, grain size need to be increased to obtain high grain yield in Ultisols. The genotypes with the highest grain yield in each soil type can be developed in their specific area.
ACKNOWLEDGEMENT
This study was supported by the Ministry of National Education, Republic of Indonesia. We would like to thank Mr. Agus Supeno for the assistance in the research.
REFERENCES
- Almeida, A.M.R., F.F. Piuga, S.R.R. Marin, E.W. Kitajima, J.O. Gaspar, T.G. de Oliveira and T.G. de Moraes, 2005. Detection and partial characterization of a carlavirus causing stem necrosis of soybean in Brazil. Fitopatologia Brasileira, 30: 191-194.
CrossRefDirect Link - Anthony, P., G. Malzer, S. Sparrow and M. Zhang, 2012. Soybean yield and quality in relation to soil properties. Agron. J., 104: 1443-1458.
CrossRefDirect Link - Arshad, W., M. Zeeshan, M.I. Khan, S. Ali, M. Hussain and S. Rahman, 2014. Character association and causal effect analysis for yield and yield components among early maturing genotypes of soybean (Glycine max L. Merrill). J. Renewable Agric., 2: 1-4.
CrossRefDirect Link - Athoni, B.K. and G.T. Basavaraja, 2012. Association analysis, genetic variability and genetic diversity studies in soybean (Glycine max (L.) Merrill). Asian J. Bio Sci., 7: 114-118.
Direct Link - Aydinalp, C. and E.A. Fitzpatrick, 2003. Genesis and classification of inceptisols formed on the slate parent material under forest vegetation. J. Central Eur. Agric., 4: 281-288.
Direct Link - Bondansari and B.S. Susilo, 2011. Pengaruh zeolit dan pupuk kandang terhadap beberapa sifat fisik tanah ultisols dan entisols pada pertanaman kedelai (Glycine max L. Merril). Agronomika, 11: 122-135.
Direct Link - Bose, J., O. Babourina and Z. Renge, 2011. Role of magnesium in alleviation of aluminium toxicity in plants. J. Exp. Bot., 62: 2251-2264.
CrossRefDirect Link - Desclaux, D., T.T. Huynh and P. Roumet, 2000. Identification of soybean plant characteristics that indicate the timing of drought stress. Crop Sci., 40: 716-722.
CrossRefDirect Link - Egli, D.B., 2013. The relationship between the number of nodes and pods in soybean communities. Crop Sci., 53: 1668-1676.
CrossRefDirect Link - El-Badawy, M.E.M. and S.A.S. Mehasen, 2012. Correlation and path coefficient analysis for yield and yield components of soybean genotypes under different planting density. Asian J. Crop Sci., 4: 150-158.
CrossRefDirect Link - Iwaki, M., P. Thongmeearkom, M. Prommin, Y. Honda and T. Hibi, 1982. Whitefly transmission and some properties of Cowpea mild mottle virus on soybean in Thailand. Plant Dis., 66: 365-368.
Direct Link - Kareem, K.T. and M.A. Taiwo, 2007. Interactions of viruses in Cowpea: Effects on growth and yield parameters. Virol. J., Vol. 4.
CrossRefDirect Link - Koladiya, P.B., S.N. Saravaiya, D.A. Patel, K.N. Chaudhari and B.N. Patel, 2012. Correlation and path coefficient analysis for yield and yield contributing traits in soybean (Glycine max (L.) MERRILL). Veg. Sci., 39: 95-97.
Direct Link - Kuswantoro, H. and S. Zen, 2013. Performance of acid-tolerant soybean promising lines in two planting seasons. Int. J. Biol., 5: 49-56.
CrossRefDirect Link - Malik, M.F.A., M. Ashraf, A.S. Qureshi and M.R. Khan, 2011. Investigation and comparison of some morphological traits of the soybean populations using cluster analysis. Pak. J. Bot., 43: 1249-1255.
Direct Link - Merino-Gergichevich, C., M. Alberdi, A.G. Ivanov and M. Reyes-Diaz, 2010. Al3+-Ca2+ interaction in plants growing in acid soils: Al-phytotoxicity response to calcareous amendments. J. Soil. Sci. Plant Nutr., 10: 217-243.
Direct Link - Thouvenel, J.C., A. Monsarrat and C. Fauquet, 1982. Isolation of Cowpea mild mottle virus from diseased soybeans in the Ivory coast. Plant Dis., 66: 336-337.
CrossRef - Tavassoli, M., N. Shahraeen and S. Ghorbani, 2008. Detection and some properties of Cowpea mild mottle virus isolated from soybean in Iran. Pak. J. Biol. Sci., 11: 2624-2628.
CrossRefPubMedDirect Link - Zubaidah, S., H. Kuswantoro and N. Saleh, 2006. Penetapan skoring ketahanan tanaman kedelai terhadap CPMMW (Cowpea mild mottle carlavirus). Proceedings of the Makalah Seminar Nasional Biologi Dengan Tema Tumbuhan dan Peradaban Manusia di FMIPA, September 9, 2006, Institut Teknologi Sepuluh, Surabaya, pp: 150-156.