
D. Norris
Department of Animal production, School of Agricultural and Environmental Sciences, University of Limpopo, P/Bag X1106, Sovenga, South Africa
W. Ngambi
Department of Animal production, School of Agricultural and Environmental Sciences, University of Limpopo, P/Bag X1106, Sovenga, South Africa
C.A. Mbajiorgu
Department of Animal production, School of Agricultural and Environmental Sciences, University of Limpopo, P/Bag X1106, Sovenga, South Africa
Journal of Biological Sciences
Year: 2009 | Volume: 9 | Issue: 3 | Page No.: 254-258


ABSTRACT
In this study, two populations with varying percentages of animals in full-sib families were simulated. For each population, two combinations of additive and dominance genetic variances of different relative magnitudes were considered thereby creating 4 sub-populations. For each sub-population, a further 3 populations (I1, I2, I3) were created with varying degree of inbreeding level (0, 0.02 and 0.05) resulting in a total of 12 populations. Constant residual variance was used in all populations. Variance components were estimated using the tilde-hat approximation to REML based on sire-dam model. Both additive and dominance genetic variances were estimated with high degree of accuracy and the level of inbreeding did not seem to result in changes in the magnitudes of the genetic variances. At low levels of inbreeding, accounting for inbreeding in genetic evaluations may not be necessary.
PDF Abstract XML References Citation
How to cite this article
D. Norris, W. Ngambi and C.A. Mbajiorgu, 2009. Estimates of Additive and Non-Additive Genetic Variances with Varying Levels of Inbreeding. Journal of Biological Sciences, 9: 254-258.
DOI: 10.3923/jbs.2009.254.258
URL: https://scialert.net/abstract/?doi=jbs.2009.254.258
DOI: 10.3923/jbs.2009.254.258
URL: https://scialert.net/abstract/?doi=jbs.2009.254.258
INTRODUCTION
The partitioning of the total variance into its components allows the determination of the relative importance of the various determinants of the phenotype, in particular the role of heredity versus environment (Falconer, 1996). The role of heredity takes two forms: determination of individuals’ phenotype by their genotypes or determination of individuals’ phenotypes by the genes transmitted from the parents. The assessment of both forms is increasingly becoming important. However, livestock genetic evaluations in most livestock species currently use the additive genetic model. This is the case even though considerable research has shown the need for genetic evaluation accounting for dominance effects for particular traits and populations (Norris et al., 2006; Wei and Van der Werf, 1993; Misztal et al., 1995, 1998; Varona et al., 1997; Rye and Mao, 1998). The reason for not considering dominance and epistatic genetic effects has largely been because of difficulties associated with their estimation (Bridges and Knapp, 1987; Fenster et al., 1997). A limiting factor in the analysis of non-additive genetic models has been the ability to compute the inverses of non-additive genetic covariance matrices for large populations. Additionally, accounting for inbreeding in dominance analysis for medium to large populations also poses a computational problem. However, new computing programs have been developed to address this challenge. The wide use of artificial insemination and embryo transfer coupled with the large-scale application of new reproductive technologies such as embryo splitting, cloning etc is increasing the frequency of genetically identical, full-sib and three-quarter sib groups in livestock populations and thus necessitating the use of non-additive genetic models in livestock genetic evaluations (Chalh and El Gazzah, 2004).
Genetic covariance between individuals in random mating, non-inbred population for quantitative traits is a well defined linear function of the genetic variance components assuming small contributions from many unlinked loci (Cockerham, 1954). In inbred populations, inbreeding my complicate the genetic covariance structure of populations (De Boer and Hoeschele, 1993; Kelly and Arathi, 2003). In the presence of inbreeding, genetic variance is redistributed (Falconer, 1996). The changes in gene frequency due to inbreeding cause some variance that was dominance or epistatic in the ancestral population to become additive within the pure breeds. Consequently, it is possible for additive and even total variance within breeds to increase at low levels of inbreeding (Miller and Goddard, 1998) and inability to account for inbreeding in genetic evaluations may bias estimates of the genetic variances. Therefore, the objective of this study was to investigate the changes in estimates of genetic variances under varying levels of inbreeding.
MATERIALS AND METHODS
The study by Norris et al. (2002) showed that in populations with a large number of animals having dominance genetic relationship (20% or greater), estimates of dominance genetic variances can be obtained with improved accuracy even when the dominance genetic effect in the population is of small magnitude. The present study is an extension of the Norris et al. (2002) study. This simulation study was carried out at the University of Limpopo, South Africa in 2008.
Two populations with 50% (P1) and 100% (P2) of animals in full-sib families were simulated. The number of animals in each population was 10000 and each full-sib family had 25 animals. For each population, combinations of additive variance, VA and dominance variance, VD were considered: V1 (VA = 800, VD = 200), V2 (VA = 500, VD = 500), thereby creating 4 populations, each with 10000 animals. The residual variance was constant at 2000 in all populations. From each population, a further 3 populations (I1, I2, I3) were created with varying degree of inbreeding level (0, 0.02 and 0.05) resulting in a total of 12 sub-populations. The populations are denoted as follows in Table 1. Population P1-V1-I1 for instance had 50% of animals in full-sib families with additive and dominance genetic variances of 800 and 200, respectively. The inbreeding level was zero. The descriptions of the other populations are given in the Table 1 under the properties column.
Each population was simulated for 20 replicates.
Records were simulated and analyzed according to the following sire and dam model:
yijk = μ+si+mj+smij+eijk | (1) |
where, μ is the population mean, si is the additive effect of sire ~N (0, 1/4σa2), mj is the additive effect of dam ~N (0, 1/4σa2), smij is the dominance effect due to interaction of sire and dam ~ N (0, 1/4σd2). εijk is the residual effect ~ N (0, σe2+1/2σa2+3/4σd2).
Derivation of additive (a) and dominance (d) genetic values (Hoeschele and VanRaden, 1991):
| a = 0.5as + 0.5ad + ma | |
| d = fds,d +md |
where, as and ad are the additive genetic effects of sire and dam, respectively. fds,d is combination of sire with dam due to interaction of genes from the sire with genes from the dam. ma and md are the respective additive and dominance genetic effects due to mendelian sampling.
Var (ma) = 0.5 σa2; Var (md) = 0.75 σd2 |
The above sire-dam model can be written in matrix notation on an individual animal basis as:
y = Za+Zd+e | (2) |
where, y is the data vector, a is the vector of random additive effects for sire and dam, d is the vector of random dominance effects, e is the vector of residuals and Z are known matrices corresponding to a and d, respectively.
Variance components were estimated using the tilde-hat approximation to REML (Van Raden and Jung, 1988). The inverse relationship matrices, A-1 and D-1 were computed directly by algorithms described by Henderson (1976) and Hoeschele and VanRaden (1991). Computations were done using FORTRAN programs INVERS and NONAD2 written by Hoeschele (1991).
| Table 1: | Populations description |
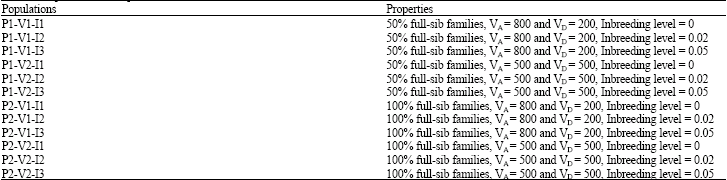 | |
RESULTS AND DISCUSSION
The estimates of genetic variances under varying levels of inbreeding in sub-populations with 50% of animals in full-sib families are shown in Table 2. The estimated genetic variances are shown in Table 2 and 3 while on the table footnotes the simulated genetic variances are indicated. The estimated genetic variances (additive and dominance) are similar (p>0.05) to the true simulated variances in all populations. Additionally, these variances are similar to the simulated variances irrespective of the level of inbreeding. The results on the ability to accurately estimate non-additive genetic variances in populations with a high number of animals with non-additive relationships support an earlier study by Norris et al. (2002) which indicated that in populations with at least 20% of animals with non-additive relationships, accurate estimations of dominance variance is achievable. There is conflicting information on the effect of inbreeding or inbreeding depression on the estimation of genetic variances. De Boer and Arendonk (1992) used a genetic model with either 64 or 1,600 unlinked biallelic loci and complete dominance to study prediction of additive and dominance effects in selected or unselected populations with inbreeding. When changes in mean and genetic covariances associated with dominance due to inbreeding were ignored, significantly biased predictions of additive and dominance effects in generations with inbreeding resulted. Bias, assessed as the average difference between predicted and simulated genetic effects in each generation, increased almost linearly with the inbreeding coefficient. When the genetic variation underlying a quantitative trait is controlled by genes that act additively within and between loci, the additive genetic variance within a population following a bottleneck event or inbreeding is expected to decrease by a proportion F, the inbreeding coefficient of the population (Wang et al., 1998). However, there indication that additive genetic variance and heritability of some quantitative traits within populations can actually increase following population bottlenecks (Wang et al., 1998; Whitlock and Fowler, 1999). The study by Russell et al. (1984) investigated changes in variances with increased inbreeding in beef cattle showed that the changes do not generally follow the theoretical expectations for the redistribution of genetic variances. Whitlock and Fowler (1999) performed a large-scale experiment on the effects of inbreeding and population bottlenecks on the additive genetic and environmental variance for morphological traits in Drosophila melanogaster lines and found that the mean change in additive genetic variance was in very good agreement with classical additive theory, decreasing proportionally to the inbreeding coefficient of the lines.
In a study by Takayoshi et al. (2007) on the relationships among estimates of additive genetic variance, dominance genetic variance and inbreeding depression for type traits in Holstein population of Japan, the estimates of inbreeding depressions had significantly negative relationship with the estimates of dominance genetic standard deviations. De Boer and Hoeschele (1993) showed that for a biallelic locus with complete dominance and for favorable gene frequencies that are about 0.20 or about 0.80, large effects of inbreeding depression were linked to high dominance variance.
The estimates of genetic variances under varying levels of inbreeding in sub-populations with 100% of animals in full-sib families are shown in Table 3. Similar results are observed in these subpopulations as those with 50% of animals in full-sib families. The estimated genetic variances (additive and dominance) are similar (p>0.05) to the true simulated variances and these variances are similar to the simulated variances irrespective of the level of inbreeding.
| Table 2: | Genetic variances in populations with 50% full-sibs under different levels of inbreeding |
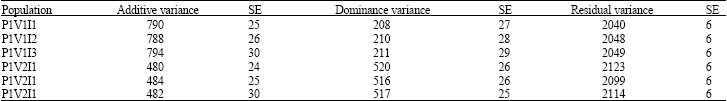 | |
| P1-50% full-sib families, V1-(VA = 800 and VD = 200): Simulated (true) genetic variances, V2- (VA = 500 and VD = 500): Simulated (true) genetic variances, I1: No. inbreeding, I2: 0.02 inbreeding, I3: 0.05 inbreeding, SE: Standard error | |
| Table 3: | Genetic variances in populations with 100% full-sibs under different levels of inbreeding |
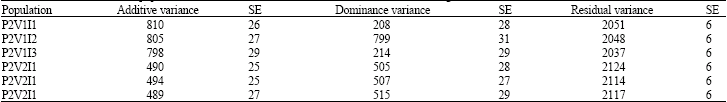 | |
| P2-100% full-sib families, V1-(VA = 800 and VD = 200): Simulated (true) genetic variances, V2-(VA = 500 and VD = 500): Simulated (true) genetic variances, I1: No. inbreeding, I2: 0.02 inbreeding, I3: 0.05 inbreeding, SE: Standard error | |
It is worth noting that the inbreeding levels in this study were very low compared to other studies and therefore the stability in the estimation of genetic variances may be due to these low levels of inbreeding. However, a study by Miller and Goddard (1998) in which they modeled additive and non-additive genetic effects within and between breeds in multi breed evaluation, showed that at low levels of inbreeding within a breed, most non-additive genetic variation exists within-breed, indicating that models which do not account for within-breed non-additive genetic variation could be missing the largest source of variation.
CONCLUSION
In the presence of inbreeding, the common practice is account for it by including inbreeding depression as a covariate. This study seems to indicate that at low levels of inbreeding, genetic variances can still be estimated with accuracy. Therefore, it may not necessary to account for inbreeding in such cases thus removing some of the computational challenges associated with incorporating dominance relationships and inbreeding coefficients in genetic analysis.
REFERENCES
- Chalh, A. and M. El Gazzah, 2004. Bayesian estimation of dominante merits in noninbred populations by using Gibbs sampling with two sets of mixed model equations. J. Applied Genet., 45: 331-339.
PubMed - Falconer, D.S. and T.F.C. Mackay, 1996. Introduction to Quantitative Genetics. 4th Edn., Prentice Hall, Harlow, England, ISBN-13: 9780582243026, Pages: 464.
Direct Link - Fenster, C.B., L.F. Galloway and L. Chao, 1997. Epistasis and its consequences for the evolution of natural populations. Tree, 12: 282-286.
CrossRefDirect Link - Hoeschele, I., 1991. Additive and nonadditive genetic variance in female fertility of Holsteins. J. Dairy Sci., 74: 1743-1752.
CrossRefDirect Link - Hoeschele, I. and P.M. VanRaden, 1991. Rapid inversion of dominance relationship matrices for noninbred populations by including sire by dam subclass effects. J. Dairy Sci., 74: 557-569.
CrossRefDirect Link - Henderson, C.R., 1976. A simple method for computing the inverse of a numerator relationship matrix used in prediction of breeding values. Biometrics, 32: 69-83.
Direct Link - Kelley, J.K. and H.S. Arathi, 2003. Inbreeding and the genetic variance of floral traits in Mimulus guttatus. Heredity, 90: 77-83.
CrossRef - Misztal, I., L. Varona, M. Culbertson, N. Gengler, J.K. Bertrand, J. Mabry, T.J. Lawlor and C.P. van Tassell, 1998. Studies on the value of incorporating effect of dominance in genetic evaluations of dairy cattle, beef cattle and swine. Proceedings of the 6th World Congress on Genetics Applied to Livestock, January 11-16, 1998, Armidale, Australia.
- Norris, D., I.L. Mao and R.J. Coetzee, 2002. Effect of population structure and underlying magnitude of dominance genetic effects on the estimation of additive and dominance genetic variances. S. Afr. J. Anim. Sci., 32: 353-357.
Direct Link - Norris, D., L. Varona, A. Visser, H.E. Theron, S.F. Voordewind and E.A. Nesamvuni, 2006. Estimation of the additive and dominance variances in South African Landrace pigs. S. Afr. J. Anim. Sci., 36: 261-268.
Direct Link - Russell, W.C., J.S. Brinks and G.V. Richardson, 1984. Changes in genetic variances with increased inbreeding of beef cattle. Genetics, 75: 8-10.
CrossRefDirect Link - Rye, M. and I.L. Mao, 1998. Nonadditive genetic effects and inbreeding depression for body weight in Atlantic salmon (Salmo salar L.). Livest. Prod. Sci., 57: 15-22.
CrossRefDirect Link - Takayoshi, K., Y. Satoshi and S. Mitsuyoshi, 2007. Relationships among estimates of additive genetic variance, dominance genetic variance and inbreeding depression for type traits in Holstein population of Japan. Nihon Chikusan Gakkaiho, 78: 21-28.
Direct Link - Van Raden, P.M. and Y.C. Jung, 1988. A general purpose approximation to restricted maximum likelihood: The tilde-hat approach. J. Dairy Sci., 71: 187-194.
CrossRefDirect Link - Van Raden, P.M., T.J. Lawlor, T.H. Short and I. Hoeschele, 1992. Use of reproductive technology to estimate variances and predict effects of gene interactions. J. Dairy Sci., 75: 2892-2901.
CrossRefDirect Link - Varona, L., I. Misztal, J.K. Bertrand and T.J. Lawlor, 1997. Effect of full sibs on additive breeding values under the dominance model for stature in united states holsteins. J. Dairy Sci., 81: 1126-1135.
CrossRefDirect Link - Wang, J., A. Caballero, P.D. Keightley and W.G. Hill, 1998. Bottleneck effect on genetic variance: A theoretical investigation of the role of dominance. Genetics, 150: 435-447.
Direct Link - Wei, M. and J.H.J. Van der Werf, 1993. Animal model estimation of additive and dominance variances in egg production traits of poultry. J. Anim. Sci., 71: 57-65.
CrossRef - Whitlock, M.C. and K. Fowler, 1999. The changes in the genetic and environmental variance with inbreeding in Drosophila melanogaster. Genetics, 152: 345-353.
PubMed