
Arunrat Chaveerach
Department of Biology, Faculty of Science, Khan Kaen University, Khan Kaen 40002, Thailand
Runglawan Sudmoon
Department of Biochemistry, Faculty of Science, Khan Kaen University, Khan Kaen 40002, Thailand
Tawatchai Tanee
Faculty of Environment and Resource Studies, Mahasarakham University, Mahasarakham 44000, Thailand
Piya Mokkamul
Department of Biochemistry, Faculty of Science, Khan Kaen University, Khan Kaen 40002, Thailand
Alongkoad Tanomtong
Department of Biochemistry, Faculty of Science, Khan Kaen University, Khan Kaen 40002, Thailand
Journal of Biological Sciences
Year: 2007 | Volume: 7 | Issue: 8 | Page No.: 1388-1393


ABSTRACT
To study genetic diversity and similarity, 15 individuals of Nelumbo nucifera from NE and C Thailand were collected according to their geographical areas and the morphological differences among individual characters, such as the color of tepals, the absence or presence of petaloid staminodes and petaloid stamens. These studied samples were analyzed to determine a genetic similarity and diversity profile using sixteen inter-simple sequences repeat (ISSR) markers. A dendrogram was constructed and showed similarity values of the species between 84.10-95.00%. The samples produced 46.09% polymorphic banding profiles. The genetic diversity (H) in this population was estimated using the Shannon`s index. The genetic diversity (H) value of 1.581 reflected the broad range of distribution sites, which would require high genetic diversity to adapt to the environmental variations that can be found between NE and C. The Mantel test of 0.061 revealed that geographical distance is an important factor affecting the genetic distance among the studied samples.
PDF Abstract XML References Citation
How to cite this article
Arunrat Chaveerach, Runglawan Sudmoon, Tawatchai Tanee, Piya Mokkamul and Alongkoad Tanomtong, 2007. Genetic Relationships in a Population of Nelumbo nucifera Gaertn. (Nelumbonaceae). Journal of Biological Sciences, 7: 1388-1393.
DOI: 10.3923/jbs.2007.1388.1393
URL: https://scialert.net/abstract/?doi=jbs.2007.1388.1393
DOI: 10.3923/jbs.2007.1388.1393
URL: https://scialert.net/abstract/?doi=jbs.2007.1388.1393
INTRODUCTION
Nelumbo nucifera Gaertn. (Nelumbonaceae) is an economically important ornamental plant that can be found in ponds, streams and lakes. It is essential in Buddhist religious activities worldwide and is popular as food, for medicine and for horticulture. It is a plant with perfect flowers. Cultivars of it do not exist, but there are varieties in the absence or presence of petaloid staminodes and petaloid stamens and the color of tepals. White or pink tepal varieties without petaloid staminodes and petaloid stamens always grow in natural conditions. White or pink tepal varieties with petaloid staminodes and petaloid stamens are accepted popularly for commercial growing because they produce many flowers.
Genetic diversity is reflected in differences among individuals for many characters, including eye, skin and hair color in humans, color and banding patterns of snail shells, flowers in plants and protein and DNA sequences. Genes are sequences of nucleotides in a particular segment (locus) of a DNA molecule. Genetic diversity at molecular levels represents slightly different sequences. In turn, variants in DNA sequences may result in differences in amino acid sequences in the protein coded for by the locus. Such protein variations may result in functional, biochemical or morphological dissimilarities that cause differences in reproductive rate, survival or behavior of individuals which are commonly treated to be advantageous for survival (Frankham et al., 2003). So an understanding of the diversity of genes responsible for species’ adaptations and responses to their environment is a foundation for understanding almost all ecological and evolutionary processes. It is the raw material permitting species to adjust to a changing world, which is caused by both natural and human factors. Additionally, a study of intraspecific genetic diversity in the genome consisting of the level of similarity (homogeneity) or difference (heterogeneity) of populations of the same species indicates to what extent genetic material can be exchanged between populations and still maintains a species-specific gene pool. Genetic exchange within a species can provide further insight into the role of diverse populations in maintaining a species’ genetic diversity, or in leading the isolation and creation of distinctive new genomes and thus potentially to revealing that a single species may in fact be two or more species. Also, a thorough knowledge on understanding the genetic diversity is essential for establishing effective and efficient conservation and breeding practices (Avise, 1994).
The genetic similarity can be used to measure the relatedness of samples (Nybom and Hall, 1991; Welsh et al., 1991). The method of depicting the results of a phenetic analysis is by way of a branching diagram called a dendrogram drawn by cluster analysis which is a method for grouping operational taxonomic units (OTUs).
The result is a branching diagram that connects all of the OTUs and OTU clusters at levels corresponding to their degree of similarity. By selecting an appropriate range of similarity to represent a given level in the taxonomic hierarchy, the taxonomists may then recognize species, genera, etc. Groups in which all OTUs have similarities between 85-100% might be recognized as part of the same species, while a 65% criterion might be used for genera (Weier et al., 1982; Rost et al., 1984). However, the ultimate interpretation of the dendrogram is dependent upon the taxonomist’s knowledge of the operational taxonomic units (Weier et al., 1982; Rost et al., 1984).
Traditionally, morphological characters have been used to characterize levels and patterns of diversity or similarity. Since these traits represent only a small portion of the plant genome and are influenced by environmental factors, they have limited utility for describing the potentially complex genetic structure which structure, which may exist within and between taxa (Avise, 1994). Various molecular approaches have been devised to overcome these constraints (Soltis and Soltis, 1990). A number of PCR-based DNA markers, including Random Amplified Polymorphic DNA (RAPD), Simple Sequence Repeat (SSR), Inter-Simple Sequence Repeat (ISSR) and Amplified Fragment Length Polymorphism (AFLP) techniques have been used widely to investigate population genetics. Each of these methods has many advantages and limitations. ISSR markers are extremely variable and have proven to be sensitive enough to differentiate cultivars and natural populations (Wolfe et al., 1998; Chaveerach et al., 2006). These markers of genetic variation are generally independent of environmental factors and more numerous than phenotypic characters, thereby providing a clearer indication of the underlying variation in the genome (Avise, 1994).
The Mantel test is a linear estimate of the relationship between the two square distance matrices, based on the degree of relationship of two sets of variables, species-environment relationships taken at the same sampling locations. The Mantel statistic can be normalized into a product-moment correlation coefficient (r) that varies from -1 to +1. The values close to -1 and +1 indicate very strong relationships, while those close to zero indicate very weak relationships. Negative r 's indicates negative relationship; positive r 's indicates positive relationships. A value of zero indicates no relationship between the variables (Fortin et al., 2002).
The present study aims to examine genetic relationships consisting of genetic similarity and diversity in a population of N. nucifera using DNA markers from the ISSR technique. Also, using the method of relationship between the two square distance matrices of two sets of variables, species-environment relationships and here genetic and geographic distance relation is evaluated by Mantel’s statistic. The assessment of genetic variation in N. nucifera may be applied towards breeding purposes for trade and conservation of species.
MATERIALS AND METHODS
Plants materials: Young leaves of 15 individuals of N. nucifera were randomly collected from 5 populations in various geographical areas within the provinces of Udon Thani, Sakon Nakhon, Khon Kaen and Loei, all 4 of which are provinces in Northeastern Thailand (NE) and within Suphan Buri province, Central Thailand (C) (Table 1). Three individuals were selected in each province which are over 50-60 km apart distances. The distances of Khon Kaen to Udon Thani, Udon Thani to Sakon Nakhon, Sakon Nakhon to Khon Kaen and Khon Kaen to Suphan Buri are 120, 160, 200 and 560 km, respectively. The province locations are shown on a map of Thailand in Fig. 1. Leaf materials were collected and immediately dried using silica gel and then stored at -70°C until the DNA was extracted. Out group for this study is Nymphaea lotus L. Sample collections were done in 2005 and DNA extraction, ISSR analysis and ISSR data analysis were conducted in 2006 at Department of Biology, Faculty of Science, Khon Kaen University, Khon Kaen, Thailand.
DNA extraction: Genomic DNA was extracted from dried leaves using the Qiagen DNeasy mini-kit. The DNA was checked by subjecting it to 0.8% agarose gel electrophoresis stained with ethidium bromide. The quality and quantity of the DNA samples were determined by a gel documenting instrument. DNA samples extracted from three individuals from each province were pooled into a study sample, thus 5 pooled DNA samples were used for further analysis. Then, DNA samples were diluted in TE to a final concentration of 20 ng μL-1. These dilutions were used as DNA templates in PCR reactions.
| Table 1: | Studied samples, collection sites and morphological variations of Nelumbo nucifera Gaertn |
 | |
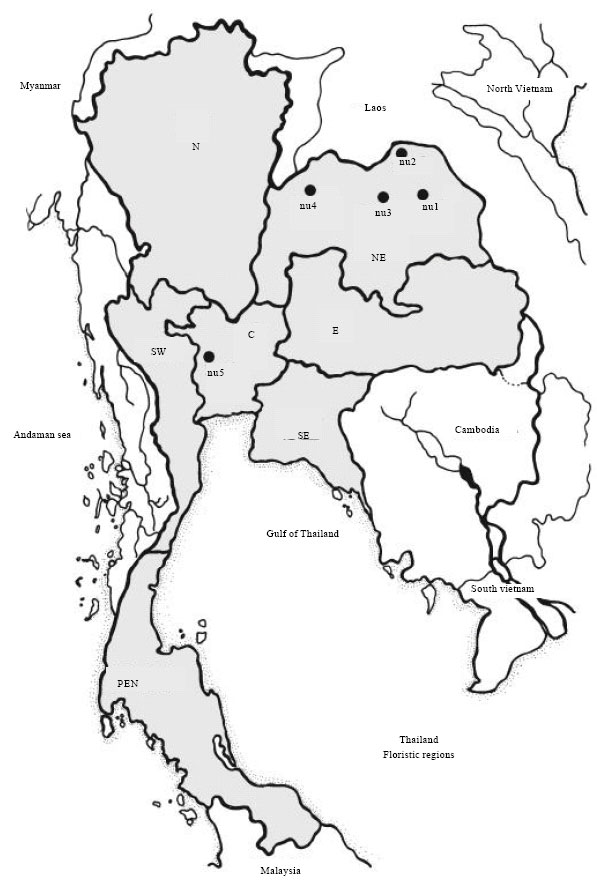 | |
| Fig. 1: | A map of Thailand indicating sample collection provinces (•) of nu1 (Udon Thani), nu2 (Sakon Nakhon), nu3 (Khon Kaen), nu4 (Loei) in northeastern (NE) Thailand and nu5 (Suphan Buri) in central (C) Thailand |
| Table 2: | Summary of ISSR primers, number of bands scored, number of polymorphic bands and percentage of polymorphisms for amplification profile of five individuals of Nelumbo nucifera Gaertn |
 | |
ISSR analysis: Amplification reactions were performed using a PCR machine (Gene Amp PCR system 9700, Applied Biosystems). Amplifications were carried out in 25 μL reactions consisting of Taq reaction buffer, 2 mM of MgCl2, 0.3 mM of each dNTP, 0.3 μM primer, 1.25 units of Taq DNA polymerase (Invitrogen) and 5 ng of DNA template. Thirty-five ISSR primers were used in PCR reactions. The 16 ISSR primers that successfully amplified clear bands for N. nucifera are shown in Table 2.
The reaction mixture was incubated at 94°C for 3 min and the amplification was performed with the following thermal cycles: 35 cycles of denaturation for 1 min at 94°C, 2 min annealing temperature Tm-5, 2 min at 72°C and 7 min final extension at 72°C. Amplification products were detected by agarose gel electrophoresis in TAE buffer (0.4 M Tris, 0.114% acetic acid 1 mM EDTA pH 8.0) and visualized by ethidium bromide staining.
ISSR data analysis: The total number of ISSR bands discerned from the agarose gel was documented as diallelic characters: present = 1, absent = 0; as the ISSR markers are considered the dominant markers. The resulting bands were used to construct a dendrogram following the UPGMA with the Fingerprinting II program version 3.0 (Bio Rad). As noted earlier the outgroup species is Nymphaea lotus. The similarity values are obtained from the dendrogram. The percentage of polymorphic loci was calculated with the Shannon’s diversity index (H) for each population, H = -Σ pi ln pi, where, pi is the frequency of a given ISSR band. Genetic evenness (E) is calculated from genetic diversity/ln species richness (ln 5 = 1.61) (Nei, 1973, 1978). Mantel tests (r) (Mantel, 1976) were performed to analyze the effects of geographical distance on genetic distance by using the formula:
 |
where:
| x and y | = | Geographical and genetic distances at locations i and j. |
| n | = | The number of data entries in the distance matrices. |
| Sx and Sy | = | Standard deviations for variable x and y. |
RESULTS
Thirty-five primers were screened and 16 informative ISSR primers produced a total of 141 bands with sizes ranging from 200 to 2000 bp and an average of 8.81 bands per primer. Of these bands, 46.09% (65 bands) were polymorphic. Percentages of Polymorphic Bands (PPB) for each primer ranged from 0 to 100%. Primer (GT)6GG generated the highest number of bands (20 bands). The minimum number of bands (5) was produced by primer (CA)9A (Table 2). Figure 2 shows the banding pattern using the primer (AC)8G, one of the 16 informative primers which demonstrates the differences of banding pattern between individuals and geographical areas in a population of N. nucifera.
The dendrogram (Fig. 3) clearly distinguishes the studied samples into two groups, one including nu1, nu2 and nu3 and the second comprising nu4 and nu5 without consideration of the flower color and the absence or presence of petaloid staminodes and petaloid stamens. The similarity (S) values of a species N. nucifera (nu1-nu5) range display from 84.10 to 95.00%. The S values support the studied samples to be in three groups. The first group, nu1-nu2, without petaloid staminodes and petaloid stamens, always grows in natural conditions, having white and pink tepals and has the highest S value of 95%. The second group, nu3-nu4, with S value of 88.90%, are with petaloid staminodes and petaloid stamens. They are popularly accepted for commercial growing for religious and ornamental purposes because of producing many flowers and having white tepals. The third group comprising populations, nu3-nu5, with petaloid staminodes and petaloid stamens, is also popularly accepted for commercial growing because of high flower productivity and used for religious and ornamental activities, having white and pink tepals and a high S of 84.1% (Table 3).
| Table 3: | Genetic similarity values of Nelumbo nucifera Gaertn. population |
 | |
| Table 4: | Genetic diversity (H) and Evenness (E) values of Nelumbo nucifera Gaertn. population |
 | |
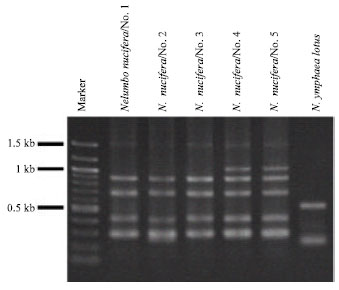 | |
| Fig. 2: | ISSR profile of Nelumbo nucifera Gaertn. and Nymphaea lotus with primer (AC)8G |
The genetic diversity of the population species of the five studied samples collected in different provinces is 1.58 (Table 4). The value reflects the broad range of distribution sites of the species. Genetic richness is 5, ln genetic richness (ln 5) is 1.69, so the genetic evenness is 0.98 (Table 4). This value supports that all studied samples have nearly equally genetic abundance.
The Mantel test shows a significant positive correlation between geographical and genetic distances among all five studied samples, r = 0.061. This reveals that geographical distance is an important factor affecting the genetic distance between populations.
 | |
| Fig. 3: | A dendrogram constructing from 16 ISSR primers determined by UPGMA (Fingerprinting II, Bio Rad) to clarify the genetic relationships of Nelumbo nucifera Gaertn. Nymphaea lotus is an out group |
DISCUSSION
The highest S value of 95% in natural variety, nu1 and nu2, indicates a very good genetic interchange or gene flow interchange between populations, without human factor disturbance. In contrast, S value of lower than 95% is due to the interference from having human activities for making optimal conditions to produce many more flowers for use in religious and ornamental activities. However, the S of N. nucifera is in a range of a species, 84.1-95% following Weier et al. (1982) and Rost et al. (1984).
The genetic diversity using ISSR markers indicates a high polymorphic value of 46.09 % in the geographically separated samples. The genetic diversity in a population is still high at 1.58. The great value of genetic diversity supports the broad range of distribution sites of N. nucifera, which would require high genetic diversity to adapt to the environmental variations that can be found between NE and C Thailand.
Actually, the number of individuals for genetic diversity evaluation should be 20-30 individuals and cover distant distribution areas. However, the individuals per sample and distributed collection areas of these studied samples indicate the genetic diversity in NE and C Thailand. This shows that the genetic diversity of N. nucifera should be able to fit environmental variation (Fu et al., 2003). High genetic diversity is important, allowing species to adjust to their ever-changing environment, whether these changes are due to the natural or human factors (Chamberlain and Hubert, 2001).
The genetic evenness value, 0.98, supports that all studied samples have nearly equally genetic abundance. The Mantel test value of 0.06 confirms the significant positive correlation among all 5 studied samples. In conclusion, the geographical distances between samples affect the genetic distances.
The method of taking extensive genetic diversity and similarity by collecting 3 individuals into a studied sample is an alternative method for saving chemicals and working time as showed by good values of genetic diversity and similarity.
While the study sample is small and dose not cover all parts of Thailand, a broad genetic diversity is represented because the collection sites cover a wide range of areas from NE to C Thailand and a number of individuals. Accordingly, the resulting values agree with conclusions found in the cited studies. These factors suggest that the results of this study may be considered valid.
REFERENCES
- Chaveerach, A., A. Tanomtong, R. Sudmoon and T. Tanee, 2006. Genetic diversity among geographically separated populations of Nepenthes mirabilis. Biol. Bratislava, 61: 295-298.
CrossRefDirect Link - Fu, C., Y. Qiu and H. Kong, 2003. RAPD analysis for genetic diversity in Changium smyrnioides (Apiaceae), an endangered plant. Bot. Bull. Acad. Sin., 44: 13-18.
Direct Link - Mantel, N., 1967. The detection of disease clustering and a generalized regression approach. Cancer Res., 27: 209-220.
Direct Link - Nei, M., 1973. Analysis of gene diversity in subdivided populations. Proc. Natl. Acad. Sci. USA., 70: 3321-3323.
PubMedDirect Link - Nei, M., 1978. Estimation of average heterozygosity and genetic distance from a small number of individuals. Genetics, 89: 583-590.
PubMedDirect Link - Nybom, H. and H.K. Hall, 1991. Minisatellite DNA fingerprints can distinguish Rubus cultivars and estimate their degree of relatedness. Euphytica, 53: 107-114.
CrossRefDirect Link - Welsh, J., R.J. Honeycut, M. McClelland and B.W.S. Sorbral, 1991. Parentage determination in maize hybrids using the arbitrarily primed polymerase chain reaction (AP-PCR). Theoret. Applied Genet., 82: 473-476.
CrossRefDirect Link - Wolfe, A.D., Q.Y. Xiang and S.R. Kephart, 1998. Diploid hybrid speciation in Penstemon (Scrophulariaceae). Proc. Natl. Acad. Sci. USA., 95: 5112-5115.
PubMedDirect Link