
Hakan Mete Dogan
Department of Soil, Faculty of Agricultural, University of Gaziosmanpa_a, GIS and RS Unit, Tasliciftlik 60240, Tokat, Turkey
Journal of Biological Sciences
Year: 2007 | Volume: 7 | Issue: 7 | Page No.: 1060-1071


ABSTRACT
Tokat is one of the important provinces of Turkey because of its exceptional biological diversity and nearly unpolluted environment. Detailed spatial information about climatic variables is often required for the studies focused on environmental modeling as well as agriculture in this region. On the other hand, this kind of information has not been readily available for Tokat until now. In this study, some climatic variables of the province were assessed and mapped to fulfill this requirement. Local Climate Estimator (LOCCLIM) software of the Food and Agriculture Organization (FAO) and the digital elevation model of the study area (1/25000 scale) were utilized together to estimate the climatic variables of determined 924 points with 0.02 decimal degree (~4250 m) grid intervals. Using Kriking method with spherical variogram model, derived climatic data for determined points were interpolated to raster maps with 30 m resolution in Geographic Information Systems (GIS). As a result, temperature (average, maximum, minimum), precipitation, potential evapotranspiration, water vapor pressure, sunshine fraction and wind speed raster maps were produced for the province. The relationships between elevation and the climatic variables were investigated by employing bi-variety correlation analysis. All correlations were found significant at the 0.01 level. Negative correlations were detected for water vapor pressure (-0.988), minimum temperature (-0.979), average temperature (-0.944), precipitation (-0.702), maximum temperature (-0.582) and wind speed (-0.298) variables, while sunshine fraction (0.886) and potential evapotranspiration (0.425) showed positive correlations. Consequences of this study were also summarized and interpreted at administrative district level.
PDF Abstract XML References Citation
How to cite this article
Hakan Mete Dogan, 2007. Climatic Portrayal of Tokat Province in Turkey; Developing Climatic Surfaces by Using LOCCLIM and GIS. Journal of Biological Sciences, 7: 1060-1071.
DOI: 10.3923/jbs.2007.1060.1071
URL: https://scialert.net/abstract/?doi=jbs.2007.1060.1071
DOI: 10.3923/jbs.2007.1060.1071
URL: https://scialert.net/abstract/?doi=jbs.2007.1060.1071
INTRODUCTION
Regular meteorological observations have been collected by General Directorate of State Meteorological Affairs (GDSMA) in Turkey since 1937. Today, this organization continues its activities under the Ministry of Environment and Forestry as the General Directorate of Turkish State Meteorological Service (GDTSMS). GDTSMS has a countrywide meteorological observation network with the total 293 stations and it has been a member of the World Meteorological Organization (WMO) since 1949. Currently, there are 69 synoptic, 56 Micro, 168 Macro climate stations at service in Turkey and 64 of them are automatic (GDTSMS, 2007). Not only collecting but also researching, evaluating, interpreting and publishing of meteorological data are among the duties of GDTSMS. Although GDTSMS has immense meteorological database, the studies that interpret this database in regional basis are not enough to fulfill the detailed spatial information requirements of administrative districts. The produced climatic raster maps by GDTSMS are generally country base and they do not have enough details in regional basis. Moreover accessing the GDTSMS data is sometimes difficult and costly. Therefore, there is still a strong need for the studies that develop detailed climatic surfaces (raster maps) at the administrative district level by using reliable and effective methods with minimum cost.
Data access and evaluating problems orientated several institutions to develop some climatic software. Food and Agriculture Organization (FAO) of the United Nations (UN) developed LOCCLIM software which is a powerful local climate estimator (Grieser, 2002). In basic, LOCCLIM presents an estimate of the climate at any location (point) in the world by using either its 1 km resolution elevation database or user-defined elevation database. This flexibility offered to produce more accurate estimates, if detailed elevation data is available. The generation of climatic surfaces from point-source data is a necessary step required for modeling ecological and hydrological processes across landscapes (Jolly et al., 2005). At this stage, spatial interpolation techniques have been successfully utilized to produce climatic surfaces (Holdaway, 1996; Kurtzman and Kadmon, 1999; Semenov and Brooks, 1999; Jeffrey et al., 2001; Lee and Hogsett, 2001; Gyalistras, 2003; Vicente-Serrano et al., 2003; Apaydin et al., 2004) and geographic information system (GIS) has facilitated the interpolation, modeling and mapping processes of climatic data (Patz and Balbus, 1996; Osterkamp et al., 2001; Svensson et al., 2002; Bradley et al., 2002). Consequently, there are some possibilities to produce reliable climatic raster maps at the regional basis by using LOCCLIM and GIS together (Dogan, 2007).
Tokat province of Turkey has an important geographic position where biological diversity and agriculture gained great importance. Therefore, climatic raster maps are one of the basic requirements for agricultural and ecological modeling studies in this region. Detailed climatic raster maps of the region are not available until now. To fulfill these requirements, this study aimed to develop raster maps that reveal the spatial distribution of climatic variables of this province and conducted in 2007. The produced climatic raster maps established a strong background to help the researchers and decision makers who work in the region and can be helpful for the studies especially devoted to environmental modeling and agricultural activities.
MATERIALS AND METHODS
Study area: Tokat province takes place at the crossing zone between the Middle Black Sea and Inner Anatolia regions of Turkey (Fig. 1a). The general topography of the study area shows mountainous characters and elevation changes between 85 and 2416 m (Fig. 1b). There are several (Niksar, Erbaa, Kazova) plains in this region. Main landmarks are the Yaylacık (1622 m) and Mamo (1792 m) Mountains in interior part, Canik Mountains (1646 m) in north, Köse Mountains and Asmalı Mountain (2416 m) in east, Deveci Mountains in south, Buzluk Mountains in west. Yeşilırmak River and Kelkit Stream are the principle drainages. Semi-arid Upper Mediterranean Bioclimatic characteristics with cold winters prevail in the region (Akman and Daget, 1971; Akman, 1999). Tokat covers 9912 km2 surface area and has 12 administrative districts namely; Almus, Artova, Başçiftlik, Centre, Erbaa, Niksar, Pazar, Reşadiye, Sulusaray, Turhal, Yeşilyurt and Zile (Fig. 1b).
Methodology: The applied methodology in this study based on the best estimates of the determined points in LOCCLIM software (Grieser, 2002) and the conversion of the derived point data to climatic raster maps in ARCGIS (ESRI, 2004; ESRI, 2005). As a first step, geographic references that belongs to the corners of the study area (Lat: 39.93-40.91, Long: 35.45-37.64) were determined by utilizing the digital map of the study area in ARCGIS. Then, the determined references and desired grid interval (0.05 decimal degrees ~4250 m) were entered in LOCCLIM by using ‘set locations from grid’ option. As a result, point data that cover the study area were established as a text file in LOCCLIM. Established text file opened, organized and saved as database format (dbf) in Excel software (Microsoft, 2003).
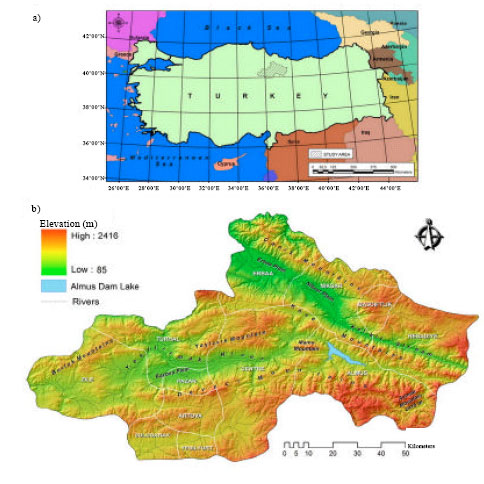 | |
| Fig. 1: | (a) Geographic location and (b) physical geography of the study area. Note: the names of administrative districts were written by white color |
Determined points (dbf file) were overlayed on the elevation raster map of the study area (1/25000 scale) and elevation values of these points were extracted in ARCGIS. In this way, a point (XYZ) database including elevation values was established and exported to a text file. The resulting text (XYZ) file was opened by using set locations from file option in LOCCLIM and desired variables (monthly mean temperatures, precipitation, wind, potential evapotranspiration, sunshine fraction, water vapor pressure), outputs (best estimate, confidence intervals: 95), inverse distance weighted averaging options (power exponent: 1, nearest neighbor approximation if minimum distance ≤1), climatic corrections (altitude and horizontal corrections), altitude (elevation provided in input file), size of neighborhood (maximum distance in km: 500, maximum number of stations: 20) and altitude restrictions (default) were determined in the options menu of LOCCLIM. Selecting ‘setting locations’ and ‘save’ buttons in the same menu, the best estimates were automatically generated and saved as text files in LOCCLIM. Derived text files that contain the best estimates of climatic variables were opened and organized in Microsoft Excel and saved as dbf files. Constituted dbf files were converted to climatic raster maps (30 m resolution) by applying Kriking method with spherical variogram model in ARCGIS. The climatic data that belong to 924 points were analyzed in SPSS software (SPSS, 2001) and relationships among the climatic variables were investigated by applying bivariate correlation analysis (Pearson coefficients). Finally, annual distributions of climatic variables at administrative district level were summarized as bar graphs and interpreted.
RESULTS
Generated climatic point data in LOCCLIM: The determined 924 points and selected surrounding (19) stations b y LOCCLIM were shown in Fig. 2a and b, respectively.
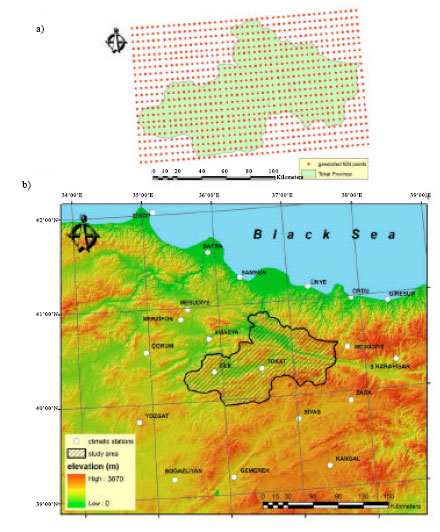 | |
| Fig. 2: | (a) The determined 924 points and (b) selected 19 stations by LOCCLIM |
Using the stations information and user defined elevation data, the best estimates of climatic variables were automatically calculated for determined points and saved by LOCCLIM. The graphs, prepared by using the average climatic values of 924 points, portrayed the climatic characteristics of Tokat province very well (Fig. 3a-d). Precipitation (PRECIP) is generally high in the winter (December, January and February) and spring (April and May) periods and the highest PRECIP values were recorded within the periods of April-May (Fig. 3a). The least PRECIP (6-7 mm) values were detected between July and September when mean temperature (TEMP) reached its highest level around 20°C (Fig. 3a). This was also known as the critical period for plants. The coldest days were recognized between January and February (Fig. 3a) and the highest maximum (TEMPMAX) and the lowest minimum (TEMPMIN) temperatures were recorded in August (28.96°C) and January (-5.61°C), respectively (Fig. 3b). Potential evapotranspiration (PET) and water vapor pressure (WAP) values also increased in June, July and August (Fig. 3c). Similarly, sun shine fraction (SUNSHINE) increased in the summer season (Fig. 3d). Wind speed (WIND) fluctuated during a year and the strongest winds appeared in April and July (Fig. 3d).
Developed climatic surfaces in GIS: Majority of climatic raster maps, produced in annual mean basis, showed parallelism with each others and an inverse relationship between elevation and the climatic variables attracted attention in these maps (Fig. 4). For instance, TEMP (Fig. 4a), TEMPMAX (Fig. 4b), TEMPMIN (Fig. 4c) and PRECIP (Fig. 4d) values increased in Kazova, Niksar and Erbaa plains, while these climatic variables decreased in Canik Mountains in north, Yaylacık Mountain in center, Deveci Mountains in south and Asmalı Mountain in southeast (Fig. 1b). Basically, PET values (Fig. 4e) increased from North to South. Low PET values were detected in Erbaa and Niksar plains, while the high PET values were found around Deveci Mountains. WAP (Fig. 4f) and SUNSHINE (Fig. 4g) raster maps showed opposite characteristics with each other. When WAP values decreased in higher elevations, SUNSHINE values increased. Therefore, high WAP and low SUNSHINE values were detected in Kazova, Niksar and Erbaa plains, while low WAP and high SUNSHINE values were recognized in Canik, Yaylacık and Asmalı mountains. Finally, WIND (Fig. 4h) showed a fluctuated spatial distribution in the study area. For this reason, a relationship between elevation and WAP could not be observed from the raster maps. The highest WIND values were detected around the main plains (Kazova, Niksar and Erbaa) and Asmalı Mountain.
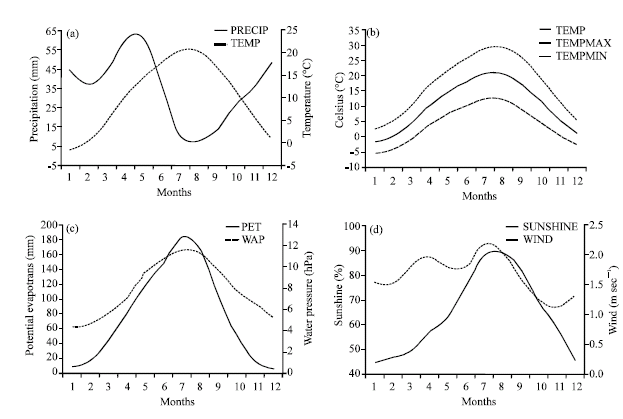 | |
| Fig. 3: | Annual distributions of climatic variables in Tokat. (a) precipitation (PRECIP) and mean temperature (TEMP); (b) maximum (TEMPMAX) and minimum (TEMPMIN) temperatures; (c) potential evapotranspiration (PET) and water vapor pressure (WAP); (d) sunshine fraction (SUNSHINE) and wind (WIND) |
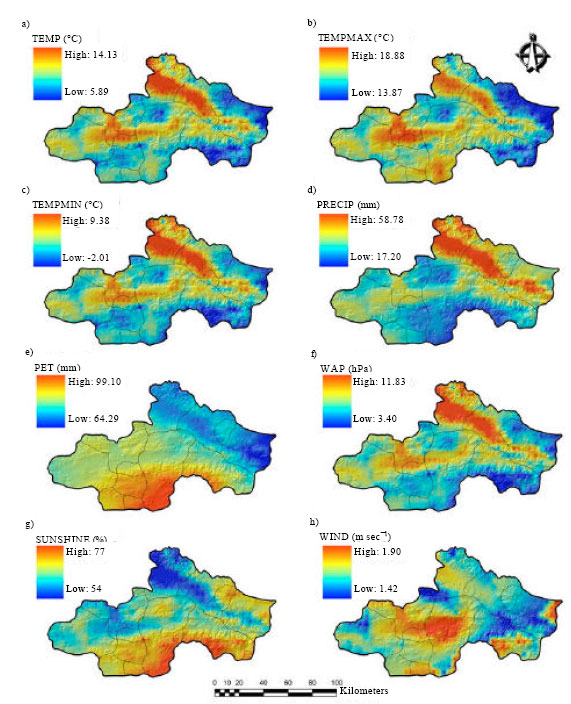 | |
| Fig. 4: | Developed climatic raster maps of the study area in annual mean basis; (a) mean temperature (TEMP), (b) maximum temperature (TEMPMAX), (c) minimum temperature (TEMPMIN), (d) precipitation (PRECIP), (e) potential evapotranspiration (PET), (f) water vapor pressure (WAP), (g) sunshine fraction (SUNSHINE) and (h) wind speed (WIND) |
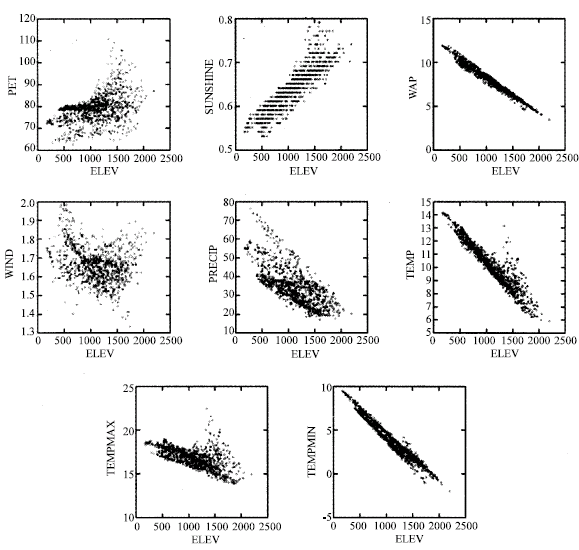
Relationships between climatic variables: Scatter plots indicated the characteristics of relationships between elevation and climatic variables (Fig. 5). According to the scatter plots, clear negative (inverse) relationships were determined for the WAP, PRECIP, TEMP, TEMPMAX and TEMPMIN climatic variables, while a distinct positive relationship was observed for SUNSHINE variable. On the other hand a clear relationship could not be seen for WIND and PET variables at a glance. Correlation analysis statistically clarified relationships between elevation and climatic variables. The results of correlation analysis (Pearson coefficients) were summarized in Table 1. All correlations were found significant at 0.01 levels. Except PET and SUNSHINE, all climatic variables showed negative (inverse) relationships with elevation. The highest correlations were observed for WAP (-0.988), TEMPMIN (-0.979), TEMP (-0.944), SUNSHINE (0.886) and PRECIP (-0.702), respectively. On the other hand, PET (0.425) and WIND (-0.298) variables showed low correlations.
 | |
| Fig. 5: | Scatter plots of elevation and climatic variables |
| Table 1: | Correlation analysis results (Pearson Coefficients) |
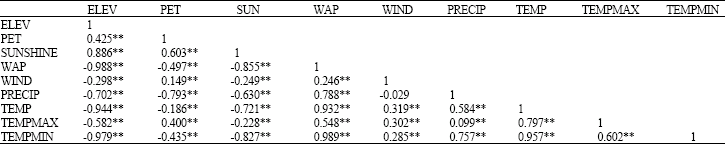 | |
| **Correlation is significant at 0.01 levels, ELEV: Elevation (m), PET: Potential evapotranspiration (mm), SUNSHINE: Sunshine fraction (%), WAP: Water vapor pressure (hPa), WIND: Wind speed (m sec-1), PRECIP: Precipitation (mm), TEMP: Mean temperature (°C), TEMPMAX: Maximum temperature (°C), TEMPMIN: Minimum temperature (°C) | |
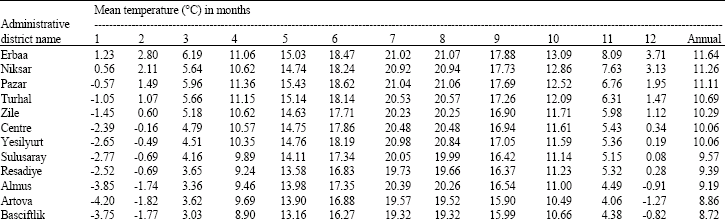
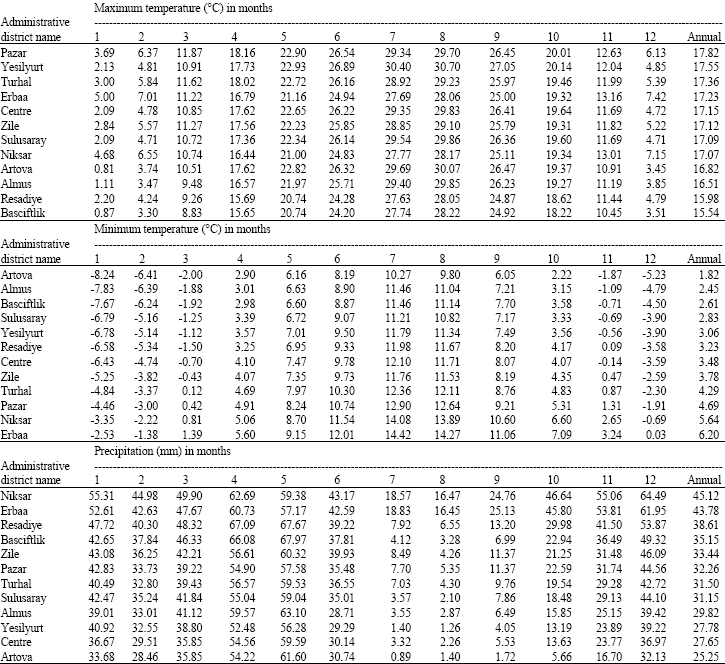
Interpretation of annual distributions: The results showed that, TEMP variable changes between 21.07 and -4.20°C in administrative districts (Fig. 6 and Appendix 1). From high to low TEMP values, the districts can be sequenced as Erbaa, Niksar, Pazar, Turhal, Zile, Centre, Yeşilyurt, Sulusaray, Reşadiye, Almus, Artova and Başçiftlik. In TEMPMAX point of view, values vary between 30.70 and 0.81°C. Although the hottest days (30.70°C) are recognized in Yeşilyurt, Pazar is the district where annual mean TEMPMAX (17.82°C) is the highest. Considering the annual means of TEMPMAX, the districts can be ordered as Pazar, Yeşilyurt, Turhal, Erbaa, Centre, Zile, Sulusaray, Niksar, Artova, Almus, Reşadiye and Başçiftlik in a descending manner.
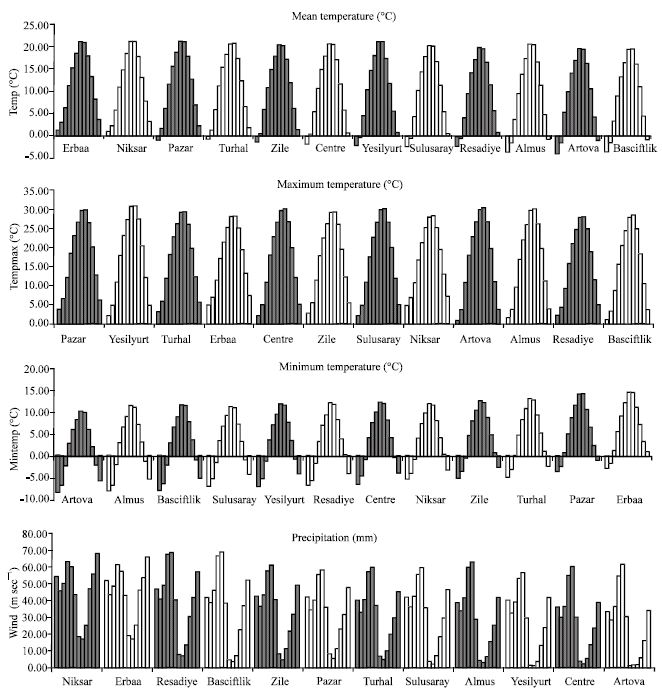 | |
| Fig. 6: | Annual distributions of mean temperature, maximum temperature, minimum temperature and precipitation in the administrative districts of Tokat province |
Low TEMPMIN values are generally recorded in January, February, December, March and November. Artova experiences the coldest days (-8.24°C) in January and Niksar and Erbaa have relatively mild winters comparing to others. Monthly mean PRECIP changes between 67.97 and 0.89 mm in the area. Considering annual means, Niksar receives the highest PRECIP (45.12 mm), while Artova has the lowest PRECIP (25.25 mm).
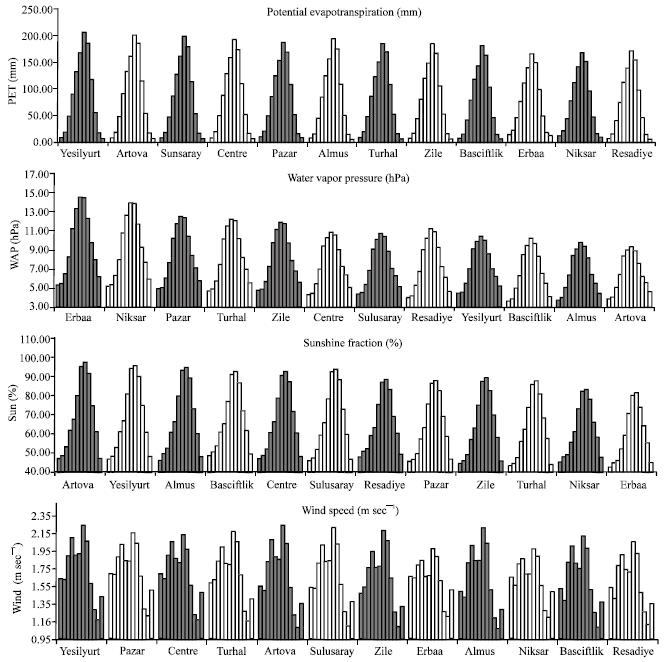
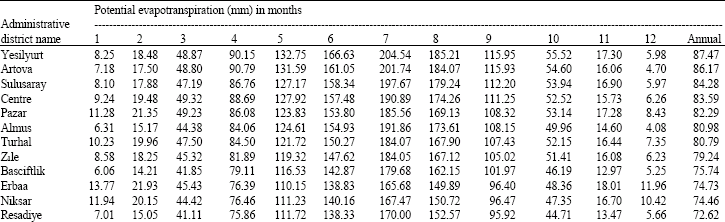
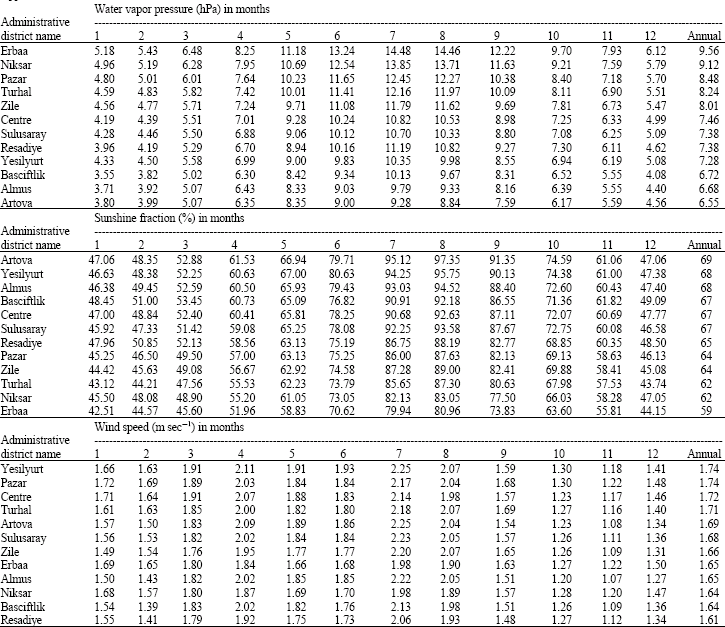
Maximum (204.54 mm) and minimum (4.08 mm) PET variables are detected in July and December, respectively (Fig. 7 and Appendix 2). Considering annual means, PET changes between 87.47 and 72.62 mm and districts can be ordered as Yeşilyurt, Artova, Sulusaray, Centre, Pazar, Almus, Turhal, Zile Başçiftlik, Erbaa, Niksar and Reşadiye in a descending manner. WAP variable reaches its maximum in July and minimum in January. The highest (14.48 hPa) and the lowest (3.55 hPa) WAP values are determined in Erbaa and Başçiftlik, respectively. Respecting annual means, the districts can be sequenced as Erbaa, Niksar, Pazar, Turhal, Zile, Centre, Sulusaray, Reşadiye, Yeşilyurt, Başçiftlik, Almus and Artova in a declining way. SUNSHINE values change between 42.51 and 97.35% and the sunniest days have been recognized in August, while the lowest values have been recorded in January.
 | |
| Fig. 7: | Annual distributions of potential evapotranspiration, water vapor pressure, sunshine fraction and wind speed in the administrative districts of Tokat province |
According to annual means, Artova (69%) and Yeşilyurt (68%) are the sunniest districts and these two are followed by Almus, Başçiftlik, Centre, Sulusaray, Reşadiye, Pazar, Zile, Turhal, Niksar and Erbaa in an order. Finally, WIND speeds change between 1.07 and 2.25 m sec-1. Maximum and minimum WIND values have been recorded in July and November, respectively. Yeşilyurt is the district that has the highest annual mean WIND (1.74 m sec-1) values and it is followed by Pazar, Centre, Turhal, Artova, Sulusaray, Zile, Erbaa, Almus, Niksar, Başçiftlik, Reşadiye districts.
DISCUSSION
LOCCLIM was found successful to generate local climatic data that is suitable for mapping process. Produced results are in accordance with the general climatic characteristics that were explained by GDTSMS (2007). Moreover, the produced results improved the quality of climatic data that is far beyond from this general evaluations. Within the frame of general concepts, temperature varies with location and season and decreases 6.5°C per 1000 m increase in altitude on a global average (Lutgens and Tarbuck, 1995). Moreover, precipitation increases with higher elevations (Hevesi et al., 1992; Daly et al., 1994). The results of this study exposed that temperature values fit these general concepts. In another words, all temperature related variables (TEMP, TEMPMAX and TEMPMIN) decreased in higher elevations. On the other hand, precipitation variable showed different characteristics from the general concepts above and decreased in higher altitudes. This situation indicated that not only elevation but also some other geographic factors might be effective on the precipitation characteristics of the study area. It is thought that Canik Mountains between the Black Sea and Tokat province may leave the precipitation regime outside of this general concept, because it constitutes a natural barrier against the prevailing winds from the sea. Consequently, north aspects of the Canik Mountains receive the main part of precipitation and this condition decreases the amount of precipitation at the inner regions.
There is a positive relationship between air temperature and PET, because of a relation between temperature and the saturation vapor pressure of air (McCabe and Wolock, 2002). In this study, higher values of PET and WAP in hot summer season confirmed this concept (Fig. 3c). In addition, decreasing WAP in higher elevations (Fig. 5 and Table 1) indicated the reliability of WAP results. The PET values, however, did not suite this concept in some certain places such as Deveci and Asmalı mountains. The reliability of the produced PET values in these places is under question and this should be further investigated. Throughout the Yeşilırmak riverbed, WIND values increased from center to west. Considering physical topography of the area, the high values of WIND in these areas were found reasonable.
Overall results indicated that all climatic surfaces except PET (in some places) were found reasonable in this study. Without high station density, it is difficult to capture the spatial change of some climatic variables such as PET and PRECIP (Thomas and Herzfeld, 2004). Therefore, some of the discordances can be solved by adding more weather stations in the region and updating the database of LOCCLIM. In this way, the quality of the climatic raster maps can be improved in the future.
CONCLUSION
In this study, high resolution climatic surfaces that are highly important for ecological and agricultural studies in the Tokat province of Turkey were developed in raster format and presented to the users. This is the first time that the climate of Tokat was investigated in this manner. LOCCLIM showed good performance to produce the best estimates at the point base and fully developed GIS was effectively applied for the transformation process of climatic data from point to raster. Established climatic raster maps supplied valuable spatial data for modeling studies as well as good visualization. In this way, the value of the climatic data was increased. The overall results showed that some discordance could be appeared for some variables such as potential evapotranspiration in some places. However, these kinds of disagreements can be fixed by further investigations in the region and updating the climatic database of LOCCLIM.
| Appendix 1: | Annual distributions of temperature and precipitation variables in administrative districts of Tokat Province |
 | |
 | |
| Appendix 2: | Annual distributions of potential evapotranspiration, water vapor pressure, sunshine fraction and wind speed variables in administrative districts of Tokat Province |
 | |
 | |
REFERENCES
- Apaydin, H., F.K. Sonmez and Y.E. Yildirim, 2004. Spatial interpolation techniques for climate data in the GAP region in Turkey. Clim. Res., 28: 31-40.
Direct Link - Bradley, A.V., J.E. Thornes, L. Chapman, D. Unwin and M. Roy, 2002. Modelling spatial and temporal road thermal climatology in rural and urban areas using a GIS. Clim. Res., 22: 41-45.
Direct Link - Daly, C., R.P. Neilson and D.L. Phillips, 1994. A statistical-topographical model for mapping climatological precipitation over mountainous terrain. J. Applied. Meteorol., 33: 140-158.
Direct Link - Dogan, H.M., 2007. High resolution climatic surfaces of nallihan ecosystem in Turkey; a convenient methodology to create climate maps. J. Applied Sci., 7: 654-662.
CrossRefDirect Link - Gyalistras, D., 2003. Development and validation of a high-resolution monthly gridded temperature and precipitation data set for Switzerland (1951-2000). Clim. Res., 25: 55-83.
Direct Link - Hevesi, J.A., J.D. Istok and A.L. Flint, 1992. Precipitation estimation in mountainous terrain using multivariate geostatistics. Part I: Structural analysis. J. Applied Meteorol., 31: 661-676.
Direct Link - Holdaway, M.R., 1996. Spatial modeling and interpolation of monthly temperature using kriging. Clim. Res., 6: 215-225.
Direct Link - Jeffrey, S.J., J.O. Carter, K.B. Moodie and A.R. Beswick, 2001. Using spatial interpolation to construct a comprehensive archive of Australian climate data. Environ. Modell. Software, 16: 309-330.
CrossRefDirect Link - Jolly, W.M., J.M. Graham, A. Michaelis, R. Nemani and S.W. Running, 2005. A flexible, integrated system for generating meteorological surfaces derived from point sources across multiple geographic scales. Environ. Modell. Software, 20: 873-882.
Direct Link - Kurtzman, D. and R. Kadmon, 1999. Mapping of temperature variables in Israel: Comparison of different interpolation methods. Clim. Res., 13: 33-43.
Direct Link - Lee, E.H. and W.E. Hogsett, 2001. Interpolation of temperature and non-urban ozone exposure at high spatial resolution over the western United States. Clim. Res., 18: 163-179.
Direct Link - McCabe, G.J. and D.M. Wolock, 2002. Trends and temperature sensitivity of moisture conditions in the conterminous United States. Clim. Res., 20: 19-29.
Direct Link - Osterkamp, S., D. Kraft and M. Schirmer, 2001. Climate change and the ecology of the Weser estuary region: Assessing the impact of an abrupt change in climate. Clim. Res., 18: 97-104.
Direct Link - Patz, J.A. and J.M. Balbus, 1996. Methods for assessing public health vulnerability to global climate change. Clim. Res., 6: 113-125.
Direct Link - Semenov, M.A. and R.J. Brooks, 1999. Spatial interpolation of the LARS-WG stochastic weather generator in Great Britain. Clim. Res., 11: 137-148.
Direct Link - Svensson, M.K., I. Eliasson and B. Holmer, 2002. A GIS based empirical model to simulate air temperature variations in the Goteborg urban area during the night. Clim. Res., 22: 215-226.
Direct Link - Thomas, A. and U.C. Herzfeld, 2004. Regeotop: New climatic data fields for East Asia based on localized relief information and geostatistical methods. Int. J. Climatol., 24: 1283-1306.
Direct Link - Vicente-Serrano, S.M., M.A. Saz-Sanchez and J.M. Cuadrat, 2003. Comparative analysis of interpolation methods in the middle Ebro Valley (Spain): Application to annual precipitation and temperature. Clim. Res., 24: 161-180.
Direct Link