
Rui Hu
University of Science and Technology Beijing, Xueyuan Road, Hai Dian District, Beijing, China
Journal of Applied Sciences
Year: 2014 | Volume: 14 | Issue: 2 | Page No.: 151-157


ABSTRACT
In order to achieve energy conservation goals made in 2009 Climate Summit in Copenhagen, measures to realize low-carbon production in manufacture enterprises in China were studied. The establishment and application of low-carbon production evaluation system were introduced. The two main methods: Energy flow analysis and AHP (Analytic Hierarchy Process) were brought in to satisfy the target. The path of carbon travelling through the whole process was discussed. Also, a weighted indicator system based on the analysis of energy flow was constructed. A three layer framework considering five different aspects which pointed out a direction to achieve the energy-consumption goal was designed. The results showed that the system was available and the energy recycling was the most critical factor for the low-carbon production and also the most effective way for energy management to achieve its environment-friendly goal. Moreover, a practical example was given and the effectiveness of the evaluation system was verified.
PDF Abstract XML References Citation
Received: August 08, 2013;
Accepted: November 16, 2013;
Published: February 01, 2014
How to cite this article
Rui Hu, 2014. Low-Carbon Index System for Steel Firms Based on Energy Flow. Journal of Applied Sciences, 14: 151-157.
DOI: 10.3923/jas.2014.151.157
URL: https://scialert.net/abstract/?doi=jas.2014.151.157
DOI: 10.3923/jas.2014.151.157
URL: https://scialert.net/abstract/?doi=jas.2014.151.157
INTRODUCTION
Iron and Steel has always been the mainstay industry in China. It has experienced a rapid development in recent years: since the beginning of the 21st century, China’s steel production has been a leap in the number which was far beyond the United States and Japan. The national production of crude steel in 2012 reached 717 million tons and the year-on-year growth rate was 3.1% which ranked China the first in steel production for 16 consecutive years. The data indicated that while the production of crude steel kept growing steadily in the past several years, the energy consumption reached its peak at 2005 and after that, with the introduction of environmental policy, the strengthening of government regulation and companies’ awareness of energy saving and emission reduction, a downward trend turned up. But with the rising steel production and limited technology update speed, the rate of decline slowed down in the time period of year 2006-2009. This trend can be seen in Fig. 1.
It’s quite sure that the carbon emission will stay in high level in the foreseeable future because of the coal-based energy structure and urbanization in China. This is not an issue only in China, but a world-wide problem. So a scientific and effective evaluation system would be helpful for both companies and nations to control their own carbon emission levels.
Frohling et al. (2013) created an resource recycling evaluation system. The production data were taken from several Germany iron and steel companies. The result confirmed that there were still rooms for improvement of both energy efficiency and recycling.
Wall (1977) measured the energy consumption level in industry based on eco-thermo dynamics theory and a life-cycle curve of energy was given after the measurement. They compared the impacts brought by measurement applied in different stage of the life-cycle and pointed out that proper control exerted in the rapid growth period had better effect in carbon control than in other phase.
Some other academics did their work in macro-level. Wall (1990), Wall et al. (1994) and Schaeffer and Wirtshafter (1992) claimed that energy flow analysis had been used to evaluate energy conversion and utilization in Japan, Brazil and Italy.
The above studys were published in 1990's which established a good foundation for the following research on carbon control.
Scholars in China had also done lots of valuable works in this field. Yin Ruiyu has proposed that the three main functions of the steel mills were: The manufacture of iron and steel products, energy conversion, waste elimination, treatment and recycling (Yin, 2008). The energy conversion process was mainly about the chemical reaction of carbon in energy flow. The C element took part in the process in the form of coal and coke and dissipated as CO2. Another part of carbon became a component of the final product in the form of compound (Zheng, 2006).
The track of carbon went with the energy in synchronization in the entire process. With the progress of process, the energy moved like a water flow which formed the concept of energy flow. “Flow” is brought in to describe the dynamic feature of substance.
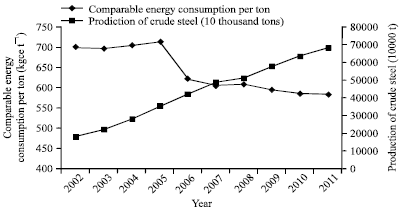 | |
| Fig. 1: | Trend of comparable energy consumption and production of crude steel in last ten years |
Studies (Bisio, 1993) that focused specifically on steel production processes had revealed the sources of energy losses and evaluated distinct technological alternatives to improve energy efficiencies and proposed some methods to improve the current situation by DEA tools (De Beer et al., 1998). The material flow and energy flow are integral: The material flow mainly focus on iron while the energy flow on carbon element (Costa et al., 2001). Researchers preferred to build “input-output” balance table to find out the relationship of the materials and emission.
As it was discussed above, the current research on low-carbon index system in iron and steel companies were based mainly on the technical data of production. There was no former example of an index system which built on the energy flow theory. This study applied the six types of energy flow proposed by Wang et al. (2006), to set a new system to determine the “Low-carbon level” and used it on a Chinese iron and steel companies.
MATERIALS AND METHODS
The energy flow stemmed from the ecology, where it was defined as the process of conversion, transferring and consumption of energy in the food chain and food webs in ecosystem. As for Iron and Steel companies, the movement of energy medium along the trajectory of conversion, consumption and discharge was called the energy flow (Cai et al., 2008). There were two major parts in the flow: the conversion part and the using part. The former part referred to the whole course of the energy going through a series of processing, conversion and modification into final energy products or emissions and the latter part was defined as the assignment of energy products to different individual users and the discharge as wastes.
Steel production was a complex process, mainly including: Mining→beneficiation→sintering→iron making→steel making→continuous casting→rolling processes. Most energy consumption and pollution happened in the first four steps.
According to the average energy consumption of key statistic enterprises, the processes of sintering, coking and blast furnace iron-making accounted for about 72% of the total energy consumption per among which the energy consumption of blast furnace iron-making ranked in the first place. Ton, From a global perspective, the CO2 discharged in steel production process occupied about 5 to 6% of the total emission (Xu, 2010). The following Fig. 2 showed the distribution of large-scale iron and steel enterprises in sub-process energy consumption from 2005 to 2010. In order to facilitate drawing, data was processed by logarithm. It can be seen from the Fig. 2 that the sintering, coking and the blast furnace process was ranked in the highest level of energy consumption while rolling in the second class. The converter, on the other hand, has achieved Negative Energy Steel-Making.
Energy analysis of each procedure: The following Table 1 showed the relationship between the production and comparable energy in the five steps respectively (on the premise that EAF were not under consideration).
Firstly, it could be seen from the Table 1, the comparable energy consumption and the crude steel production was negatively correlated which reflected the effect of the large-scale exerted in the energy control. Secondly, the comparable energy consumption was closely related to the five major processes, especially the converter and the coking.
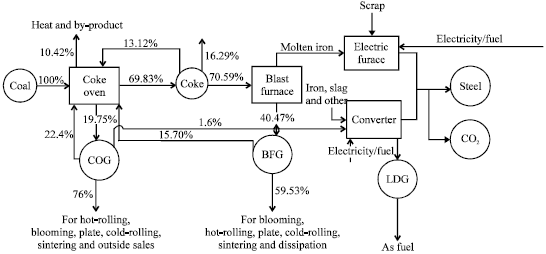
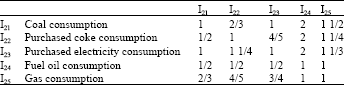
Throughout the process, different raw materials and fuel were used. According to the corresponding conversion coefficients provided by the annual energy balance table of a steel mills and the <Compilation of basic energy data> published by the National Development and Reform Commission in 1999, the emission of various types of raw materials, fuels and other combustible gases were shown below in Fig. 3.
| Table 1: | Relationship between production, energy consumption and procedures |
 | |
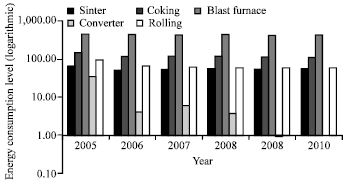 | |
| Fig. 2: | Sub-process energy consumption in iron and steel companies between 2005 to 2010, *data source: China iron and steel industry yearbook |
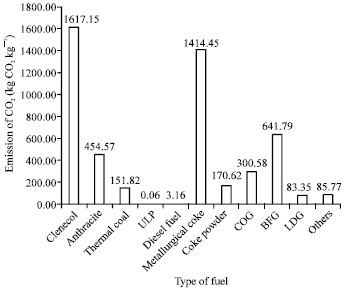 | |
| Fig. 3: | CO2 emission of eleven metallurgical common used fuels |
It can be seen from the Fig. 3 washed coal, metallurgical coke and blast furnace gas were the primary source of CO2 emissions. Washed coal was mainly used for the coking process, metallurgical coke in blast furnace iron-making and blast furnace gas was generated in the blast furnace iron-making and could be reused in the iron-making, coking, sintering process.
There were two types of carbon in the input direction: The raw material and fuel and generated gas. In the output direction, the carbon was briefly in form of the CO2 generated from both complete reaction and incomplete reaction, the intermediate product gas and carbon-contained products, such as coke, etc.
Energy analysis of entire process: From the view point of the system as a whole, all the carbon were inputted in the form of coal and ultimately discharged in the form of CO2. The basic process as well as intermediate products was shown in Fig. 4.
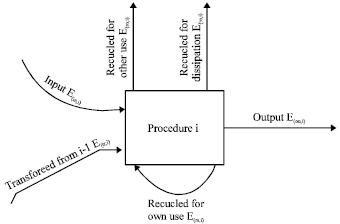
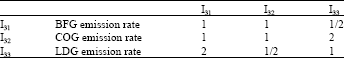
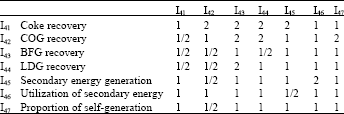
Cai Jiuju from the Northeastern University and his team proposed the six components of the energy flow of the iron and steel enterprises. In this study, E(X,i) represented the energy flow, wherein X represented the name and i represented the associated processes.
The six major components were: External input, incoming from the previous procedure, outgoing of present procedure, dissipation, recycling for self-use and recycling for other procedures’ use (Chen et al., 2007). As shown below in Fig. 5.
| E(in,i): | Energy for step I from outside of the system, including electricity, fuel, heat and steam. In kgce t-1 |
| E(tr,i): | Energy transferred from the previous procedure to step I, including chemical energy and heat. In kgce t-1 |
| E(rs,i): | Energy recycled for self-use in step I, including fuel, heat and power. In kgce t-1 |
| E(di,i): | Energy discharged in step I, including the heat dissipated in machine operation. In kgce t-1 |
| E(ro,i): | Energy which was recycled in step I and used in other steps, including steam, heat and electricity. In kgce t-1 |
| E(ou,i): | Energy carried away by products generated in step I, in kgce t-1: |
| (1) |
where, parts of E(tr,i) were from the previous step and parts of E(ou,i) were the input of the next step, so the input and output of the energy can be defined as E(i-1) and E(i).
 | |
| Fig. 4: | Energy flow in typical iron and steel companies, *data sources: China encyclopedia web: energy in iron and steel company. The flow and distribution of energy in steel joint venture |
 | |
| Fig. 5: | Composition of energy flow in iron and steel company |
The relation could be expressed as follows:
| (2) |
| (3) |
| (4) |
where U(i) contained two groups of variables: E(in,i) and E(rs,i) as group one which increased the amount of energy consumption in step I and were called positive controlling variables; E(di,i), E(rs,i) and E(ro,i) as group two which were called negative controlling variables.
Based on the analysis, the energy flow in the iron and steel enterprises can be divided into six categories in accordance with the actual production process. But from the research angles, these six categories could be grouped into several different major categories: From the influence aspect, they could be divided into positive variables and negative variables; from the perspective of energy flow, they could be divided into the input variables and output variables and so on.
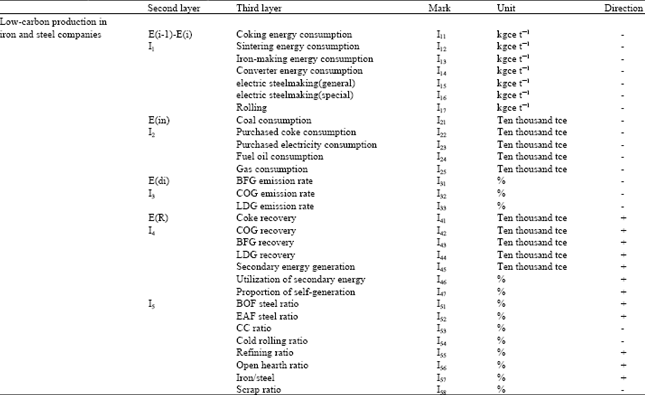
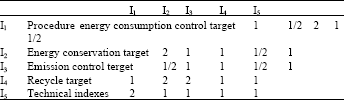
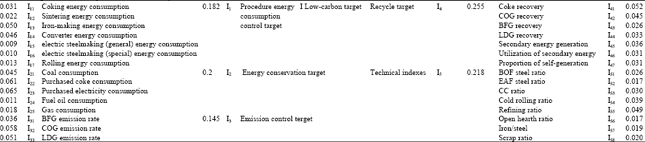
Design of the system: Based on the analysis in last chapter, the six types of energy flow could be classified into three categories: (1) The target for each procedure was to reduce the energy consumption of their own which meant to control E(i-1)-E(i). This was defined as “Target 1” which was called “procedure energy consumption control target” (2) The Iron and Steel company, as a whole, aimed at “energy conservation” which contained two aspects: to control E(in,i) and E(di,i). This was “Target 2” and also the “system energy conservation target” (3) To achieve the first two targets, recycling was an effective method which, correspondingly, referred to increase the amount of E(R) = E(rs,i)+E(ro,i). This was marked as “Target 3”.
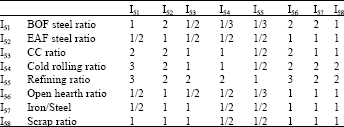
Besides, technical indicators also affected the company’s carbon emissions, so eight representative proportion indicators were selected. They were also incorporated into the index system which would be recorded as "Target 4".
Detailed index system and symbols are shown in Table 2.
The chapter 2.1 and 2.2 indicated that the influence of procedures’ energy consumption to total energy consumption was very obvious: the so-called procedures’ energy consumption meant the difference of the input and output of a certain step, corresponding to I1. According to the data of the original fuel CO2 diffuse map, how the consumption and recycling of raw materials and fuel would impact the low-carbon target could be seen clearly.
| Table 2: | Evaluation system for iron and steel enterprises in low-carbon modes |
 | |
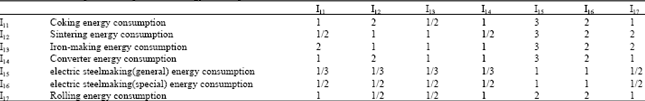
| Table 3: | Relative Importance of procedure energy consumption index |
 | |
| Table 4: | Relative importance of system conservation index |
 | |
| Table 5: | Relative Importance of Emission index |
 | |
Their consumption, emission and recycling levels, respectively, corresponded to the target I2, I3 and I4. Plus, the ratio indicator corresponded to I5.
On this basis, 30 third layer indicators were selected to make sure the evaluation’s comprehensiveness. Among them, there were 18 "negative" indicators, that is, the smaller the index value was, the greater the contribution to the overall goal was; another 12 were "positive" indicators, that is, the larger the index value was, the greater the contribution was (Fu et al., 2010).
Calculation of the weights: After the construction of the basic framework for the evaluation index system, AHP method was brought in to calculate the relative weights of the indicators (Zhang et al., 2009). Weight matrix was created based primarily on the 2010's energy balance table of a steel mill and the main procedure’s benchmark value of steel industry published in 2010. Also, experts’ advices were critical to the weights.
The weights matrixes were listed below (Table 3-8).
The validity of the matrix needed to be determined by consistency test. Generally, it was accepted when the number was less than 0.1 (Feng, 2010) and the numbers here were 0.0427, 0.015, 0.073, 0.055 and 0.041 which were all smaller than 0.1. This means that the five matrix all meet the conformance requirements.
| Table 6: | Relative importance of recycle index |
 | |
| Table 7: | Relative importance of technical index |
 | |
| Table 8: | Relative importance of secondary indexes |
 | |
| *In Table 3-8, Ipq has the same meaning as it in Table 2 which means p refers to the category of second layer of index and q refers to the category of third layer of index | |
Therefore, the index system could be given in Table 9.
Table 4 revealed that I4 was the more critical indicator to I. That is to say, the amount of energy recovery was the key factor to low-carbon production; technology related indicators and raw material and fuel consumption almost equaled in the effect; the procedures’ energy consumption and gas emission rates were basically on the same level of impact.
As for the secondary level of indicators, the five most significant factors were: Converter energy consumption, the consumption of purchased electricity, coke oven gas emission rate, recycled coke and secondary refining rate.
RESULTS AND DISCUSSION
The production data of iron and steel companies were usually confidential. The study had managed to obtain the data of one Chinese company, whose name would be replaced by “A”, to verify the validity of the index system. The value of the parameters had been processed by “ln” to make the calculation more clear.
To maintain the secrecy of the company data, the detailed value would not be listed here. According to the calculation results, it could be seen that the low-carbon level of company A is 0.75 out of 1 which meant that A had accomplished 75% of total carbon control potential.
| Table 9: | Weighted low-carbon production evaluation system |
 | |
This was good but far from enough. There were still lots of work to do for A, like improving the percentage of electric steel and scrap.
The study support the idea of Frohling et al. (2013) which claimed that there were considerable room there for energy recycling in metallurgical industry in Germany. It could be seen that China had the same potential. And the classification of energy proposed by Wang et al. (2006) and Cai et al. (2008) which was the theoretical foundation of this research, had been extended and refreshed from a brand new view-point into four interconnected targets.
The study established the low-carbon evaluation index system from the energy flow aspect. The system covered five factors which were closely correlated to the real production process in iron and steel companies: The procedures’ energy consumption, energy input, energy dissipation, energy recovery and energy-related technical indicators.
CONCLUSION
On the basis of analyzing six kinds of energy flows, the low-carbon evaluation index system based on AHP was designed and implemented. The AHP analysis proved that recycling indexes were the most critical indicators in carbon control which has the weight of 0.255. And technical index was the second important indicator with the weight of 0.218. The experiment results showed that the system was effective and objective. Thusly, this study has certain theory and application value.
ACKNOWLEDGMENTS
Firstly, I would like to show my deepest gratitude to my supervisor, Prof. Zhang Qun, a respectable, responsible and resourceful scholar who has provided me with valuable guidance in every stage of the writing of this thesis. And I shall extend my thanks to the National Nature Science Foundation of China who supported this study with funding (71172168).
REFERENCES
- De Beer, J., E. Worrell and K. Blok, 1998. Future technologies for energy-efficient iron and steel making. Ann. Rev. Energy Environ., 23: 123-205.
CrossRef - Bisio, G., 1993. Exergy method for efficient energy resource use in the steel industry. Energy, 18: 971-985.
CrossRefDirect Link - Costa, M.M., R. Schaeffer and E. Worrell, 2001. Exergy accounting of energy and materials flows in steel production systems. Energy, 26: 363-384.
CrossRefDirect Link - Frohling, M., F. Schwaderer, H. Bartusch and F. Schultmann, 2013. A material flow-based approach to enhance resource efficiency in production and recycling networks. J. Ind. Ecol., 17: 5-19.
CrossRef - Schaeffer, R. and R.M. Wirtshafter, 1992. An exergy analysis of the Brazilian economy: From energy production to final energy use. Energy, 17: 841-855.
CrossRefDirect Link - Wall, G., E. Sciubba and V. Naso, 1994. Exergy use in the Italian society. Energy, 19: 1267-1274.
CrossRefDirect Link