
Kalaimany Arumuggam
Department of Electrical and Electronic Engineering, Universiti Teknologi PETRONAS, Tronoh, Perak, Malaysia
Balbir Singh Mahinder Singh
Department of Fundamental and Applied Sciencesm, Universiti Teknologi PETRONAS, Tronoh, Perak, Malaysia
Journal of Applied Sciences
Year: 2013 | Volume: 13 | Issue: 6 | Page No.: 869-875


ABSTRACT
Intermittent nature of solar and wind resources have been the main problem associated to power generation from both the sources. Integrating solar with wind generation system through proper sizing analysis will be able to produce a sustainable and reliable output from the system. Sizing analysis needs to be performed for the components in the system design such as PV panels, wind turbines, charge controllers, batteries and inverters. This study explains the development of a sizing analysis software for a PV and wind integrated hybrid generation system. Sizing analysis for the hybrid generation system in this study incorporates a novel design of a sun tracking system. Experiments performed to validate the performance of different types of sun trackers proved that a two-axis sun tracker performs better than a fixed solar panel and a one-axis sun tracker. However it was also found that two-axis sun trackers are not suitable for large scale electricity generating system in Malaysia due to the location which is at the equator. The sizing analysis was verified by developing and testing a 12 V hybrid PV and wind generating system for an AC load of 85 Wh and DC load of 45 Wh with a storage capacity of 100 Ah at 50% Battery Depth of Discharge (DOD) for 3 days of storage. The sizing analysis explained in this study takes into account the available resource on weekly average at the location and load demand need to be performed to make the hybrid generation system more sustainable.
PDF Abstract XML References Citation
Received: February 24, 2013;
Accepted: June 17, 2013;
Published: July 19, 2013
How to cite this article
Kalaimany Arumuggam and Balbir Singh Mahinder Singh, 2013. Optimization of Hybrid Solar and Wind Power Generation. Journal of Applied Sciences, 13: 869-875.
DOI: 10.3923/jas.2013.869.875
URL: https://scialert.net/abstract/?doi=jas.2013.869.875
DOI: 10.3923/jas.2013.869.875
URL: https://scialert.net/abstract/?doi=jas.2013.869.875
INTRODUCTION
Hybrid generation systems increase the reliability and sustainability of off-grid power generation systems. In Malaysia, the setting up of the 100 kW solar, wind and diesel hybrid system in Pulau Perhentian Kecil is an example of off-grid power generation system. By integrating the solar and wind generator with the diesel generator, the reliability of electricity generation in the island was increased (Darus et al., 2009). Sizing optimization for hybrid solar and wind power generation system ensures the system built is with minimum cost and able to meet the load demand. The sizing analysis explained in this study uses an iterative technique to calculate the size of components such as PV panels, wind turbines, charge controllers, batteries and inverters to be used in the hybrid generation system design. System reliability and system cost is the most important parameters that need to be taken into account in sizing optimization for hybrid PV and wind generation systems (Kaabeche et al., 2011; Zhou et al., 2010).
There are several other optimization techniques for hybrid PV and wind generation systems such as dynamic programming, graphical construction techniques, multi-objective designs and artificial intelligence methods (Zhou et al., 2010). A dynamic programming model sizing optimization technique presented by Musgrove (1988) determines the optimal operating strategies for a hybrid PV and wind generation system and an auxiliary diesel generator. The techniques takes into account the average daily cost to satisfy an electric load profile. Another hybrid PV and wind system optimization method presented by Kaabeche et al. (2011) uses an iterative optimization technique to follow the deficiency of power supply probability model and the levelised unit electricity cost model for system power and system cost reliability.
The objectives of this study are to develop a software that can optimize hybrid solar and wind electricity generating systems and to build an optimum sized hybrid solar and wind generator for sustainable electricity generation. The project objectives will be achieved by performing several experiments to obtain data for the software to be designed. A single axis tracker and a dual axis tracker were built to compare the electricity generated from both the systems. The hybrid generator sizing software will increase accuracy of sizing analysis for hybrid wind and solar generators. The reason is the availability of solar and wind resources at the location where the generator will be used will be obtained for 7 days on hourly basis to get the weekly average and included in the sizing analysis. Total load demand also will be observed on hourly basis to obtain the maximum and minimum value and also the weekly average value and included in the sizing analysis.
THEORETICAL DEVELOPMENT
The hybrid generating system design will consist of the following components that can be seen in Fig. 1 (Kaabeche et al., 2011). The sizing software developed will run several analysis to make sure the components used in the hybrid generating system design is in the optimum size taking into account the total load to be powered and also wind and solar resource data at the region where the system will be used. The steps to calculate size of all the components in the generator can be seen in the flow chart in Fig. 2. The analysis performed by the software can be divided into 8 parts as the following:
| • | Resource data analysis |
| • | Total daily load demand and corrected load demand analysis |
| • | Battery size analysis |
| • | Power generation ratio analysis |
| • | Solar panel power rating analysis |
| • | Wind generator rating analysis |
| • | Charge controller analysis |
| • | Inverter analysis |
 | |
| Fig. 1: | Components in a hybrid solar and wind system (Kaabeche et al., 2011) |
 | |
| Fig. 2: | Sizing analysis steps taken to calculate size of each component used in a hybrid solar and wind generation system (Mousazadeh et al., 2009) |
Resource data analysis: The availability of solar and wind resource at the location where the generator will be used need to be obtained for 7 days on hourly basis to obtain the weekly average value. The analysis performed will calculate average wind speed, global insolation, direct insolation and diffuse insolation according to the hourly global insolation data input by the user.
Total daily load demand and corrected load demand analysis: AC load and DC load on hourly basis in a day that will be powered by the hybrid generator are required input by the user. The total daily load demand will be calculated according to Eq. 1. Corrected load demand is the power to be generated by the hybrid generator to power the load taking into account the losses from the other components used in the design. Efficiency of battery, wiring and charge controller will be used to calculate the corrected load demand as shown in Eq. 2 (Sandia National Laboratories, 1995):
| (1) |
| (2) |
| Where: | ||
| Ptotal | = | Total daily load demand (Wh) |
| PAC | = | Total AC load (Wh) |
| PDC | = | Total DC load (Wh) |
| ήinv | = | Inverter efficiency |
| Pc | = | Corrected load demand (Wh) |
| Pwiring | = | Power losses from wiring |
| Pcharger | = | Power losses from charge controllers |
| Pbettery | = | Power losses from battery |
Battery size analysis: Batteries are needed to store energy during excess energy generation to be supplied to the load when generation is low. Battery size depends on the Depth of Discharge (DOD) of the battery and the number of power storage days when generation is zero. Battery voltage or the system voltage selection depends on the total load demand of the system according to Table 1. The analysis will take into account the user input on the days of storage needed and also battery DOD.
| Table 1: | Battery voltage selection criteria for the hybrid generating system which depends on the total load demand (Sandia National Laboratories, 1995) |
 | |
Deep cycle batteries can be discharged until 80% of the battery capacity but to preserve battery life, the battery DOD is best set at 50% (Moseley, 1996; Sandia National Laboratories 1995). Equation 3 and 4 will be used to calculate battery capacity in watt hour and ampere hour:
| (3) |
| (4) |
| Where: | ||
| CB(Wh) | = | Battery capacity (Wh) |
| CB(Ah) | = | Battery capacity (Ah) |
| Ptotal | = | Total daily power demand (Wh) |
| SD | = | Number of storage days |
| BDOD | = | Depth of discharge of battery |
| VB | = | Battery voltage |
Power generation ratio analysis: Power generation ratio by the solar and wind generator is an input by the user. The ratio depends on the quantity of available resource in the area the generator is built. If the area receives more sunlight than wind speed, the ratio of power generated by the solar generator will be higher than the wind generator. Equation 5 and 6 is used to calculate the total power generated by the solar based generator and total power generated by the wind based generator:
| (5) |
| (6) |
| Where: | ||
| Pwind | = | Power generated from wind generator (Wh) |
| Psolo | = | Power generated from solar generator (Wh) |
| Rw | = | Ratio of wind generation |
| Rs | = | Ratio of solar generation |
| PC | = | Corrected load demand (Wh) |
Solar panel power rating analysis: The power rating of the solar panels depends on the ratio of solar generation and total peak sun hours in a day. Peak sun hour is the number of hours in a day where an average of 1000 W m-2 of solar irradiance is received. The recorded average peak sun hour for Malaysia is around 4.37 h (Daut et al., 2011). Equation 7 is used to calculate the solar panel power rating required for the design:
| (7) |
| Where: | ||
| Prating | = | Solar panel power rating (W) |
| Psolor | = | Power generated from solar generator (Wh) |
| psh | = | Peak sun hour (hours) |
Wind generator rating analysis: Friction and mechanical losses in the wind generator need to be taken into account when the generator rating is analysed. Equation 8 and 9 is used to calculate the wind generator power rating and swept area of the wind turbine (DNV and Riso, 2002):
| (8) |
| (9) |
| Where: | ||
| Wrating | = | Wind generator power rating (W) |
| ηg | = | Wind generator efficiency |
| P | = | Air density (kg m-3) |
| A | = | Swept area (m2) |
| V | = | Wind speed (m sec-1) |
Charge controller analysis: Charge controllers or also known as power conditioners are used to protect batteries from over charging, under charging and also to maintain flow of electricity to the load. Output voltage of the charge controller must be the same with the battery voltage and charging current must be able to support minimal current from the generators. Equation 10 and 11 is used to calculate the charge controller size in amps for the solar and wind generator:
| (10) |
| (11) |
| Where: | ||
| Cs | = | Solar charge controller current rating (A) |
| Cw | = | Wind charge controller current rating (A) |
Inverter analysis: Inverter is required to have an AC power output from the system. Minimum AC power output from an inverter must be able to handle surge capacity three times the maximum AC load demand. Equation 12 is used to calculate minimum inverter power:
| (12) |
| Where: | ||
| Pinv | = | Minimum inverter power rating (W) |
| PAC-Max | = | Maximum AC load power (W) |
RESULTS AND DISCUSSION
Experiment results on performance of tracking system: Experiments are carried out to compare the performance of the solar tracker with one axis tracking system, two-axis tracking system and a fixed solar panel as a control. Each tracking system is installed with a 6 V, 3 W solar panels. Comparison between the generations of power of the three systems are made by measuring the short circuit current of the solar panels using a current sensor collected by an electronic data acquisition system. The difference between the generations of the systems are needed as in the sizing software developed, there are options for solar tracking system to be selected by the user. The experiment to compare the performance of one-axis tracking system, two-axis tracking system and a fixed solar panel as the experiment control was done on a typical cloudy day in Universiti Teknologi PETRONAS (UTP). The experiment was done from 8.00 a.m. till 6.00 p.m. Figure 3 shows the short circuit current generated by the fixed solar panel which acts as the control of the experiment, one-axis tracker and two-axis tracker. The control in the experiment starts to generate about 0.025 A of current at the moment the experiment was started at 8.00 a.m. whereas both the solar trackers start at current generation of about 0.05 A. It can be observed that the current for all three systems gradually rises until about 10.00 a.m. and decreases gradually after that period. The highest value of current generated by the fixed solar panel at that period is about 0.052 A whereas the highest value of current generated by the one-axis tracker and two-axis tracker are 0.13 and 0.21 A, respectively. Current generation reduces gradually at that period due to decrease in the solar irradiance at the earth’s surface due to passing clouds. The peak current for all the systems at the day was at about 12.00 p.m.
 | |
| Fig. 3: | Short circuit current generated by the 3W, 6V solar panels attached to the two-axis tracker, one-axis tracker and fixed solar panel |
 | |
| Fig. 4: | Angle of incidence, θ of solar radiation (Mousazadeh, 2009) |
The control of the experiment peaks at about 0.072 A whereas the one-axis tracker and two-axis trackers peaks at about 0.21 and 0.32 A. The current generated for all the systems at this period is the highest because the sun is at the highest elevation in the sky and the sun rays have the shortest path to reach the earth’s surface through the atmosphere. After noon, the current generation reduces and rises again at about 3.00 p.m.
The apparent trajectory of the sun which varies with position and time makes sun tracking an essential method to increase power gain from solar power generating systems. The incidence angle between the incident solar insolation and PV module are minimized by sun tracking systems resulting in higher solar power gain (Singh et al., 2012; Poulek and Libra, 1998) Figure 4 shows the angle of incidence, θ of solar radiation and the higher the angle, the lower is the solar power gain. In a two-axis solar tracker, the angle of incidence θ are maintained at an optimum perpendicular angle to the solar radiation at all times which maximizes the power gain (Mousazadeh et al., 2009). The two-axis tracker has a power gain of about 18 to 25% higher compared to the one-axis tracker. The location of Malaysia at the equator at about 4°N makes a two-axis tracking system not suitable for large scale electricity generation and the best would be a one-axis tracking system.
Sizing software descriptions: The sizing software is developed using Visual Basic 2010 Software Development Tool. The software developed needs the user to input the following data to perform the sizing analysis:
| • | Sun insolation and wind speed data for 7 days (hourly) |
| • | Load to be powered |
| • | Generation ratio |
| • | Battery, charge controller and inverter details |
The analysis performed by the sizing software will output the following:
| • | Total power demand and corrected load demand |
| • | Required PV cell specifications |
| • | Required wind turbine specification |
| • | Required charge controller specifications |
| • | Required battery bank specifications |
| • | Required inverter specifications |
Figure 5 shows the main input window for the sizing analysis software where the resource type are selected and system details are input by the user and Fig. 6 shows the final output window where system details will be shown after the sizing analysis have been performed by the software.
Hybrid generator assembly and testing: The software developed was used to size a hybrid solar and wind generator with a 12 V configuration to power an AC load of 85 Wh and DC load of 45 Wh incorporated with a one axis solar tracker. Table 2 shows the specifications of the components used for the hybrid solar and wind generating system. The hybrid generating system consists of a 50 W solar based generation system and a 50 W wind based generation system.
| Table 2: | Hybrid solar and wind generating system specification of the system that was built and tested |
 | |
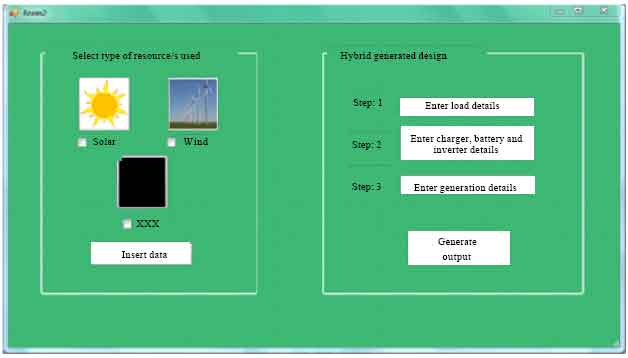 | |
| Fig. 5: | Main input window for the sizing analysis software where the user selects the resource type and the component details of the hybrid generating system |
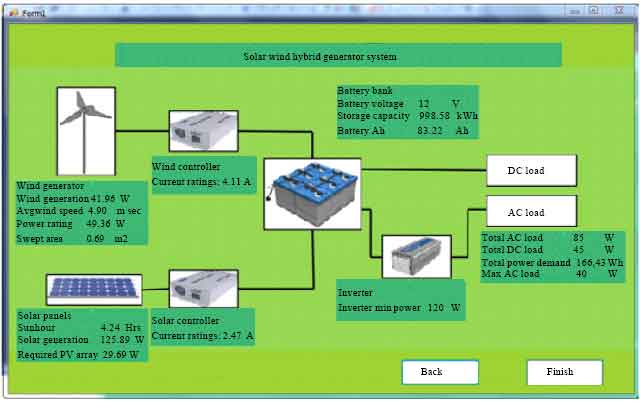 | |
| Fig. 6: | Final output window where the size of all the components to be used in the hybrid generating system are shown to the user after completion of the analysis |
| Table 3: | Performance of the hybrid generating system at different solar insolation and wind speed |
 | |
The system built has a storage capacity of 100 Ah at 50% battery DOD for 3 days of storage, thus the system was able to sustain the load for 3 days if there is no any sun light or wind without deep discharging the deep cycle battery. The wind turbine used was a horizontal axis wind turbine with a swept area of 0.6 m2. The solar and wind charge controllers have current rating of 5 A.
Table 3 shows the hybrid generating system performance at different wind speed and solar insolation. The charge controllers holds the battery charging voltage constant at about 13.4 A to prevent the battery from being overcharged. The average voltage and average current generated by the solar generation system increases with solar insolation value. The highest solar insolation value the system was tested is at 700 W m-2. The wind for the testing was produced from a 160 W blower. The wind generator was tested at maximum wind speed of about 3.5 m sec-1 and minimum wind speed at about 2.5 m sec-1. Average voltage and average current generated by the wind generator increases with wind speed.
Sizing analysis for the hybrid solar and wind generator are performed using resource data collected on hourly basis for 7 days to obtain the weekly average value in the location where the generator will be developed. Hourly solar radiation data and wind speed data used in sizing analysis will produce the most optimum size of components to be used in the design. An optimally sized solar and wind hybrid generating system would be the best generation system in Malaysia as generating systems with single energy source has disadvantages. Sunlight is only available in the day and average wind speed in Malaysia which is at about 3-5 m sec-1 are not sufficient for a wind generation system alone (Shafie et al., 2011; Hasan et al., 2011).
CONCLUSION
Proper sizing analysis can eliminate the intermittent nature of wind and solar resource. The hybrid generating system sizing software development explained in this study will be able to make solar and wind electricity more sustainable. The software developed for the sizing analysis uses an iterative method where daily average sun insolation and wind speed on hourly basis makes a reliable sizing calculation for the components to be used in the hybrid generation system. The hybrid solar and wind generating system developed is able to sustain an AC load of 85 Wh and DC load of 45 Wh with 3 days of storage and 50% battery depth of discharge. The recommended future work for the software developed would be incorporating the sizing analysis software together with a real time hybrid PV and wind generation system performance monitoring system. The user interactive system will be able to assist home users and industry based users to set up and monitor their hybrid PV and wind generation system.
ACKNOWLEDGMENT
The authors are grateful to Universiti Teknologi PETRONAS for the support given in completing this research project.
REFERENCES
- Darus, Z.M., N.A. Hashim, S.N.A. Manan, M.A.A. Rahman, K.N.A. Maulud and O.A. Karim, 2009. The development of hybrid integrated renewable energy system (wind and solar) for sustainable living at Perhentian Island, Malaysia. Eur. J. Social Sci., 11: 198-204.
Direct Link - Kaabeche, A., M. Belhamel and R. Ibtiouen, 2011. Sizing optimization of grid-independent hybrid photovoltaic/wind power generation system. Energy, 36: 1214-1222.
CrossRef - Zhou, W., C. Lou, Z. Li, L. Lu and H. Yang, 2010. Current status of research on optimum sizing of stand-alone hybrid solar-wind power generation systems. Applied Energy, 87: 380-389.
CrossRefDirect Link - Daut, I., M. Irwanto, Y.M. Irwan, N. Gomesh and N.S.A. Rosnazri, 2011. Potential of solar radiation and wind speed for photovoltaic and wind power hybrid generation in Perlis, Northern Malaysia. Proceedings of the 5th International Power Engineering and Optimization Conference, June 6-7, 2011, Shah Alam, Selangor, pp: 148-153.
CrossRef - DNV. and Riso, 2002. Guidelines for Designs of Wind Turbines. 2nd Edn., Det Norske Veritas and Riso National Laboratory, Copenhagen, AZ., USA., ISBN: 87-550-2870-5.
Direct Link - Singh, B.S.M., M.S. Abu Bakar, N.M. Nor and N.A. Zainal, 2012. Development of two-axos sun tracking system. AIP Conf. Proc., 1482: 183-187.
CrossRef - Mousazadeh, H., A. Keyhani, A. Javadi, H. Mobli, K. Abrinia and A. Sharifi, 2009. A review of principle and sun-tracking methods for maximizing solar systems output. Renew. Sustainable Energy Rev., 13: 1800-1818.
CrossRef - Shafie, S.M., T.M.I. Mahlia, H.H. Masjuki and A. Andriyana, 2011. Current energy usage and sustainable energy in Malaysia: A review. Renew. Sustainable Energy Rev., 15: 4370-4377.
CrossRefDirect Link