
Kefeng Xiao
Laboratory of Bio-pharmacy of Agricultural, College of Chemistry and Pharmaceutical Science, Qingdao Agricultural University, Qingdao, 266109, China
Zhihui Hao
Laboratory of Bio-pharmacy of Agricultural, College of Chemistry and Pharmaceutical Science, Qingdao Agricultural University, Qingdao, 266109, China
Dedong Hu
The College of Electromechanical Engineering, Qingdao University of Science and Technology, Qingdao, 266061, China
Leilei Wang
Laboratory of Bio-pharmacy of Agricultural, College of Chemistry and Pharmaceutical Science, Qingdao Agricultural University, Qingdao, 266109, China
Journal of Applied Sciences
Year: 2013 | Volume: 13 | Issue: 5 | Page No.: 722-728


ABSTRACT
Solution Enhanced Dispersion by Supercritical fluid (SEDS) process is utilized more and more widely for preparing nano-drug. Nozzle is the key component in SEDS process. In this study, the flow in jet-swirl nozzle for preparing nano-drug in SEDS process was analyzed by Computational Fluid Dynamics (CFD). It can be concluded from the results that the jet mixing length was found to be a strong function of the volume flow of supercritical CO2 (SC-CO2) at the inlet of the swirl chamber. When the volume flow of SC-CO2 was equal to or greater than 25 mL min-1, methylene chloride and SC-CO2 mixed completely in the nozzle. These results were coincident with the results obtained from experiments in literature. In additional, it also was indicated that the turbulent intensity at the outlet was all even in different volume flow of SC-CO2 and with the increase of volume flow of SC-CO2, the turbulent intensities at the outlet become greater and greater. These results were similar with the results obtained from experiments in literature. By these CFD analysis and comparison with literature, the flow parameters in jet-swirl nozzle were revealed and the method of CFD analysis for SEDS process was validated.
PDF Abstract XML References Citation
Received: February 02, 2013;
Accepted: March 20, 2013;
Published: June 28, 2013
How to cite this article
Kefeng Xiao, Zhihui Hao, Dedong Hu and Leilei Wang, 2013. CFD Simulation of the Flow in Jet-swirl Nozzle for Preparing Nano-drug During a SEDS Process. Journal of Applied Sciences, 13: 722-728.
DOI: 10.3923/jas.2013.722.728
URL: https://scialert.net/abstract/?doi=jas.2013.722.728
DOI: 10.3923/jas.2013.722.728
URL: https://scialert.net/abstract/?doi=jas.2013.722.728
INTRODUCTION
A novel technique called solution enhanced dispersion by supercritical fluid (SEDS) has been utilized more and more widely for the purpose of nano-drug preparation. Mixing configuration is of importance for SEDS process and various structures for mixing the solvent and SCF have been used in literatures. These structures include capillary injection tubes (Reverchon et al., 2000), coaxial nozzles (Baldyga et al., 2010), sonicated nozzles (Subramaniam, 1998), jet-swirl nozzle (Jarmer et al., 2003), prefilming atomizer (He et al., 2004) and Tangential-inlet Swirl Nozzle (Xiao and Ma, 2007). In order to control the kinetics of the phase transition and Produce a Sharp (PSD) during SEDS process, two conditions must be met. First, there must be uniform conditions within the nucleating medium (Thiering et al., 2001). Uniform conditions in the nucleating medium can be realized by perfect fluid mixing, resulting in a single supersaturation level and a homogeneous nucleation rate. Secondly, each critical nucleus formed should experience the same amount of time for particle growth. Utilizing mixing configurations that optimize gas-like mixing should allow for control over the level and homogeneity of supersaturation, provide control of the mean particle residence time; and ultimately give control of the resulting particle size and size distribution. All of above-mentioned mixing configurations are merely verified meeting these conditions. Especially, jet-swirl nozzle has been verified by experiments that it allows for the production of nanoscale particles with a smaller average particle diameter and a sharper size distribution than conventional SEDS nozzle designs (Jarmer et al., 2003). However, the internal flow of jet-swirl nozzle is still obscure. The internal flow of the nozzle is very complex since it involves the coupling of thermodynamics, hydro dynamics, mass transfer and precipitation kinetics, making it difficult to elucidate the underlying mechanisms that control particle size and size distribution during SEDS processing. Experiment study can not entirely reveal these mechanisms. In this study, CFD Simulation was utilized to simulation the flow in jet-swirl nozzle for preparing nano-drug during a SEDS process.
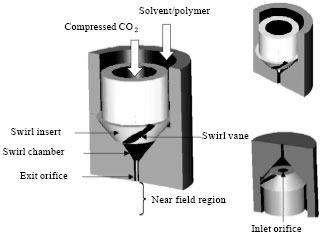 | |
| Fig. 1: | Schematic that illustrates the structure of the jet-swirl nozzle (Jarmer et al., 2003) |
CFD SIMULATION
Nozzle structures and computational domain modeling: Jarmer et al. (2003) designed and manufactured jet-swirl nozzle, as shown in Fig. 1. The jet-swirl nozzle, designed especially for the SEDS process, uses a swirling flow to optimize gaseous mixing between the solvent and antisolvent in a micro-mixing volume. A unique feature of this jet-swirl nozzle design is that mixing of the jets occurs within the confines of the nozzle, allowing for precise mixing of the fluids in the desired proportions. The nozzle is a combination of two separate atomizers, a plain orifice pressure atomizer and a pressure swirl atomizer.
The unique combination of an ordinary orifice pressure atomizer and a pressure swirl atomizer into one nozzle allows for one fluid to flow as a solid co-axial jet and the other as a swirled annular jet that surrounds the axial jet. The hydrodynamics in the jet-swirl nozzle consist of a solvent/polymer solution entering a swirl chamber through an axial inlet vane, inclined at an angle relative to the central axis of the swirl chamber. Fluid that flows through this inlet vane enters the swirl chamber with three velocity components, (i.e. tangential, axial and radial). SCF is injected axially into the swirling flow at the upstream surface of the swirl chamber, through an axial inlet orifice. These jets mix in the swirl chamber, the discharge orifice and in the near field region characterized by the first few nozzle diameters downstream of the discharge orifice. Intense, homogenous gaseous mixing of the two jets occurs when the jets interact, generating supersaturation and therefore particle precipitation (Jarmer et al., 2003).
The 3D geometrical computational domain of jet-swirl nozzle under consideration for CFD simulation is shown in Fig. 2. The dimensions of the nozzle are the same as what mentioned in literature (Jarmer et al., 2003).
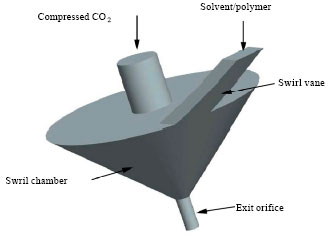 | |
| Fig. 2: | 3D geometrical computational domain of jet-swirl nozzle |
The diameter of swirl insert tip is 0.8 mm; the diameter of inlet orifice is 0.3 mm and the diameter of exit orifice is 0.1 mm. Swirl chamber volume is 0.07 mL.
Governing equations: In the CFD simulation, both SCF and solution phases are treated in an Eulerian framework. The SCF phase is considered as the primary phase, whereas the solution phase is considered as secondary or dispersed phase. The solution phase is characterized by a conductivity, a viscosity, a thermal conductivity and a specific heat.
The continuity equation for phase I is defined as Eq. 1 (Leybros et al., 2012):
| (1) |
where, ![]() is the velocity of phase i and
is the velocity of phase i and ![]() characterizes the mass transfer from the pth phase to ith phase.
characterizes the mass transfer from the pth phase to ith phase.
The momentum balance for phase i yields Eq. 2 (Leybros et al., 2012):
 | (2) |
where, ![]() is the ith phase stress strain tensor,
is the ith phase stress strain tensor, ![]() is an external body force,
is an external body force, ![]() is a lift force,
is a lift force, ![]() is a virtual mass force,
is a virtual mass force, ![]() is an interaction force between phases and P is the pressure shared by all phases.
is an interaction force between phases and P is the pressure shared by all phases. ![]() is the interphase velocity. If
is the interphase velocity. If ![]() and if
and if ![]() .
.
Numerical scheme: In this CFD simulation, the flow through the jet-swirl nozzle was simulated utilizing a commercial CFD code: Fluent which solves the classical mass, momentum and energy conservation equations to describe the fluid behavior and properties.
In SESD process, the fluid parameters are independent with time (Liu et al., 2011), therefore the turbulent flow through the nozzle can be regarded as 3D and steady state flow. To model precipitation in a two-phase system, Eulerian model was selected as Multiphase Model and both of SCF and solution were treated as continuum phases. The realizable k-ε turbulence model was employed with standard wall functions to calculate turbulent flow. The first order upwind discretization schemes were selected to solve the momentum, the volume fraction, the turbulence and the energy equations. Pressure-velocity coupling was achieved using the phase coupled SIMPLE algorithm.
Materials and operating parameters: Methylene chloride and SC-CO2 were selected as solvent and anti-solvent respectively for this simulation, which is consistent with literature (Jarmer et al., 2003). Because the solute contained in the solution was relatively slight, the impact of the solutes on the nature of the solution was ignored (Liu et al., 2011), consequently there were two kind of fluid in the nozzle and they were introduced from two inlets, respectively. SC-CO2 was the primary phase and methylene chloride was the secondary phase. Although a supercritical fluid was commonly as associated to a compressible fluid, the system was considered as incompressible in order to develop CFD simulations (Leybros et al., 2012; Moussiere et al., 2012). All fluid variations were considered to be isobaric at 8.5MPa. The physical properties of materials such as density, viscosity, thermal conductivity, standard state enthalpy, were inputted. The operating pressure was default and the gravitational acceleration was taken into account.
Boundary conditions: For the jet-swirl nozzle, as shown in Fig. 1, the inlet of CO2 was inlet1 and the inlet of solvent was inlet2. In this study, a series of simulations with different volume flow of SC-CO2 were conducted. The values of volume flow of SC-CO2 were as follow: 15, 20, 25, 30 and 35 mL min-1. For the boundary condition of inlet1, a simple mass flow inlet was selected and allowed to specify mass flow and temperature of SC-CO2, turbulent kinetic energy, turbulent dissipation rate and initial volume fraction of methylene chloride. The mass flows of inlet1 were converted from volume flow, respectively as follow: 1.476x10⁻⁴kg sec-1, 1.968x10⁻⁴kg sec-1, 2.460x10⁻⁴kg sec-1, 2.952x10⁻⁴kg sec-1, 3.444x10⁻⁴kg sec-1. Turbulent kinetic energy k can be estimated by Eq. 3:
| (3) |
where, ![]() is the mean velocity at inlet, which can be calculated by mass flow rate. I is the turbulent intensity of inlet, which can be calculated by Eq. 4:
is the mean velocity at inlet, which can be calculated by mass flow rate. I is the turbulent intensity of inlet, which can be calculated by Eq. 4:
| (4) |
Turbulent dissipation rate ε was estimated by Eq. 5 and 6:
| (5) |
| (6) |
where, k is turbulent kinetic energy, L is characteristic length, which can be calculated according to the equivalent diameter.
For the boundary condition of inlet 2, velocity-inlet was selected and allowed to specify velocity magnitude, temperature, turbulent intensity, hydraulic diameter, volume fraction of methylene chloride and so on. The velocity magnitude was 0.42 m sec-1 which was converted from volume flow 1 mL min-1, the value conducted in literature (Jarmer et al., 2003). Turbulent intensity and hydraulic diameter are 1% and 0.2 mm, respectively. For the outlet, the pressure-outlet boundary condition, defined in Fluent, was selected. The pressure of outlet was specified as 8.5Mpa.
RESULTS AND DISCUSSION
The results obtained by Jarmer et al. (2003) presented strong evidence that the power input into the swirl chamber plays a key role in controlling particle size during SEDS processing. The power input, which can also be interpreted as energy for mixing inside the swirl chamber, comes from the head loss resulting from methylene chloride and CO2 flow through the swirl chamber. Estimates for this head loss, based on CO2 flow, can be obtained from Eq. 7 (Jarmer et al., 2003):
| (7) |
where, ![]() is average velocity of SC-CO2. From Eq. 7, it can be concluded that if other parameters and the diameter of CO2 inlet are fixed, the trend of increasing or decreasing for volume flow is similar to that for power input. Therefore, in this study, volume flow of SC-CO2 was set to be the variable.
is average velocity of SC-CO2. From Eq. 7, it can be concluded that if other parameters and the diameter of CO2 inlet are fixed, the trend of increasing or decreasing for volume flow is similar to that for power input. Therefore, in this study, volume flow of SC-CO2 was set to be the variable.
 | |
| Fig. 3(a-e): | Part a indicate the contour of volume fraction of methylene chloride on the wall of computational domain when the volume flow of SC-CO2 is 15 mL min-1. Part b, c, d and e are similar with part a, but they indicate respectively the contour when the volume flow of SC-CO2 is, respectively 20, 25, 30 and 35 mL min-1 |
And five simulations with different volume flow of SC-CO2 were conducted. The values of volume flow of SC-CO2 were selected as follow: 15, 20 , 25, 30 and 35 mL min-1.
It has been confirmed that liquid atomization theory and Weber number based analysis are no longer the appropriate theory and parameter to characterize the SAS process. Instead, gaseous mixing theory and mixing rates, or rather, mixing length scales for turbulent mixing, should be used to characterize sprays of miscible fluids (Shekunov et al., 1999). Consequently, volume fraction of methylene chloride and turbulence intensity of the flow in the nozzle were selected to be indicators to analyze the flow in jet-swirl nozzle with different volume flow of SC-CO2.
The effect of different volume flow of SC-CO2 on volume fraction of methylene chloride.
The contour of volume fraction of methylene chloride indicates mixing of methylene chloride and SC-CO2 in the nozzle. To make it easier for being observed, the contours of volume fraction of methylene chloride were expressed in two perspectives: one is on the wall of computational domain, as shown in Fig. 3 and the other is on the vertical profile across as shown in Fig. 4.
As can be seen from Fig. 3 and 4, when the volume flow of SC-CO2 is 15 mL min-1, most of methylene chloride was concentrated in the edge of upper part.
 | |
| Fig. 4(a-e): | Part a indicate the contour of volume fraction of methylene chloride on the vertical profile across when the volume flow of SC-CO2 is 15 mL min-1. Part b, c, d and e are similar with part a, but they indicate respectively the contour when the volume flow of SC-CO2 is, respectively 20, 25, 30 and 35 mL min-1 |
And methylene chloride and SC-CO2 failed to mix evenly until the outlet, which meant that the mixing process was carried out externally in an unbound environment. It becomes difficult to control mixing intensity and uniformity between the two jets. This can not meet the requirement of SEDS process. With the increase of volume flow of SC-CO2, mixing between methylene chloride and SC-CO2 became more and more evenly. When the volume flow of SC-CO2 was equal to or greater than 25 mL min-1, methylene chloride and SC-CO2 had mixed evenly before reaching to the outlet, which indicated that the solute precipitation process was completed in the confine of the nozzle and the process was controllable and meet the requirement of SEDS process.
 | |
| Fig. 5(a-e): | Part a indicate the contour of turbulent intensity at outlet when the volume flow of SC-CO2 is 15 mL min-1. Part b, c, d and e are similar with part a but they indicate, respectively the contour when the volume flow of SC-CO2 is, respectively 20, 25, 30 and 35 mL min-1 |
 | |
| Fig. 6: | The distribution of turbulent intensity on the diameter of outlet in different volume flow of SC-CO2 |
These results was coincident with the results obtained from experiments in literature (Jarmer et al., 2003), “As the power input per unit volume is increased, the degree of mixing between the two jets increases, shown by a decrease in the measured jet mixing length”. Increasing the power input to 6.5x10⁻⁹ W m-3 resulted in complete mixing of the CO2 and methylene chloride inside the swirl chamber, indicated by no observable jet mixing length (Jarmer et al., 2003).
The effect of different volume flow of SC-CO2 on turbulent intensity: Turbulent intensity, an essential parameter for analyzing SEDS process, can influence two key events: the rate at which supersaturation is reached and the level of supersaturation obtained. The second event is of utmost importance.
Figure 5 shows the contour of turbulent intensity in different volume flow of SC-CO2 at outlet. In order to indicate precise turbulent intensity, Fig. 6 was employed to show the distribution of turbulent intensity on the diameter of outlet in different volume flow of SC-CO2. On the one hand, the two figures show that the turbulent intensities at the outlet were all even in different volume flow of SC-CO2. It means that the solute in solution can precipitate in a uniform condition so as to obtain sharp particle size distribution. On the other hand, the two figures indicate that with the increase of volume flow of SC-CO2, the turbulent intensities at the outlet become greater and greater, which contributes to decreasing the growth time of crystal nuclei and prevent from agglomerating. These results in this section was similar with the results obtained from experiments in literature (Jarmer et al., 2003), “Increasing the power input into the swirl chamber increases the turbulence intensity, which acts to enhance mass transfer rates through the contribution of the eddy diffusivity”.
CONCLUSION
The flow in jet-swirl nozzle for preparing nano-drug in SEDS process was analyzed by CFD. It can be concluded from the results that the jet mixing length was found to be a strong function of the volume flow of SC-CO2 at the inlet of the swirl chamber. When the volume flow of SC-CO2 was equal to or greater than 25 mL min-1, methylene chloride and SC-CO2 mixed completely in the nozzle. These results was coincident with the results obtained from experiments in literature (Jarmer et al., 2003). In additional, it also was indicated that the turbulent intensities at the outlet were all even in different volume flow of SC-CO2 and with the increase of volume flow of SC-CO2, the turbulent intensities at the outlet become greater and greater. These results was similar with the results obtained from experiments in literature (Jarmer et al., 2003). By these CFD analysis and comparison with literature, the flow parameters in jet-swirl nozzle was revealed and the method of CFD analysis for SEDS process was validated. The method used in this study will contribute to predicting the flow in other nozzle or same nozzle with different dimensions for SEDS process, even scale-up nozzle. Moreover, the method used in this study will contribute a lot to the scale-up of the equipment of preparing nano-drug in SEDS process.
ACKNOWLEDGMENT
This work was financially supported by the International Scientific and Technological Cooperation Projects Special Fund (No. 2011DFR31120).
REFERENCES
- Baldyga, J., D. Kubicki, B.Y. Shekunov and K.B. Smith, 2010. Mixing effects on particle formation in supercritical fluids. Chem. Eng. Res. Design, 88: 1131-1141.
CrossRefDirect Link - He, W.Z., Q.L. Suo, Z.H. Jiang, S. Ab and H.L. Hong, 2004. Precipitation of ephedrine by SEDS process using a specially designed prefilming atomizer. J. Supercrit. Fluids, 31: 101-110.
CrossRefDirect Link - Jarmer, D.J., C.S. Lengsfeld and T.W. Randolph, 2003. Manipulation of particle size distribution of poly(L-lactic acid) nanoparticles with a jet-swirl nozzle during precipitation with a compressed antisolvent. J. Supercrit. Fluids, 27: 317-336.
CrossRefDirect Link - Leybros, A., R. Piolet, M. Ariane, H. Muhr, F. Bernard and F. Demoisson, 2012. CFD simulation of ZnO nanoparticle precipitation in a supercritical water synthesis reactor. J. Supercrit. Fluids, 70: 17-26.
CrossRefDirect Link - Moussiere, S., A. Roubaud, O. Boutin, P. Guichardon, B. Fournel and C. Joussot-Dubien, 2012. 2D and 3D CFD modelling of a reactive turbulent flow in a double shell supercritical water oxidation reactor. J. Supercrit. Fluids, 65: 25-31.
CrossRefDirect Link - Reverchon, E., G. Della Porta, I. De Rosa, P. Subra and D. Letourneur, 2000. Supercritical antisolvent micronization of some biopolymers. J. Supercrit. Fluids, 18: 239-245.
CrossRefDirect Link - Shekunov, B.Y., M. Hanna and P. York, 1999. Crystallization process in turbulent supercritical flows. J. Crystal Growth, 198-199: 1345-1351.
CrossRefDirect Link - Thiering, R., F. Dehghani and N.R. Foster, 2001. Current issues relating to anti-solvent micronisation techniques and their extension to industrial scales. J. Supercrit. Fluids, 21: 159-177.
CrossRefDirect Link