
Cihat Polat
Department of Business, Faculty of Economics and Administrative Sciences, Nigde University, 51200 Nigde, Turkey
Journal of Applied Sciences
Year: 2012 | Volume: 12 | Issue: 12 | Page No.: 1211-1231


ABSTRACT
The future always includes some degree of uncertainty and reducing it is of special importance for decision makers. This is also valid for the decision makers in the public transport area. The uncertainty in the future demand and the need to know the factors that influence the demand make the area much interested in by the decision makers for the sake of planning and making right decisions. In this sense, knowing about the demand driving factors and determining future demand for public transport services are very basic managerial instincts for those who perform in the area. However, the subject is quite wide and public transport literature investigates the issue from many different perspectives. The issue is highly relevant to not only decision makers but also researchers. Nevertheless, the results of research in the area are spread out and therefore need to be combined together. This study reviews the current literature with respect to the factors that affect the demand for city public transport services and summarizes the findings. The literature is investigated especially from the operational point of view in order to clear the issue and to help the public transport operators, decision makers and researchers who make decisions and research based on the demand for public transport services and those who understand the factors that shape it.
PDF Abstract XML References Citation
Received: January 05, 2012;
Accepted: April 09, 2012;
Published: June 30, 2012
How to cite this article
Cihat Polat, 2012. The Demand Determinants for Urban Public Transport Services: A Review of the Literature. Journal of Applied Sciences, 12: 1211-1231.
DOI: 10.3923/jas.2012.1211.1231
URL: https://scialert.net/abstract/?doi=jas.2012.1211.1231
DOI: 10.3923/jas.2012.1211.1231
URL: https://scialert.net/abstract/?doi=jas.2012.1211.1231
INTRODUCTION
Mobility is an essential part of human life especially in cities. Indeed mobility is perceived as a right especially in large cities in developed economies (Albalate and Bel, 2010). Public Transport1 (PT), mainly resulted from rapid urbanization, population growth, modern life styles, economic conditions, etc., is one of the most commonly used transport modes that provide the mobility required in our time. Methods that provide mobility not only influence the degree of flexibility but also how quality people’s lives would be. Therefore, the way that PT services are delivered and how high qualities they have are important because of their effect both on the attitude and behavior of travelers and the demand for services.
PT services are mostly delivered either by private or public organizations. Regardless of the party that delivers them, PT services require substantial investments and high operating costs. A PT service supplier has to consider various factors including service productivity and efficiency (Barnum et al., 2007; De Borger and Kerstens, 2006), both of which are closely related and linked to PT demand2. Avoiding undesired costs such as traffic congestion and environmental costs (e.g., pollution) are also among the primary objectives of the public authorities and policy makers. The achievement of those aims is associated with the level of demand obtained for PT services. Therefore, the basic problem for the decision makers is, on one side, how to deliver them most effectively and efficiently in order to increase customer satisfaction so that those services attract as many people to be sufficient as to reach the predefined goals; on the other side, how to minimize the operational, environmental and other (e.g., social) costs. PT operators.
PT organizations have to utilize organizational resources effectively and efficiently and maximize the demand for services. Because of the close interrelations between these two issues, only one cannot enable the organization to achieve its goals. Therefore, the issue of demand and the factors affecting it are concerned very much by the PT operators and decision makers.
Without understanding the system dynamics and more importantly, the behaviors of public travelers, it would be too difficult to make accurate forecasts, which are necessary for marketing, service planning and fare policy purposes (Polat, 2007; Taylor and Camilla, 2012). In this sense, it should firstly be known the factors that affect the PT demand, which has both physical and behavioral dimensions.
The PT issue has been studied extensively from several aspects and the current literature makes great emphasis on the factors that influence the demand. There take place some comprehensive and collaborative studies on the subject, one of which is the inclusive report by Balcombe et al. (2004), also known as TRL Report. The study covered the surface urban transport in Great Britain but international sources and examples were also used extensively. The aims of the study were to research and analyze by using primary and secondary data sources on the factors that influence the demand, produce quantitative indications of how these factors influence the demand, provide accessible information on such factors for key stakeholders such as PT operators and central and local government and produce a document that assist in identifying cost-effective schemes in order to improve services. The study provides practical guidance on demand estimation especially for operating planners and demand forecasters. However, most of the studies in the area seem to be carried out by transport or environmental sciences point of view with engineering perspective and most are insufficient to bring out and catch the brink of the demand drivers. Some studies are seen to have caught the focus but the area is so diverse that it is rarely possible to see the demand driving factors comprehensively especially from the demand management point of view. What it lacks in many of those studies is the evaluation of demand-affecting factors and putting them altogether to serve decision makers, modelers and other relevant parties especially from the (demand) management point of view.
The purpose of this study is to review the current literature on the demand determinants of PT services in urban domain for operational purposes and to summarize the main findings that may contribute especially to those who work in operational decision-making, demand forecast modeling, demand management, PT marketing, etc. Demand determinants are needed for variety of decision situations including determining the variables for modeling and forecasting PT demand. Therefore; local authorities, PT operators, transport planners, PT marketers, operating planners and researchers need to know which factors, in what way and in which importance affect the demand. Towards the specific purposes of the paper, it is organized in four main parts. The second part discusses the main characteristics of PT demand; the third part discusses the demand determinant factors under several subtitles and presents the findings from the literature and the final part is the summary and conclusion.
SOME MAJOR CHARACTERISTICS OF PUBLIC TRANSPORT DEMAND
PT, also called public transportation, public transit and mass transit, is a collective form of transport other than private car or taxi, which comprises all transport systems in which passengers do not travel in their own vehicles. It includes transport modes such as bus, coach, tram, metro, rail etc. Broadly speaking, PT refers to any system that transports members of the general public.
PT services are specific and important. They are among the very basics of people’s lives in modern times and that is why they are not only demanded but also required by people. That is why public authorities are required to provide PT services when there are no private companies that supply it. In terms of their effects as well, PT services are more than simple transport services. It is the very basic instrument of mobility for a big percent of the population almost in all countries, where it forms one of the driving forces of economic and social life. Mobility is inevitable and much of it is provided by PT in many countries whether developed or undeveloped. People’s mobility increases with modern life, so does the need for transportation and, in turn, the demand for PT even in developed countries. For instance, Balcombe et al. (2004) reported that overall trends indicate that the absolute volume of public transport demand, in terms of passenger-km, is still growing in western Europe and North America, in three main PT modes (bus and coach, metro and tram, rail) although the opposite is claimed by Taylor and Camilla (2012) (n/a) for North America but such claims are rare. Based on its significance, it is a matter of public policy for many local or, even, national governments, which are required to meet the transport needs of people and other issues as well such as to reduce environmental externalities.
The nature of PT services shapes their own demand characteristics and vice-versa. Those characteristics are essential to be known in prior in order to better understand the factors that affect the demand.
Firstly, the PT environment is dynamic and even interactive. It includes a combination of alternative transport modes, various types of passengers (e.g., students, workers and leisure travelers) and passengers with different travel purposes, different travel frequencies and different travel times. The existence of various transport modes makes it available transition between those modes for passengers. In such an environment, the demand is also dynamic (Matas, 2004) and volatile. However, it is in balance as a whole. Secondly, PT demand is time-dependent (Hauer, 1971). In general it is higher and even more condensed in the morning and evening times while it is sparse in the remaining times of the day. While the rush hour demand mainly comes from the workers and students, the remaining demand comes from the parties such as shoppers, leisurers and other travelers. Thirdly, different traveler types have different expectations from the PT services based on the travel time and purpose. The level and type of expectations shape demand differently. For instance, as the quality of services is one of the main determinants of the demand, that on the route does not depend on the service quality especially in rush hours; if not in regular times (Hauer, 1971). Also, the time and the purpose of travel also have different effects on the level of expectations and, in turn, on demand. A traveler using PT for work and leisure in different times of the day may require different level of service quality. In many cases due to the availability of limited number of vehicles in service and passengers’ having short of time, the service quality becomes out of a major issue for many especially in large cities. Also the availability of alternative transport modes is a main factor on PT demand. For instance, in a metropolitan city such as Ankara, a city with about 5 million inhabitants, many people have no other alternative transport medium to use or time especially in rush hours, in which cases managing getting to work takes the highest priority than the service quality) (Hauer, 1971). However, service quality is still an important cause determining the demand.
Although, this is a review study, it is still impossible for such a study to comprehend all the work in the area, where the literature is vast and immense. However, in order to display a comprehensive picture, the demand determinant factors, whether or not they are quantifiable and measurable, at least for today, have to be identified from the literature and put into exhibition. This study’s intent is to make a review in such a way that would bring the main factors into attention and put them into a specific frame. Because decision-making and modeling depend on individual abilities and talents as much as knowledge that one holds, it is our primary preference to detect the demand determinant factors for PT and leave them with the decision-makers and researchers, letting them how they decide to use.
The factors influencing the PT demand have received considerable attention in the literature but in different contexts. Price and time elasticities3, modal choice and externalities internalization have been the leading topics in the recent literature on urban public transport demand. (Albalate and Bel, 2010). As may be expected, most of the studies focused only some aspects of the issue, especially those which are concentrated on exploring the effect of specific factors such as price and time elasticities; of course, no single study could comprehend all the demand determinant factors in a single context. In order to being able to see the whole picture at a time, the issue has to be taken in a much broader context and literature review studies are those that are needed in such cases.
The literature has approached to the issue from various aspects including but not limited to, demand sensitivity, the factors affecting multi-mode travel demand, the effect of price issue in urban transportation, etc. In such a wide area of study, it is difficult for decision-makers and academicians to determine which specific factors have the influence on PT demand, which factors should be evaluated first-and of course- without missing any important variable in the light and findings of the literature. Therefore the issue needs to be clarified in essence especially for operating decision-makers, academicians and even strategic managers.
The literature identifies variety of factors which have influence over the PT demand. Surely all of them are not with equal weights in affecting the demand but we need to know in principle what factors we have to affect decisions. Moreover, a specific factor with little weight in a specific decision situation might have a larger effect on another decision domain, which is something that we may not know for sure. It is the expected role of such literature review studies to present a portfolio of matters concerned detected from the literature without judging their relative importance. As the studies that look comprehensively at the issue are very rare mainly due to the specific nature of the subject.
THE FACTORS AFFECTING DEMAND FOR PUBLIC TRANSPORT: FINDINGS FROM THE LITERATURE
There is little doubt that a wide range of factors influences PT demand. The literature includes plenty of empirical evidences of the relevant factors, some of which may be more important than others, in different situations. It can be a formidable task for a PT decision-maker, a demand forecaster or an academician to combine all the factors together, consider and evaluate them with respect to their effects on the decision issue under consideration. Also, as the PT demand is a complex function of all the relevant factors (Balcombe et al., 2004) the changes in each of which is likely to affect the decision outcomes, which yield a complex decision situation in each time. In order to explain the demand characteristics and how the changes in the relevant factors affect the demand, it is needed the models that consider all the relevant factors, which are clearly not easy to build. However, the models had developed been imperfect, it is still needed to know which factors are relevant, to be evaluated and to be included in. Then it comes the issue of how well a specific model serves to the needs of the decision-maker or researcher. This part of the paper discusses the relevant factors affecting PT demand.
One of the basic indicators of the demand is the number of total passenger trips taken place in a specific period of time. However, alternative-and commonly used- measures such as passenger-kilometers can also be used (FitzRoy and Smith, 1998). As the first one shows the number of total passengers used PT services directly, the second one is an indirect indicator of the demand, which refers to the frequency of demand and the amount of services offered to meet the underlying demand.
Prior to the detailed discussion of the demand determinant factors, we can list some major attributes of those services like this: Service frequency, walking (access) distance to/from, waiting time, operating speed, reliability, comfort (Hauer, 1971), fare, journey time, mode of travel and service quality (Lythgoe and Wardman, 2002).
Cost of travel: The literature shows that the ‘cost’ is one of the main determinants of PT demand (Albalate and Bel, 2010). Souche (2010) also pointed to two structural variables that stand out from the others, one of which is the user cost of transport-by public transport and private car. The generalized cost of a journey is the sum of fares charged directly on each leg, plus traveler-specific components associated with a traveler’s valuation of his/her own time (Horn, 2004, 2003). Therefore, in PT concept the cost of travel is combined of two main elements, namely fares and time.
Fares: Fares4 are essential to the supply of PT services since they create a main source of income to operators. The effects of fares on PT patronage are relatively easy to observe. In general, if fares are increased, PT patronage will decrease. The changes in fare prices are the variables with the most direct and powerful influence on patronage (FitzRoy and Smith, 1998; Bonnel and Chausse, 2000; Bresson et al., 2003, 2004).
The literature distinguishes the effects of changes in fares between three main terms: namely short-term (1-2 years), medium-term (around 5 years) and long-term (around 10 years or longer) in general. Fares elasticity5 differs significantly depending on the mode, the time period over which it is being observed and the specific conditions in which a mode is operating (Balcombe et al., 2004).
Extensive discussions took place on the effects of fares on PT demand, mostly in form of fare elasticities, including but not limited (Bresson et al., 2003, 2004; Nijkamp and Pepping, 1988; Preston, 1998; Goodwin, 1992). Bresson et al. (2003) studied estimating fare elasticities for local bus services for a panel of 46 English counties (urban and rural) in the UK. Bresson et al. (2004) also calculated elasticities for each urban area by using panel data analysis for 62 urban areas in France. Dargay and Hanly (2002) found that bus patronage was relatively fare-sensitive with a wide variation in the elasticities. In their comprehensive study, Balcombe et al. (2004) summarized fare elasticities from individual studies, meta-analysis and the Black Book (the first LTR Report edited by Webster and Bly (1980), pointing out noteworthy differences among the elasticity values. From their own study, for instance, Balcombe et al. (2004) reported ‘bus fare elasticities’ averaging around ‘-0,4’ in the short-run, ‘-0,56’ in the medium-run and ‘-1,0’ in the long-run; ‘metro fare elasticities’ averaging around ‘-0,3’ in the short-run and ‘-0,6’ in the long-run and ‘local suburban rail’ around ‘-0,6’ in the short-run, taking accepted ‘standard’ PT fares elasticity value of ‘-0,3’ for short-run, despite the findings revealed significant differences from those of Webster and Bly (1980). Hanley and Dargay (1999) did a detailed review of bus fare elasticities in different countries).
The effect of fares on PT patronage is not similar in all PT modes and in all time frames. Not all the evidences about fare changes explain the changes in demand. Crotte (2008), who studied the factors that characterize travel demand in Mexico City, found that changes in fares did not explain changes in metro demand in Mexico City. He/she detected that service improvements have a more significant effect on patronage than changes in metro fares or gasoline prices, which may be seen as a contradiction to the findings above but the author explained these results with several factors: (1) relatively low level of metro ticket price compared to income of those who even work at a daily minimum wage, (2) metro riders’ possible captivity to metro services, (3) metro fares’ comparably lower rate than other public transport fares and the fare’s being independent of distance travelled, unlike minibus fares, (4) road traffic congestion’s making over-ground services considerably slower, (5) bus and minibus services mainly act as feeder routes between the metro and the peripherally located low income neighborhood, rather than as substitutes to metro services, especially for longer journeys, (6) bus and minibus services provide a very low quality of service compared with the metro and may not be considered as viable substitutes.
The majority of the elasticity values, in spite of the differences among, (as summarized in Balcombe et al. (2004) are in the same direction, implying that fares increases in the short-run make little effect on the demand and, oppositely, increase revenues. The other studies performed on different countries and various counties also produced parallel but quite different elasticity values. In many of those studies it was found PT fares with higher elasticities albeit having observed some considerable differences among different countries (Nijkamp and Pepping, 1988) and even between smaller and larger cities (Preston, 1998). The findings (the size of elasticity) were tied up to country-specific factors, a finding also supported by Bresson et al. (2003), who founded that the demand was less sensitive to changes in factors including income, fares and service in France than in England. Most of those studies, more or less, agree that the changes in fares have relatively a sizeable effect on the PT demand. However, the fare sensitivity is described to be higher in case of price increases than of decreases (mainly for commuters) and when the service is poor than it is good; but riders are approximately twice as sensitive to changes in travel time as they are to changes in fares. Additionally, the response to fare changes increases with the level of fare, so that fare reductions will have a greater impact on demand when fares are high, which suggest that subsidies will be most effective when and where the fares are high (Bresson et al., 2003). Similarly, the fares effect is not same for inward and outward travels to a city. For instance, Lythgoe and Wardman (2002) found the fare elasticity to be lower for inward travels than it is for outward travels (of rail for airport).
Fare elasticities may be affected by the magnitude, direction and level of the fare change. In general, greater fare increases yield higher elasticity values than lower increases; a fare increase and fare decrease may not produce symmetric elasticity values; and the level of the fare relative to people’s income may affect fare elasticity. Elasticity values may also change based on trip purposes and traveler types. Those values may be expected to be lower in the peak demand situations (such as work and school trips) than those for off-peak demand situations (leisure, shopping and personal business trips). Additionally, travelers who have access to cars are more responsive to fare changes than those who do not; males are expected to be more sensitive against fare changes than are females and travelers with higher incomes are more likely to be sensitive to fare changes but they are also more likely to absorb the effects of fare increases. Travelers on low income are more likely to be affected by fare changes and, in sum, demand elasticity values are likely to be higher for them than those on higher income travelers. No clear evidence is provided for age groups (Balcombe et al., 2004).
An additional point is that the effects of fares may vary with respect to the time frame. It is expected to be greater in the long-run than in the short-run. Also, policy measures aimed at fare reduction (subsidization) can play a substantial role in encouraging the use of PT, which reduce the use of private cars at the same time (Bresson et al., 2003). It can be assumed the opposite to be valid as well, meaning that growth in fares may reduce the demand. Matas (2004) presented such an example in which the growth in real fares reduced demand by more than 5% and the introduction of the travel card had an effect of higher than 7% in the Madrid bus market. In explaining the increase in PT demand in the German City of Freiburg. FitzRoy and Smith (1998) also pointed out the importance of the introduction of low-cost, cost transferable season tickets. However, Balcombe et al. (2004) concluded that the effects of pre-paid ticketing systems (travelcards or season tickets) show no consistent pattern.
Conversely; if a travel is made by car, the traveler should consider some extra cost components other than fares. In this case total costs are combined not only by fares but also by some other elements including parking costs and other negative externalities coming from owning or using car. For instance, the greater congestion and parking problems in large cities make travel by car less attractive (Bresson et al., 2003). However, the other costs such as negative externalities are not as apparent as fares to the user partly due to the fact that car owners pay for other cost indirectly. Car also offer some advantageous and flexibilities over PT and this makes it, as a transport mode, more attractive to the user, because of which the cost of using car is considered lower than that of using PT. Hovell and Jones (1975) point out to the same issue that the perceived cost of the trip to the transporters by car appears less than it would be if undertook by PT certainly until the considerable increases in petrol costs. Regarding the generalized cost of travel, the traveler chooses among the alternative transport modes such as private car, PT or taxi, or among the alternative paths in multi-leg journeys (between origin and destination). The car dominates when car travel is underpriced and supply matches the pressure of demand, even when PT supply is also increased (Bonnel and Chausse, 2000). This is the regulatory role of pricing in urban transport system.
Against the flexibilities offered and the total cost of travel by car, PT is subsidized by public authorities in many countries. However, it is claimed that urban car travel is also under-priced in many European cities (Asensio et al., 2003; Bonnel and Chausse, 2000; Newbury, 1988, 1990), which is a significant factor that affect the travel system and PT demand.
The transport literature also sheds light on the influence of pricing policies on the competition among different transport modes, which it exposes how and in what way those policies influence it. Bonnel and Chausse (2000) study is an example that how transport policies distorted competition between different transport modes and how they promoted the transport demand for some specific modes (e.g., urban car travel when under-priced) in case of France.
The marketing management of PT companies should consider all these together in designing the marketing mix and related strategies (Polat, 2007). In fact it is already known that some railway companies in the UK already use the price tool to manage the demand e.g., to distribute the service demand through different hours of the day, especially during the rush hours by applying higher prices and lower prices at out of rush hours. The price is an effective competition tool and can be utilized in competing among other modes of transport (e.g., private car use).
Travel time: It is one of the most leading factors that influence the use of PT and choice of transport mode. The importance of time comes from its structural attributes. As pointed out by Walle and Steenberghen (2006), unlike price and other factors, the time is an absolute constraint because people cannot increase the time spent on traveling indefinitely (Golob et al., 1972). The term ‘travel time’ includes several components within the PT frame. Walk (or access) time, waiting time and journey (in-vehicle) time are the three main components of the travel time. Sometimes interchange (connection) time is also added to this list Krkygsman et al. (2004). Each of these components has different value for travelers. For a typical PT user, the price includes many of these cost components including access times to service points and final destinations, waiting times at stops and interchanges and travel times at vehicles (Horn, 2003), which all influence the travelers’ assessment of PT services.
As seen on Fig. 1, of the eight cost components only two are in the form of fares. The remaining six are in form of time spent while walking, traveling, or waiting. Each of these cost components has different weights for PT travelers. For instance, passengers give more weight to the times spent at bus/train stops and at interchanges but less weight to the times spent at vehicles. Therefore, the level of accessibility to the PT services, the length of waiting times, the frequency and speed of services and the number of interchanges all affect the price of PT services.
The literature places great emphasis on the travel times. Krkygsman et al. (2004), Wardman (2004) and Walle and Steenberghen (2006), who analyzed the effect of time related factors such as walking times, wait times and the number of transfers on PT use by regression techniques and frequency tables, are only a few among many. The issue has received so much attention that even national value of time has been studied widely. It is been made comparisons across different nations. Wardman (2004) discussed many ‘national value of time studies’ conducted in Great Britain, the Netherlands, Norway, Sweden, Finland, New Zealand and the United States in detail. Walker et al. (2012) attempted to develop travel demand models in the context of developing world6 (the case of China) with poorly measured travel time (data) in a mode choice; estimating travel demand models.
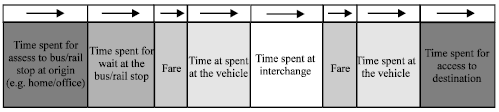 | |
| Fig. 1: | The cost components of a travel by PT vehicles with one interchange |
The study found that measurement errors in travel time (poor quality data) could cause serious biases while decrease in measurement error led to increases in values of time.
The travel time is composed of several components and each of those has different size of effect on the PT patronage. Krkygsman et al. (2004) studied the access, egress and line-haul travel time and the relationship among these time elements in multi-modal journeys. The study reported the effects of each of these time components on the PT use. Wardman (2004) studied the value of PT times relative to the car travel times and the value of the walk time, wait time, service headway and in-vehicle time associated with PT. Walle and Steenberghen (2006) attempted to understand the time and space related determinants as the influential factors in the choice of transport mode. They also stated that travel time enforces the choice of travel mode as a crucial factor with their own characteristics and specific influence on mode choice decisions. The choice of mode is reported to be more sensitive to out-of-vehicle times that passengers spend overall than in-vehicle time. The general appearance is that the travelers’ sensitiveness to out-of-vehicle time to in-vehicle time is between 1.2 and 2.3 times. For instance, Balcombe et al. (2004) reported the wait time to be valued at about 1.6 times in-vehicle time for buses and 1.2 times in-vehicle time for rail for the UK case. It may show some differences for other countries.
Another factor that influences the choice of travel mode between origin-destination pairs is the travel time differentials between private car and bus (Cervero and Kockelman, 1997). There are differences between the sensitiveness to changes in travel times and to those in fares. Bresson et al. (2003) reported that the working population was more sensitive to trip duration by bus than by car and riders were more approximately twice as sensitive to changes in travel time as they were to changes in fares. However, we should also add travelers’ characteristics (personal features) to these time related factors. The issue is discussed more in detail below.
(1) Walk (access) time and accessibility of transport services: A significant factor in PT demand is the access time or distance that someone should overcome to get to a service stop. The use of PT involves walking to/from home (or office or school, etc.) or transfer between vehicles or modes. Walk time can be expected to have a premium value since it incurs greater effort, there are fewer opportunities for making productive use of time and it may be undertaken in a less pleasant environment, which is followed by wait time and then in-vehicle time (Wardman, 2004). Walking time is generally perceived negatively except on very long journeys (Walle and Steenberghen, 2006).
Accessibility is a general term referring to the degree to which a system is usable by as many people as possible. It is the suitability of the public transport network to get individuals from their system entry point to their system exit location in a reasonable amount of time (Murray et al., 1998). It refers to the ease of reaching destinations.
The reason that the degree of accessibility has a major influence on the demand is mainly because the travelers are unlikely to use the services that are inconvenient for them, thus encompassing the operational functioning of the transport system. Therefore it is important to reduce the access time and increase the convenience for travelers to reach to the services.
Access time is mentioned about origin and destination based access. The origin based access is the distance from one’s residence to the nearest PT service stop, while the destination based access represents the distance from one’s desired trip target to the nearest PT service stop. Access to PT is an important service performance measure (Murray, 2001) because the access and egress both determine the availability of PT and the demand at large (Bovy et al., 1991). An increase in access time (or distance) is connected with a decrease in use of PT services (Cervero, 2001). If access time (or distance) exceeds a maximum threshold, travelers are likely to prefer alternative transport modes other than PT. If it is within the acceptable limits, the preference of use depends on how convenient the system is (Krkygsman et al., 2004). Hossain et al. (2010) investigates the impact of walking distance on the attractiveness of transit. The study considers alternative utility functions for the transit option with different representations of the walking component, considering variations in sensitivities with distance, age, gender, income, car ownership and journey component (origin end vs. destination end). It has been found that walking distances to and from bus stops have important and significant influences of the attractiveness of bus use, along with fares, ride times and schedule mis-match times, indicating that all of these have negative values, which mean the attractiveness of transit is reduced as these values increase. However, the study identifies differences in sensitivities to walking distance across gender, age and vehicle ownership.
Based on its influence on the choice of transport mode, the literature puts great emphasis into how PT passengers valued walk and wait times. Most of the studies conducted, more or less, agree that walk and wait times are more valued, sometimes two to four times, than are in-vehicle times (IVT), where wait times is also more valued than walk times (Wardman, 2001). The time valuation of passengers would also vary with respect to the purpose of trip such as commuting, business and other (Algers et al., 1996). Access and egress times that passengers are willing to spend vary for different transport modes (e.g., buses and trains), longer for the latter one, for Amsterdam-Utrecht, Netherlands case Krkygsman et al. (2004) studies focused mainly on how to reduce the access and egress times.
According to Krkygsman et al. (2004), the access and egress (together with wait and transfer times) are the weakest link in a PT chain, which determines the availability and convenience of PT. However, the initiatives for improving access have the potential to considerably reduce PT trip time because they are considerably inexpensive option compared to the infrastructure and vehicle enhancement alternatives that are frequently considered.
Another factor that affects the demand is the access coverage of PT services. Access coverage is the span of the area where the PT services are offered or distributed. The wider the area that these services are distributed, the higher the level of demand it can be expected because in this case more people are expected to be covered. Murray (2001) applied a strategic analysis approach to PT services in Brisbane, Australia in order to justify local modifications to the PT system based on the system inefficiencies and attempted to improve the regional utilization of PT by using a geographical information system.
(2) Waiting time: Waiting time is another main component in the travel time. The waiting time measures the actual duration of waiting at the stop (Hauer, 1971).
Waiting time is perceived negatively except on long journeys. There is a clear maximum accepted waiting and walking time, which is dependent on total travel time. For waiting time, the maximum accepted time is lower than for walking time and a negative relation is stronger, implying a more negative appreciation of high waiting times. Passengers give more weight to waiting times than in-vehicle times. For instance, Dutch travelers weight one minute delay 2.3 times a minute in-vehicle time (Walle and Steenberghen, 2006).
The expected waiting time of passengers at stops are determined by two processes: (1) the process of passenger arrivals at stops and (2) the process of headways between vehicles available for boarding (Hauer, 1971). When headways are long and vehicles adhere to published schedules, passengers tend to adapt their arrival at the stop to that of the serving vehicle. If so, the waiting time at the stop is only a part of the inconvenience that stems from the gap between the desired time of the trip and the scheduled departure of the vehicle. Under such conditions it is the service frequency that dominates the quality of the service (Hauer, 1971). However, this can be valid only if there are no alternative transport modes on a route. In many cities, there are a few alternative modes (e.g., buses, green or blue buses, minibuses and double-deckers, which are operated by different entities) in many transport lines, passengers are unlikely to wait for the vehicle of a specific mode. In such cases the problem is connected to the service provider of the specific transport mode that the passenger intends to use, in which case the service quality is mainly determined by the transport mode. The existence of alternative modes in a line brings competition among transport modes and operators and the passengers are likely to wait shorter period of time; given that they are ready to pay higher fares for the alternative transport modes, for which, in many cases, they are required to pay higher fares. Many passengers do pay higher charges for avoiding the inconvenience of the wait time. Wait time will have a premium valuation because of the stress and frustration involved and also to the extent that less productive use can be made of waiting time and it involves more effort and less comfort than seated on a vehicle. (Wardman, 2004). That is why, passengers who have to wait for PT vehicles prefer to spend their time in comfortable, safe, clean and protected places (e.g., which are free of cold, rain and sun) (Balcombe et al., 2004).
(3) In-vehicle (journey) time (IVT): In-vehicle time is a major time component. Given all else being equal, the longer the in-vehicle time, the lower the demand is. When the journey times turns to be longer, the tendency for the search of alternative transport modes increases because it is shorter for some transport modes than it is for others. For instance, car has the shorter journey times for the majority of trips, given that parking spaces are available Hovell and Jones (1975). Underground is usually faster than the bus due to the dedicated specific lines, which is free from the traffic congestion and better facilities that ease the journey and make it faster.
In-vehicle time (IVT) received great attention in the literature with respect to both car and PT users’ valuation of IVT (Gleave, 1997), followed by the valuations of walk and wait time (Wardman, 2004). It was rather treated as a cost or competition factor (Francis, 2002; Murray, 2001; Balcombe et al., 2004). IVT is a relatively small part of the total journey time for short journeys but it changes as the journey time gets longer so as do the value of IVT. The findings show that the value of IVT varies with respect to user type (e.g., business), journey purpose (e.g., leisure or work), distance (e.g., short or long journeys), travel mode (e.g., bus, rail or car), etc. (Balcombe et al., 2004). Wardman (1998) reviewed an extensive value of travel time studies).
Another point that should be evaluated in the frame is the network (traffic) congestion. Network (traffic) congestion is an important factor that affects the PT demand (Francis, 2002). Network congestion influences it in two different ways: (1) It affects (deteriorates) the service quality and leads passengers to prefer another transport mode and (2) increases the cost of travel in terms of time component. The traffic congestion can also be taken as a separate factor. It is both a result and an effect. On one side, the level of traffic congestion, to a certain extent, is the result of low use of PT services besides many other factors, on the other hand it might be an encouraging or discouraging factor on PT use. In other words, high level of traffic congestion may encourage people to use PT services or does inverse effect on travelers. For instance, as the traffic congestion increases, the travel time rises as well, making the private car users exhausted psychologically and probably leading them to use PT services. Higher congestion levels diminish the advantages of private car over PT. Bresson et al. (2003) also highlighted that the greater congestion problems in large cities make travel by car less attractive. However, the net effect depends on the level of traffic congestion and other relevant costs, e.g., the cost of the value of time and of private car use.
(4) Interchanges and legs: Transfers permitted between PT services at PT points called interchanges (Horn, 1999). It is also called ‘transfer time’ or ‘connection time.’ An important portion of PT trips are in form of multi-leg journeys, which is composed of more than one transport mode e.g., walking, bus, light-rail or repeat of one of those modes e.g., bus-to-bus or light-rail to light-rail and interchanges (connections) make an important component of the journey time during travel. The number of legs used in a journey influences the total time spent and the cost of the journey considerably. As the number of legs increases, so does the number of interchanges and in turn, it raises the time spent for the journey.
Transfer times (besides waiting times) are important time elements in PT trips (Krkygsman et al., 2004) because these time components can influence the total time spent for the journey noticeably. Transfers together with walking times and waiting times are perceived negatively (Walle and Steenberghen, 2006) and passengers do not like interchanges Balcombe et al. (2004). Wardman et al. (2001) investigated the interchanges for bus, train and commuting car users and their effects on travel choices. Guo and Wilson (2007) reported that average transfer cost between subway and bus, or between subway and commuter rail is likely to be much larger.
For rail passengers, Wardman et al. (2001) indicated that an additional interchange reduced the demand for inter-urban rail travel in Great Britain by around 20-25%, in which journey time increase is not included but included the effect of connection time, which was more highly valued than train time. Lythgoe and Wardman (2002) conveyed that evidence from disaggregate airport access models generally indicated a larger interchange penalty than for other rail travel. Balcombe et al. (2004) reported average equivalent penalty of 21 min IVT on a bus trip and 37 min IVT on a rail trip. The pure interchange penalty, that is in the absence of journey time changes, increases with the number of interchanges but it is clearly a diminishing effect. The first interchange would reduce rail demand to 40% of its initial level other things equal, whereas two and three interchanges would reduce demand to 30 and 28% of its initial level, respectively (Lythgoe and Wardman, 2002). A similar decrease, albeit not in the same rate, could be expected for the demand for bus. (The reader can see Litman (2011) for an extensive discussion of transportation elasticities).
Service quality: Service quality is also one of the most important determinants of the public travel demand. Balcombe et al. (2004), Bresson et al. (2003), Francis (2002) Lythgoe and Wardman (2002) and FitzRoy and Smith (1998) are just a few who pointed out to it. FitzRoy and Smith (1998) pointed out the service quality as one of the transport variables with the most direct and powerful influence on patronage. That is why, the PT providers in the UK paid attention to the service quality in order to maintain market share and increase profitability on a deregulated and privatized market (Pullen, 1993). Bresson et al. (2003) concluded that service is at least as important as fare, if not more so, claiming that fare increases can be compensated for by equivalent service improvements without affecting patronage.
The term service quality includes but not limited and equivalent to, waiting times and service frequency but it is a more comprehensive than each of these concepts. It includes various prominent attributes of services such as service frequency, walking distance (also called access and egress time), waiting time (service intervals), operating speed, reliability and comfort. FitzRoy and Smith (1998) stated other service quality indicators as the extensions in the bus (tram, underground, etc.) network and effective park-and-ride schemes.
FitzRoy and Smith (1998) made specific emphasis on the quality of PT services. For most goods, the quality of a product is an attribute which is a fixed characteristic. However, in the case of PT services, it is clear that quality is a function of the quantity supplied. Thus a greater supply of vehicle kilometers over a given route network implies, in general, a more frequent service, lower waiting times for customers and greater demand for public transit all else equal. Similarly, a larger route length with a given frequency will reduce travel time to stations as the density of transit coverage rises, also boosting demand for a given fare structure. Crotte (2008) commented on the issue saying that if policy makers want to attract more users to public transport, improvements in quality of service should take precedence over reduction in fares.
Bresson et al. (2002) described service quality as a function of transport supply. They pointed out that the service quality of a specific transport mode not only depends on the supply of that mode but also the supply of alternative transport mode. Similarly, service quality and level of demand interact. As the service quality influence the travel demand (Hauer, 1971), the level of travel demand, in turn, affect the service quality offered. In other words, there is a two-way interaction between variables.
Lythgoe and Wardman (2002) reported different sizes of service quality effects for rail demand for inwards and outwards journeys for airport passengers. This might be due to the fact that the outward passengers may feel that they have more free time to use alternative modes of travel compared to inward passengers, who may face higher costs (or penalties) if they miss their aircraft. A similar image can be assumed for bus passengers when there are alternative modes of travel (e.g. minibuses, green busses and double-decker busses in Ankara), in which case service quality becomes more important for outward passengers than for inward passengers.
One of the factors that increase service quality and influence the level of demand is the integration of PT system, which has been the case for Madrid. Integration includes several issues such as the coordination of service levels, routes and timetables and a common fare system (Matas, 2004). Therefore the more the PT system gets integrated, the higher the service quality and the level of demand become in a city.
Not all the findings on quality are similar. Bresson et al. (2004) indicated that, concerning service measures, the quantity (seat km) had a greater impact than quality (frequency of service and network density) for French example; however, most of the studies reported quality to be one of the main factors that influence the PT demand. Below is a more detailed discussion of the components of service quality.
The route length is the indicator of the span of area covered for PT services and is considered one of the service quality indicators. The wider the area covered is, the higher the accessibility of the services and the number of passengers that can use the services are. It means that the route length increases the quality of the services and the demand for them. The quality is treated as an important variable in demand forecast studies. For instance, Matas (2004) entered the route length as the only quality variable in her model for demand forecasting. She found that service quality measured in terms of route length had a positive impact on PT patronage, where the effect of the bus doubles that of the underground.
The other service quality indicator is the service frequency, which refers to how often a PT service is delivered on a specific route in a given period of time. It can be measured in a number of ways: total vehicle kilometers or hours, frequency, headway/service interval, wait time and schedule delay (Balcombe et al., 2004). Service frequency influences the PT demand (Francis, 2002) in a way that it determines how much a passenger is likely to wait for. It is an attribute of service quality and reflects the availability of service whenever the need for the trip arises. It is also an indicator of the freedom to choose a departure time so as to reach the destination close to the desired arrival time (Hauer, 1971). Service frequency also determines the extent to which a journey can be made at a desired time. Public transport users can either plan their activities around scheduled departure times, which involves inconvenience and transaction costs along with some amount of wait time, or else turn up at the departure point at random, which avoids the scheduling costs but incurs additional waiting which on average equals half the headway Wardman (2004). While the service frequency depends on the density of passengers on a specific route, it also determines the preferences of passengers whether or not to use a specific PT mode. If service frequency is low, passengers are likely to choose among alternative service modes or to use their own transport vehicle such as private car.
The operating speed is also an attribute and quality indicator of PT services. It is defined to be the ratio of the distance between two points of the route (between which there is at least one stop) and the average time to traverse that distance” (Hauer, 1971). The operating speed is important in the sense that the in-vehicle time, which increases the time component cost of travel, gets longer or shorter as the operating speed increases or decreases, respectively but the capability of increasing operating speed is limited in urban traffic.
An additional component of service quality is the effect of PT vehicle. Passengers prefer clean, comfortable and easy to get on and off vehicles; however, the relative significance of those factors is difficult to determine because such attributes are too many and difficult to quantify in order to analyze their effect on the demand. In spite of their relative importance, Balcombe et al. (2004) conclude that the perceived values of vehicle attributes are much smaller than the value of IVT (for a bus ride). Besides this, travelers value public information systems that provide real time information with digital displays on the predicted arrival times of relevant buses or trains and service information available in printed and kiosk forms such as timetables, route maps, telephone inquiry services, etc.
Reliability: Reliability refers to the degree of dependability on and trust-ability of passengers in a specific mode of transport and PT services. It also includes features such as accessibility and confidence. Passengers should be able to depend on those services and be able to see that they are obtainable on regular basis and are long termed. Longer waiting times due to late arrival of buses or trains and excessive IVTs due to traffic or system problems reduce reliability, one of the clearest measures of which is the degree of those services’ following of time schedules announced. The factors such as service frequency and service capacity, which determine the usability of PT services, also affect the reliability. For instance, the number of seats available can be considered in this frame. If the service capacity available are insufficient to meet the current demand, travelers are little likely to find those services reliable.
Comfort: Comfort is another indicator of service quality. Although the degree of importance given to it may differ from one group of passengers to another based on the journey time, journey purpose and passenger type, the comfort is a quality factor that should be taken into account. Different transport modes provide different degree of comfort and it is a major factor that influences the demand. For instance, car provides door-to-door transport and is more comfortable and convenient in terms of seating, ventilation and storage capacity (Hovell and Jones, 1975). On the other hand, the comfort ability and convenience offered by other PT modes are more limited compared to car.
However, as the transport technology develops more and more, it provides better facilities and comfort to travelers. This can be expected to positively affect the demand; however, technological changes related to service vehicles take place slowly and it is difficult to expect sudden increases in the PT demand in the short or medium term. Because technological breakthroughs related to transport vehicles cannot be expected during the next decade or so Hovell and Jones (1975) except probably some information technology based applications to PT vehicles.
Another point to consider is the degree of overcrowding in PT vehicles. Overcrowding can be accepted to affect the comfort and perception of PT by travelers, which creates unpleasant and uncomfortable conditions. Comfort has some value for travelers in spite of varying degrees in different circumstances. For instance, passengers do not require the same level of comfort in the peak and off-peak times, in the short or long distance travels or for different travel purposes (e.g., leisure or work), although they desire so. In general, comfort should be accepted as an important element that affects the PT demand.
Travel distance: Travel distance is another factor that affects the demand for PT. Urban sprawl and the nature of economic relations influence the length of distances. Travelers’ tendency and desire to make journey gets lower and lower as the travel distance increases and they make less frequent journeys. In contrary, shorter distance trips tend to be made more frequently. This is mainly because the disutility of a unit of IVT increases with journey duration, as fatigue, boredom and discomfort set in and the opportunity cost of travel time which is seemingly greater for longer distance journeys (Wardman, 2004). Travelers may choose some other modes than PT if the travel distance is beyond a certain threshold distance (Lythgoe and Wardman, 2002).
Availability and costs of alternative travel modes: PT demand is also closely related to the availability and costs of alternative travel modes. If the number of alternative transport modes is numerous, the passengers are likely to choose among those alternatives. Alternative (public or private) transport modes have a direct influence (on PT demand) but cross-elasticities (i.e., for the fuel price) also have to be considered (Bresson et al., 2004). There is a perceptible competition between PT and private car use. Bresson et al. (2004) who considered car ownership among the structural factors, specified that the main factor behind lower PT use to be growing car ownership, which can be linked to the growth in economy. Lythgoe and Wardman (2002) also pointed out the cost and availability of alternative transport modes. Needless to say, the costs of alternative transport modes (besides that of PT) can also be very influential in the use of PT services.
The time of travel: Time of travel is already known to be an important factor on PT demand. Especially in work trips, journeys are made in certain times of the day. Morning and evening times are the peak times, while other times of the day are more relaxed. People generally go to their work, school and other activities in the morning and return their home in the evening times. Although this is already a known topic, many studies pointed out the time of the day effect on the travel demand both for work and non-work trips. For instance, Jennifer and Bhat (2000) pointed out the time of day effect on the travel demand and examined the effect of individual and household socio-demographic characteristics, employment-related attributes and trip characteristics on departure time choices of individuals. In non-work trips such as eating, recreation and child care, people have more freedom to choose the time of their trips. Nurdden et al. (2007) also found travel time to be an important factor influencing the individual’s choice of transportation. Therefore, individuals’ travel patterns are a result of how and when they want to use their time.
The purpose of travel: The purpose of travel, also called the ‘principal activity’, is one of the main characteristics that determine the time, location and, mostly, mode of the travel Walle and Steenberghen (2006). While a traveler has a limited time frame for work trips in which the journey has to be performed, he/she has more freedom to choose the time in non-work trips. Jennifer and Bhat (2000) studied how non-work trips differ from other types with respect to several characteristics. Many value of time studies also pointed out how the travelers value the time when they travel different purposes such as work, recreation and eating. The general conclusion from all these work is that travelers approach to work and non-work trips differently and this has different effects on travel demand.
The level of transport supply: Transport is a basic element of the city life. In many cities PT services are provided by the local authorities (or under the supervision of them) or private companies. Travelers choose which ones to use among the transport mediums or modes available to them. If PT supply is insufficient, travelers are little likely to prefer it. In contrary, they are likely to use private car, which is a result contrary to what is intended by PT. Limiting or increasing the PT service supply also influences the position of the alternative transport modes, which, in turn, the level of PT demand.
The existing studies such as Bresson et al. (2004) put that the use of PT was quite sensitive to the volume supplied. Francis (2002) tested some hypotheses about how the changes in transport supply affected the demand for PT. However, by considering the applications in several counties in Europe, Bonnel and Chausse (2000) argued that a sufficient level of supply was not in itself adequate to solve the issue of PT use because it was needed a comprehensive and coherent approach, indicating that the approach to the problem had mainly been centered on increasing urban supply to meet the demand better. The study gave many examples of European cities where the supply had not been able to solve the issue.
The effect of the level of service supply on the demand cannot be ignored as well. Bonnel and Chausse (2000) stated that the higher the supply had been, the greater the use had been in the Swiss cities although the passenger traffic did not only depend on the quality of supply, which the level of supply was also considered as a quality indicator for PT services. Bresson et al. (2004) decomposed the impact of supply on the demand into two components: quantity and quality. The quantity (seats kilometers) was assumed to have a dominant effect while the quality (frequency and density of the network) was assumed to have a weaker effect on the PT patronage. In another study, Bresson et al. (2003) pointed out that an increase in the bus supply in low-density areas led to a reduction in the number of schoolchildren given parental lifts, which is an example of how the service supply may influence the demand.
On the other hand, Walle and Steenberghen (2006) paid attention to a different point that, in some trip chains, one trip in the chain prevented the whole chain to be completed by PT. These trips are called ‘missing link’ trips. If no or insufficient PT is available for only one trip in a long trip chain, no PT will be used by the traveler, if the importance of time and location of the destination activity is considerably important to reschedule. This group of trips reveals weaknesses in the PT supply. Ten percent of all trip chains are claimed to have been belonged to this group. This makes travelers to be dependent on car. In short, the supply level is considerably important for passenger to use PT however it is not sufficient alone. Increasing or limiting of the level of PT services sustains the quality of and demand for PT services to a certain extent but is not sufficient alone so as to change the level of demand noticeably.
The level of public transport dependency: Besides many factors, the degree of travelers’ dependency on PT services is a vital factor that affects the demand. The PT dependency can be described as the degree of necessity that one needs to use PT to travel. If a traveler is heavily dependent on the PT, which means he/she does not have many alternatives to use for travel, the demand is expected to be higher.
An urban PT system generally includes more than one networked goods, one of which can be substituted for another. Especially in urban areas, supply and perhaps demand externalities within the car mode have considerably modified the attractiveness of competing modes (e.g., public transport, walking and cycling) and, hence, the demand for them (Bonnel and Chausse, 2000). Therefore, the number of substitute modes available significantly affects the demand for the mode under consideration.
The degree of PT dependency not only determines the level of PT demand but also determines the level of demand elasticity against the changes in fares. In explaining the insensitivity of Mexico City metro users to metro services, Crotte (2008) pointed out the likely captivity of the metro users to metro services. Therefore, availability of substitute (alternative) transport modes is an important factor in determining the PT demand. Substitute of public transport is private transport. Private car is the main competitor of PT (Bresson et al., 2002) and the only viable substitute7 for bus (Dargay and Hanly, 2002) however, it has its own costs and limitations as well, many of which are already pointed out above. Private transport is not free of limitations e.g. extra fuel costs and taxes, road pricing, high parking charges, limited parking spaces, high car insurance premiums, traffic congestions, just a few to mention. When there is more than one mode available, each mode depends on the others by substitution or complementarity effects (Bresson et al., 2002). In the choice of transport mode individuals behave rationally between public and private transport (Bresson et al., 2003).
PT dependency remains higher in cities or countries where the level of income is not as high as to sustain travel with private vehicles or the physical conditions force the travelers to use PT for variety of reasons already mentioned and some additional factors e.g. local policies such as even or odd plate number days. In many cases, passengers cannot use their car for transport, even if they have it.
Economic factors: Economic factors such as the level of household income, employment rate and the general level of wealth in a country are also among the main determinants of the PT use. Bresson et al. (2002) stated that transport demand, by definition, depended on household income and transport price. If household income exceeds certain threshold, it reduces the demand because people tend to use their own private cars. Bresson et al. (2003) concluded that rising incomes and increased motorization discouraged the use of PT in England and France. Crotte (2008) made similar comments on the issue saying that the level of income influences how travelers look at PT. Excerpt goes like this: The results suggest that for the majority of metro users, whose salaries are based on low multiples of the minimum wage and are not potential car owners, the Mexico City metro is perceived as a normal good. However, for middle/high income earners, who can afford to buy a private vehicle when their incomes increase, the Mexico City metro is perceived as an inferior good. In a similar manner, Nurdden et al. (2007) pointed out that travel cost and household income were among important factors affecting individuals’ choice of transportation.
Similarly, among economic factors, the level of employment is largely effective, too. The higher the level of employment gets, the higher the demand for PT services becomes. Matas (2004) pointed out the level of employment to be a significant variable in explaining the underground demand (but not bus demand). She indicated that The role that employment plays in the demand equation in Madrid is similar to the one found by London Transport. However, it should not be a major factor for short-term demand because in short term the level of employment does not fluctuate as much to affect as the demand level.
Population density: Population density influences the volume of PT demand. In his/her urban travel demand model in an econometric method that use the principal structural variables identified in the literature, Souche (2010) finds two main variables, one of which is the urban density. It is an unsurprising result for this variable to come out because PT demand is expected to be higher in cities with high densities than those with low densities. For instance, Western and Eastern European cities besides Asian and African cities have higher population densities than do North American and Australasian cities, where the level of PT uses is higher in general. In the ‘population density’ issue, it should be considered ‘job density’ as well, which increase ‘mobility’. However, the ‘population density’ is not only related to the total population but also related to the ‘surface area’ of city. In general, population density increases as city surface area decreases and vice versa. City surface may influence PT demand in different ways. First, the larger the city surface becomes, the higher the cost of private transportation (e.g., fuel costs) gets, in which case PT may become a more attractive transport mode at least for some groups of people. In this case the demand depends on the degree of surface area that PT services cover in a city. However, large urban sprawl may also encourage people to have their own private transport because they do not want to feel dependent on PT vehicles. Second, the more compact a city becomes, the higher the use of PT services gets because (1) people may not need private transport deliberately and (2) use of private car may be too costly in terms of monetary costs (e.g., parking costs), finding parking spaces and heavy traffic conditions. Besides all these, compact cities may also be very suitable for walking and cycling types of transport, which may reduce the PT demand to a certain degree. Eastern and Western European and African cities have considerably smaller surface areas than Asian, Australasian and North and South American cities, which correspond to higher population densities in actual. In sum, the net effect of urban sprawl on PT demand needs further investigation.
Demographic and social factors: Demographic and social factors are known to be very influential on the PT demand. Population growth, as a leading factor (Francis, 2002) and population characteristics (e.g., age structure, for instance, the declining proportion of young people have a negative impact on the use of public transport Bresson et al. (2002) makes considerable pressure on the transport infrastructure in urban regions. It is a challenging problem for local authorities how to meet continuously growing travel -especially PT- demand in urban regions. That is why PT is recognized as a key component in the administration and planning of urban regions (Murray, 2001) as well as sustaining the basic human life in cities.
The demand is likely to change with respect to the shifts in age structure and other related demographic factors (Balcombe et al., 2004; Nurdden et al., 2007), which likely to cause some alterations in the travel patterns and traffic practices. Demographic factors are slow in change (Hovell and Jones, 1975) and little likely to cause major shifts so as to affect the operational decisions especially in the short run; however, they have deep impact on public travel.
Bresson et al. (2003) concerned with the effect on PT use caused by the changes in population, urban sprawl and increasing car ownership. Bresson et al. (2004) also investigated the effect of structural factors including population ageing and urban sprawl on the PT demand and concluded that in a long-term perspective, economic factors were not the only determinants of the demand. The authors investigated how age structure affected the use of PT services. They found that the gender and the number of cars owned by the household were not very influential criteria for young people’s PT use but for people of working age, differences between men and women concerning PT use were substantial; however, this was more valid for those household with only one car. For those having more than one car, the authors claimed no clear cut conclusion. They also reported that demographic variables and car ownership could not be considered separately because their influence on PT use was interlinked.
In a similar context, Krkygsman et al. (2004) included some socio-demographic (i.e., gender, car ownership, age, child ownership and income situation) variables (besides some others) in their model in an attempt to determine the factors on the separate travel time elements (access, egress and travel times). Similar to the journey time, which had a direct effect on the PT demand, the socio-economic factors did the same on the journey time. These two groups of factors were concluded to be interrelated. Nurdden et al. (2007) also found age, gender, household size and income to be significant factors influencing the individual’s choice of transport.
There are some general conclusions as well. For instance, males travel longer than females. Young people are more tend to use PT than elderly. People who are more socially oriented are expected to use transport services more than those who are not very much socially oriented. However, Krygsman et al.’s study found that few of the socio-demographic variables were significant and their influence was rather limited for determining travel time and distance traveled (Cervero, 2001). Besides household income, household composition (Lawson, 1999) and the presence of children (Strathman et al., 1994) were among the factors affecting the PT use. Albalate and Bel (2010) also found that socio-economic variables play the most important role on local public transportation.
Land use and city built environments: PT demand is also affected by the land use and city built environments. The relationships between land-use and PT are complex, each being directly dependent on the other and this complexity is enhanced by interactions with other factors including age distribution, employment characteristics, income levels and car ownership. Hence it is difficult to establish the precise relationships between PT demand and land-use patterns (Balcombe et al., 2004). On the other hand, literature already exposed the effects of individual circumstances in this frame.
The built environments, investigated in three basic dimensions in the literature, namely ‘density’, ‘diversity’ and ‘design’, called ‘3Ds’, shape the travel behavior. Compact neighborhoods can deteriorate the needs for private vehicle trips and even encourage non-motorized or PT modes in a few ways: Bringing origins and destinations closer, there become more opportunities for leaving one’s car at home and walking or cycling to a destination or using PT vehicles. Compact neighborhoods moreover tend to have less parking, better quality transport services, wider mixes of land uses and larger shares of low-income households, all of which reduce car use. In return, use of PT tends to be greater in more densely populated areas. All these characteristics of trip ends affect travel behavior and choices (Cervero and Kockelman, 1997; Balcombe et al., 2004).
Merging housing, shopping, employment and other facilities in mixed-use developments provide residents with the opportunity to live, work and carry out other daily activities locally or with the minimum travel needs, without having to drive (Balcombe et al., 2004). In fact ... travel demand is a ‘derived’ demand in the sense that trips are made and distributed on the basis of the desire to reach places, whether office buildings, ballparks, or shopping centers. The characteristics of these places-i.e., their land uses, densities, design features-can affect not only the number of trips generated but also modes and routes of travel. While characteristics of origin-destination interchanges,..., are known to affect travel demand, so are features of the trip ends (i.e., origins and destinations) themselves (Cervero and Kockelman, 1997). Matas (2004) supports this by drawing attention that the higher population densities of (Spanish) cities make them better suited for PT use than to car use (Webster et al., 1986). This claim holds better for larger cities such as London, Paris and Istanbul because settlement size also affects the distances that need to be traveled to reach certain services and facilities. At the same time, it influences the modes of transport that can be maintained by the urban area (e.g., bus, light rail or underground) Balcombe et al. (2004). Additionally, urban sprawl is also an important factor for PT demand. Bresson et al. (2004) found the PT use among some groups such as young people living in the suburbs to be greater than for those living in the center. Population density thus becomes an important predictor of travel choice (Dunphy and Fisher, 1996).
The degree of centralization of employment and facilities (restaurants, shops, service outlets, entertainment places etc.), as a design element, also influences travel behavior. A greater degree of centralization encourages PT use and reduces private car use. Distributed shopping centers around the city also reduce travel demand (Cervero and Kockelman, 1997; Balcombe et al., 2004). Old European cities and the newly established American cities are the typical examples of how city design affects the transport behavior. In the European cities, the PT use is higher than that in American cities, which have wider streets, more parking spaces, better-organized city planning, distributed shopping centers etc. compared to the old historical European cities, where those infrastructures are mostly under protection and cannot be modified for a better transport development. In such cities, PT systems are adapted into the current state of the city built environments and structures. The PT service demanders also have to suffice with the services available under the current settings, which are too difficult to change Hovell and Jones (1975).
For city built environments, it is difficult to measure the effects of all elements on travel behavior and travel demand; however, more macro-factors such as density and the comparative cost of transit vs. automobile travel are considered as the principal determinants of commuting choices (Cervero and Kockelman, 1997). However the main point here is how much effect the city built environments have on the travel demand. Cervero and Kockelman (1997) found the effects of built environment on travel demand being modest to moderate at best for their case of study. Densities exerted the strongest influence on personal business trips. Diversity also had a modest impact on travel demand but a bit stronger than that of density. Design elements of the built environment seemed to be particularly relevant to non-work trip-making. The general conclusion was that Higher densities, diverse land uses and pedestrian-friendly designs, ..., must co-exist to a certain degree if meaningful transportation benefits are to accrue. However, the synergy of the 3Ds in combination is likely to yield more appreciable impacts.
Another issue regarding city built environments is the number of parking spaces available. The level of parking supply is a factor that either encourages or discourages people to use PT. Especially in the cities where the parking spaces per car is limited, passengers are expected to be more volunteer to use PT. In the recent years, with an increase in the level of wealth and a continuous growth in the rate of population, the rate of increase in the car ownership exceeds the rate of increase in the parking spaces in cities, making the parking a serious matter even in the moderate size cities and a cumbersome problem in large cities. In contrast to European cities, where the rate of population increase is not too high compared to those, for instance, in many Turkish and Asian cities, the traffic congestion get worse and worse through the time in many big cities. Examples are many but for instance, the number of cars in traffic doubles in every ten years or so in the Turkish cities of Istanbul and Ankara in the last a few decades, partly due to the population increase and partly because of the increase in the level of wealth that come from the country’s economic growth. Such a circumstance puts more and more pressure on parking spaces available and puts burden on the shoulders of the local authorities, where PT comes forward as a solution. Development of parking places is both a matter of preference and a matter of suitability under the city’s built environment. For instance, while the cities such as Lyon have been quite successful to produce sufficient number of parking spaces, many cities have not been as successful as Lyon. This is partly because local authorities sometimes do not want to encourage the use of private car for urban transport and some cities do discourage it by reducing public and private parking supply like Zurich (Bonnel and Chausse, 2000). On the other hand, sometimes city built environment does not allow such major changes happen due to the lack of space and current space use.
Availability of parking spaces is important in the choice of transport mode. Bresson et al. (2003) pointed out to the role of parking spaces on the PT demand, saying that parking facilities are almost as damaging to PT as the availability of a car: on average, parking facilities for the working population are statistically equivalent to a 24 min saving on their trip time by car, which is equivalent to 1.5 times the average trip duration. Bonnel and Chausse (2000) also put attention on the issue saying Decisions as regards parking could play an important role in these snowball effects and such choices seem structurally important both for the cities and their inhabitants. The provision of parking spaces in new buildings and the construction of new car parks amount to commitments for the future and could be construed as important signals. However, it is too difficult to change the existing design structures especially in the old type of cities, where all type of economic, social and leisure activities are shaped around these centers and these formations have generally very limited parking spaces available. For such designs, the use of PT looks more encouraging or even more essential for the people who do not have their own reserved parking spaces. Otherwise, the cost of transport will be considerably higher because of high parking charges.
In sum, the 3Ds are an important demand determinants but PT demand can be shaped to a certain extent by utilizing specific land use policies that could affect PT use. Some policies may include the development of new residential areas, new commercial and industrial zones, mixed-use (e.g., merged commercial and residential areas) developments, car-free zones and transit-orientated development (Balcombe et al., 2004).
Government policies and approach to public transport: In many cities, local authorities (e.g., municipalities) consider providing PT services as one of their main duties for variety of reasons such as providing social support for the city dwellers with lower incomes, avoiding possible infrastructural and other expenses that could be borne otherwise. For instance, a further increase in the number of cars in the city is likely to produce extra problems such as air pollution and traffic congestion and cause more services (e.g., parking spaces, traffic services, road extensions) demanded. In this connection, PT services are considered to be ‘public goods’ or ‘semi-public goods’ and government authorities offer or, at least, regulate those services. If there are no private entities that offer them, public authorities undertake sustaining those services. That is why PT field generally is not treated same as the other commercial industries.
Additionally, PT services are considered to be networked goods, defined as a good for which ‘the satisfaction of the user or consumer is proportional to the number of other users’. The utility of the networked goods increases with the number of users. The networked good is, in principle, the combination of infrastructures with the properties of a public good (invisibility of supply and/or demand) and one or more additional goods, Because of their nature as a public good, the networked goods usually require state intervention and are, therefore, subject to the prevailing government policy in the field (Bonnel and Chausse, 2000). As being public goods, transport services differ in many ways from other commercial products. The government interventions especially to the supply (including in what form the services are delivered), distribution and pricing, the three basic elements of classical marketing mix, affect the level of demand for these products.
Governments are natural parties in transport supply. Either they have to develop and apply policies for transport infrastructure (e.g., road extending) or they have to involve in providing PT services such as many municipalities already do. Government policies may have major influences on PT. They may produce snowball effect on each way, either in developing PT infrastructure and encouraging PT demand and thus decreasing the supply of other transport modes or in increasing the car ownership and use. In many European and Asian cities, government policies are towards the encouragement of PT. The literature reports some successful policy applications that increased the PT use considerably in spite of the fact that it is increasingly difficult for PT to compete with private car. For instance, PT policies applied by the regional government in Madrid, Spain, increased the PT patronage by more than 50 % (Matas, 2004).
Bonnel and Chausse (2000) took attention to the variations in the policies being applied in European cities. For instance, while the user is allowed a free choice of transport mode in French cities of Lyon and Grenoble; the urban transport is deregulated in British cities of Cardiff and Liverpool; Italy wants to reduce the use of the car and she banned cars to enter the city center in Bologna and car use has been restricted and PT is being promoted in Swiss cities of Bern and Zurich, where the authorities have been committed to restricting the supply of roads. Regardless of encouragement or discouragement, government policies and approaches to the issue have significant effects on PT demand.
Nurdden et al. (2007) studied the policies aimed at discouraging the use of private transportation in case of Malaysia. The study sought to identify the factors that private transport users from utilizing PT, inspiring the development of rational policies toward greater utilization of PT. It was developed a binary logit model for three alternative modes: car, bus and train in the study. The most important factors found likely to encourage the use of PT were ‘reduced travel times’, ‘shorter distances’ from home to PT stations and ‘subsidized fares’, all of which effects and importance are already discussed and pointed out in the previous pages. The study concluded that proper incentives needed to be provided for a successful implementation for commuters to switch to PT.
Sometimes government policies are in form of subsidizing public transport. Asensio et al. (2003) stated that most cities in the developed world strongly subsidize PT services and analyzed the redistributive effects generated by the subsidization of those services. The authors estimated a two-stage model that takes into account both car ownership decisions and expenditure in urban public transport in order to measure the long run effects of income changes. They measured the progressiveness of the subsidies for different income groups and city sizes and found urban public transport subsidies to be progressive. The effect was found to be considerably more important in larger urban areas than it in small ones.
Government authorities sometimes use pricing (e.g., imposing toll charges on urban roads or lower PT fares) as a tool for managing transport demand, for instance, to reduce traffic congestion and rebalance the modal split between private vehicles and PT systems or even to protect environment by encouraging PT (discouraging private car) (Dargay, 2008) Toll charges are among the tools being frequently used to achieve the efficient use of transportation systems, which create revenues and maximizes social surplus, which can then be used to improve the PT system. Acierno et al. (2011) formulated a toll computation model to achieve the best use of a transportation network and analyzed the effects on optimal fare design when pricing revenues are wholly or partly used for improving PT.
Governments sometimes impose some disincentives in order to increase the attractiveness of PT, cycling and walking in form of traffic restraint measures, discouraging use of car. Thus the adverse environmental impacts of the automobiles are reduced (FitzRoy and Smith, 1998). Some of the measures taken are as follows: The ban on cars in the city center, alternating number plates, extensive pedestrianization, land use planning, low speed zones, higher parking charges and parking permits, different fare pricing policies for transport modes, road space sharing and traffic channelization.
Each of those disincentives surely have a certain degree of effect on PT demand, however, those measures should come as a package and one should support the other in order to achieve the desired results. Otherwise, the employment of only one or two of those would be insufficient to encourage the PT use adequately. Additionally, the existence of some other measures is required to increase the PT demand. In case of Freiburg, for instance, that the number of trips by PT doubled over the decade was achieved by the introduction of cheap travel passes with unlimited use, interpersonal transferability and wide regional validity (FitzRoy and Smith, 1998). Transferability among different modes of PT (e.g., between light rail and bus), interconnectivity of the transfer modes and support services (such as shuttle services provided between sub-streets and light rail lines in order to attract the passengers and increase the accessibility, as is done in Ankara and Istanbul). Additionally, timeliness, regularity and accessibility of the services are also significant.
FitzRoy and Smith (1998) studied the factors responsible for the rapid growth in PT use in the German City of Freiburg in order to distill lessons for transport policy and determined that the service quality was improved through the extensions in the bus and tram network in combination with an effective park-and-ride scheme. Both in Freiburg and some other cities, it was possible to see some incentives (e.g., low-cost and transferable season tickets) and disincentives imposed such as extensive pedestrianization, high parking charges and traffic calming measures (FitzRoy and Smith, 1998) to increase the PT demand. PT policies, no matter if they are in operational or planning level, had major effects on demand.
Other factors: Travel demand characteristics are closely related to passenger behaviors. To understand the PT system dynamics thoroughly, it is necessary to study the behavioral factors first. Although the studies such as Cervero and Kockelman (1997) pointed out how behavioral factors affect the transport demand and discussed the several aspects of the issue, that side of the subject still includes some important gaps and needs further investigations.
Human behavior is volatile and situation dependent. This creates a dilemma for public transporters and researchers especially in the long run. However, in the short term, total PT demand can be more predictable and difficult to change. Therefore, it should be possible to determine the general tendencies in passenger behaviors e.g., the factors that affect passenger decision-making in selecting the transport mode and the weights given for each of those factors.
The behaviors and trip patterns of travelers change over the time. Walle and Steenberghen (2006) pointed out the considerable change in the travel behavior triggered mainly by socio-economic changes in the past few decades. Levinson and Kumar (1995) compared the trip patterns of a number of households in Washington in 1968 with those of 1988, while only 1.5% of the work-to-home trips were not for work purposes in 1968, this number had increased to 15% in 1988. During this time, it was observed an increasing participation of women at the labor market and an increase in household income. Of course beyond behavioral factors, there exist some other issues as well. For instance, Bresson et al. (2003) commented that the petrol price, on the other hand, has a more substantial impact on the number of trips made per car than on the number of cars purchased; however, such factors are more observable and predictable.
Albalate and Bel (2010) investigated whether there were any regional differences in using public transport. They found that the existence of regional heterogeneity behind the design of urban PT supply had a significant explanatory power. The results exposed lower use of PT in Southern European Cities and relatively higher provision of PT in Eastern European Cities, a note for those who plan a comparable study of PT demand.
Marketing is another important demand determinant factor but this type of activities is generally weak in the urban PT industry. PT operators mostly rely on conventional forms of communication such as printed form of timetables, announcements and posters in vehicles and bus stops and a limited amount of newspaper/other media advertising. In recent years, some of those activities are also transferred to the internet but broad-based and systematic marketing endeavors are difficult to observe. Apart from those (mostly) traditional activities, they make little to communicate directly with non-users despite some limited promotional marketing activities regarding PT services, the benefits from which contribution exceed the associated costs, probably contributing to the level of revenues in a greater scale in the medium or long term Balcombe et al. (2004). Marketing can contribute much to the promotion of PT services and is likely to produce positive outcomes in encouraging public to use PT services. Although its effect is slightly different to measure, the techniques such as time series approach help us to determine how much marketing activities affect the total demand.
SUMMARY AND CONCLUSION
Determining PT demand is regarded as ‘important’ and several parties including but not limited to, PT planners, policy developers, operating executives, academicians etc., are interested in it. Many decisions are based on or linked to the PT demand. Setting fare levels, determining supply strategies, developing marketing strategies, car dependency reduction strategies, improving strategies dealing with traffic congestion and reducing environmental effects caused by motorized traffic are only a few of the decision areas where demand forecasts are used.
The transport literature is vast and spread out. It is not always easy to gather clear ideas, reach to final conclusions or find guidelines from the findings of the literature for managerial decisions or research directions, especially if a topic under interest is so widely discussed and approached it from so many aspects. In such cases the review of literature becomes more valuable and is needed a clear summary of the findings from the vastly collected literature e.g. in case of PT for aforementioned circumstances, where it has mostly produced uncommon or blurred conclusions in most of the demand forecasting studies. One of the main reasons for this is the demand forecasting area is broad and, given that the subject was focused on more specific topics, the issues are interconnected, the span area of the literature becomes considerably large. The other reason probably is that most of the studies are performed for the engineering purposes and not for the management one. Forecasting and the decisions based on forecast results are rather a managerial point of view and require a managerial approach. It can be assumed that while an engineering approach is more technical, the managerial point is more focused on the result. PT demand forecasting is dominated by the engineering studies and there is a gap to summarize the studies and their findings from the managerial aspect. This study reviewed the literature on transport with respect to the factors that influences the demand for PT services and discussed how those factors affect the demand in detail from the operational demand management point of view.
Present investigation on the literature has shown that the demand influencing factors can be investigated in two main points: structural factors of PT and external factors. The first one includes the cost of travel, service quality, travel time, travel distance, alternative transport modes, travel time, purpose of travel and level of transport supply. The latter includes PT dependency, demographic, economic and social factors, city built environments, government policies and approaches to PT and behavioral factors. Modeling requires measurable variables in quantitative models and PT demand requires quantitative modeling. Probably it would be too difficult for decision-makers and researchers to measure and/or quantify all the factors discussed above and include them in the models to be developed in an already complex PT modeling environment. This paper has presented the list of factors that should be taken into account for PT demand modeling and why those factors should be considered in addition to how they affect the PT demand.
The study has also included a discussion of the modeling studies of PT demand and the approaches used in those studies. In order give a wider perspective on the demand modeling studies not included in the discussion section because of their lower relevancy; a detailed table has been presented for the reader. The table included detailed information including the approaches, methods and the variables used in those studies.
In conclusion, this study has approached the PT issue with respect to the factors influencing PT services and modeling approach from the operational point of view to PT demand management. It has been perceived from the literature that although there exists many influential factors on the PT demand, many of those are not easy to measure and quantify for the purpose of modeling. Therefore, the future attempts of especially short-term modeling studies should consider how a specific factor can be quantified, controlled and measured for the sake of modeling, operations and demand management.
1Refer to the transport services being provided by public transport modes (e.g., bus, tram, light rail and metro) in urban networks, being open to general public. Taxis are also considered as PT mode but are different from traditional modes. Taxis have both complementary and competing role to/with traditional PT modes. They account about 10% of all PT trips in Great Britain Balcombe et al. (2004).
2Now on, the word ‘demand’ is used instead of ‘PT demand’ or ‘demand for PT’, where suitable and refers to the ‘urban PT demand’
3The terms ‘transportation elasticities’, ‘price elasticities’ or ‘fare elasticities’ are used interchangeably in order to define (transport) elasticities. It refers to how changes in transportation prices (fares, fuel, parking fees, tolls, etc.) affect travel behavior (VTPI, 2002 http://www.vtpi.org/tdm/)
4Different fare systems exist in practice. A fare system can be flat, zonal or graduated and each of these has its own specific characteristics. The fare system may include single or return cash fares, season tickets, travel cards etc.
5In simple form, the value of the fares elasticity is defined as the ratio of the proportional change in patronage to the proportional changes in fares. It has a negative value when, as expected, fares and patronage are inversely related. If the value of the elasticity is in the range of 0-(-1), an increase in fares will lead to increase in revenue. If the value exceeds ‘-1’, an increase in fares will lead to a decrease in revenue (Balcombe et al., 2004)
6A comprehensive study has been performed by Baker et al. (2005) on the urban poor for the case of Mumbai, India, based on the idea that the urban poor in developing countries face enormous challenges in their daily lives and relatively little is known about the transport behavior of those, their residential patterns, and how these are affected by transport policy. The study attempted to better understand the demand for transport services by the poor, the factors affecting this demand, and the inter-linkages between transport decisions and other vital decisions such as where to live and work.
7Car ownership affects PT demand negatively. For instance, a person in a car owning household is reported to make noticeably fewer trips by both bus (66% less) and rail (25% less) per week than a person in a non-car owning household (Balcombe et al. (2004): 24).
REFERENCES
- D'Acierno, L., R. Ciccarelli, B. Montella and M. Gallo, 2011. A multimodal multiuser approach for analysing pricing policies in urban contexts. J. Applied Sci., 11: 599-609.
CrossRefDirect Link - Cervero, R. and K. Kockelman, 1997. Travel demand and the 3Ds: Density, diversity and design. Transp. Res. Part D: Transp. Environ., 2: 199-219.
CrossRefDirect Link - Dargay, J.M. and M. Hanly, 2002. The demand for local bus services in England. J. Transport Econ. Policy, 36: 73-91.
Direct Link - FitzRoy, F. and I. Smith, 1998. Public transport demand in Freiburg: Why did patronage double in decade? Transport Policy, 5: 163-173.
CrossRef - Horn, M.E.T., 2003. An extended model and procedural framework for planning multi-modal passenger journeys. Transp. Res. Part B., Methodol., 37: 641-660.
CrossRef - Nurdden, A., R.A.O.K. Rahmat and A. Ismail, 2007. Effect of transportation policies on modal shift from private car to public transport in Malaysia. J. Applied Sci., 7: 1013-1018.
CrossRefDirect Link - Webster, F.V., P.H. Bly, R.H. Johnston, N. Paully and M. Dasgupta, 1986. Changing patterns of urban travel. Part 1: Urbanization, household travel and car ownership. Transp. Rev.: A Transnat. Transdiscip. J., 6: 49-86.
CrossRef
Prosper Nyaki Reply
Dear Partners
I tried to download this article by Sci-hub. p/s help me to get this article
Kind regard