
Asadollah Kazemi
Department of Electrical, Electronic and Systems Engineering, University Kebangsaan, Malaysia
Azah Mohamed
Department of Electrical, Electronic and Systems Engineering, University Kebangsaan, Malaysia
Hussain Shareef
Department of Electrical, Electronic and Systems Engineering, University Kebangsaan, Malaysia
Journal of Applied Sciences
Year: 2011 | Volume: 11 | Issue: 15 | Page No.: 2734-2743


ABSTRACT
This study presents a new method for locating voltage sag sources in power distribution networks. The proposed method estimates the voltages at the unmonitored buses by using the regression coefficients. First some bus voltages were monitored using power quality recorders in the power distribution system. Then, the voltage deviation index and the standard deviation index, represent the deviation of bus voltages before and after a disturbance were utilized to determine the voltage sag source location. To validate the proposed method, the IEEE 9 bus test system was used. The test results showed that the proposed method was accurate in determining the location of voltage sag sources in the test system.
PDF Abstract XML References Citation
Received: April 06, 2011;
Accepted: May 19, 2011;
Published: July 02, 2011
How to cite this article
Asadollah Kazemi, Azah Mohamed and Hussain Shareef, 2011. A New Method for Determining Voltage Sag Source Locations by using Multivariable Regression Coefficients. Journal of Applied Sciences, 11: 2734-2743.
DOI: 10.3923/jas.2011.2734.2743
URL: https://scialert.net/abstract/?doi=jas.2011.2734.2743
DOI: 10.3923/jas.2011.2734.2743
URL: https://scialert.net/abstract/?doi=jas.2011.2734.2743
INTRODUCTION
Voltage sag is one of the most important power quality problems faced by power utilities (Bashi, 2005). It is defined as a decrease in the Root Mean Square (RMS) voltage magnitude between 0.1 to 0.9 per unit (pu) for duration of 0.5 cycle to 1 min. Voltage sags are usually caused by short circuit, large motor starting and load switching ( Zakaria et al., 2008). These disturbances went unnoticed in the past but presently, due to the introduction of digital systems in most of the domestic and industrial loads, high quality power supply is needed at all times (Hosseinpour et al., 2008). Many power quality studies in the past concentrate on monitoring, detecting and mitigating disturbances (Chang et al., 2008; Salem et al., 2007). However, recent studies emphasize on identification of voltage sag sources to take action on the party responsible for the cause of voltage sags. By locating the source of voltage sag, disturbance responsibilities can be accurately determined and mitigation solutions can be designed to improve system performance (Hosseinpour et al., 2009).
From the literature, several voltage sag source location methods have been developed for determining the source of voltage sag from a single monitoring bus giving a directional result which is upstream or downstream. In the method proposed by Parsons et al. (2000), voltage and current waveforms are sampled at a particular node to identify voltage sag source. From the recorded pre sag and during sag values, the integral of the disturbance power was obtained to identify the voltage sag source location. If the final disturbance energy is positive the sag source is said to be located downstream from the monitor location. If the final disturbance energy is negative, the source of the sag is located upstream. In the concept presented by Li et al. (2003), the system trajectory slope is used to trace the sag source location. This method requires additional curve fitting tools to determine the trajectory of the system. Another method based on the real current component (1 cosθ) was developed for voltage sag source location (Hamzah et al., 2004). The method requires calculation of power factor angle using both recorded current and voltage waveforms. Tayjasanant et al. (2005) introduced a voltage sag source location method that uses the positive sequence voltage and current and the sign of a calculated resistance. A method based on distance relay concept was also developed for voltage sag source location (Pradhan and Routray, 2005). Barrera Nunez et al. (2008) proposed the use of two concepts for voltage sag source location in which the first concept is based on the phase change sequence current to estimate the origin of voltage sag while the second concept is based on the selection of the best multi way principal component analysis model for modifying the origin of voltage sag.
All the above mentioned methods identify voltage sag source location based on a single point monitoring. The single point monitoring method is only practical for a customer facility entrance in determining whether the voltage sag source is downstream, that is the source is at the customer premises or upstream of the monitoring location. However, voltage sag can spread over long distances from the source location and affect customers in large areas and therefore these methods are not applicable for identifying network wide voltage sag source locations which usually occur in a practical power system (Hamzah et al., 2009). In addition, single point monitoring methods may not be directly applicable for identifying multiple voltage sag source locations in a power system because it requires large number of recorders to accurately track the sag source location. Therefore, a system approach using multiple power quality monitors is required to locate network wide sources of voltage sags without having to install monitors at every bus in a power distribution network (Seon et al., 2008).
Existing methods for identifying network wide voltage sag source locations consider the use of a deviation index of each branch current and deviation index of voltage bus by means of matrix coefficients (Chang et al., 2008; Latheef et al., 2008). Based on the sensitivity of the system fault current level, the current deviation index is developed for identifying the location of voltage sag sources (Chang et al., 2008). However, the current deviation index method requires an exhaustive trial and error search for finding the voltage sag source locations. In a more recent sag source location method, the voltage deviation index based on system coefficient matrix is used to estimate the unmonitored bus voltages and observe the recorded bus voltages at the PQ monitoring locations (Latheef et al., 2008). Based on the available bus voltage measurements and relationship established from the coefficient matrix, a mean square error is estimated. Hence, after estimating the unmonitored bus voltages, the location of voltage sags is identified by using the voltage deviation index. The bus with maximum voltage deviation is considered as the voltage sag source location. However, this method has a limitation in which it requires the use of network impedance matrix which is usually time consuming to construct especially for large sized power systems. Both the sag source location methods using the current deviation and voltage deviation indices (Chang et al., 2008; Latheef et al., 2008), have their limitations and therefore a more accurate and efficient sag source location method is required. In this paper, a new method for identifying voltage sag source locations in a power system is proposed based on the multivariable regression model. Initially, all the observed or monitored bus voltages are recorded and then the regression coefficients are calculated. The unmonitored bus voltages are estimated by using the multivariable regression model and the voltage sag source locations are tracked from the maximum voltage deviation value and the lowest standard deviation value. The IEEE 9 bus test system is used for verifying the effectiveness of the proposed method in locating sources of voltage sags.
MATERIALS AND METHODS
Regression type problems were first considered in the 18th century for navigation purposes. Later, with the advent of high speed computing, regression analysis developed rapidly and the scope of analysis has expanded from logistic regression analysis to position regression. Regression analysis has several possible applications including prediction of future observations, assessment of the effect of relationship and general description of data structure. Generally, regression analysis is used for explaining or modelling the relationship between a single variable called as the output or dependent variable and one or more predictor or independent variables (Hines and Montgomery, 1990). When there is one independent variable it is called as a simple regression but when there are more than one independent variable it is called as multiple regression or sometime multivariable regression.
The multivariable regression model is one of the statistical techniques used in applied sciences. Multiple regression finds a set of partial regression coefficients, Bj such that the dependent variable, Y can be approximated by a linear combination of the ‘k’ independent variables, x. A predicted value, denoted by Y dependent variable is obtained as:
| (1) |
where, Bj, (0,1,2,..., k) are unknown parameters of regression coefficients and ε is a random error.
For ‘n’ number observations, Eq. 1 can be written in matrix form as:
| (2) |
Where:
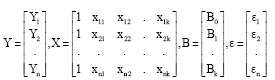 |
Here, Y is a (nx1) vector for observation, X is a (nxp) matrix corresponding to p number of independent variable, B is a (px1) vector of regression coefficients and ε is a (nx1) vector for random errors.
The best estimation of B can be considered as that which minimizes the sum of the squared errors. To minimize the vector of least squares estimate, have:
| (3) |
Expanding Eq. 3:
| (4) |
Differentiating Eq. 4 with respect to B and setting to zero, the minimum square estimate has to obey the following condition:
| (5) |
where, X'Xb is a function of minimum square normal with solution that gives the value of minimum square estimate, b which is written as:
| (6) |
The estimated regression model now becomes:
| (7) |
The difference between the observed (Yi) and estimated ![]() variables is the error that is given by Hines and Montgomery (1990).
variables is the error that is given by Hines and Montgomery (1990).
| (8) |
VOLTAGE SAG SOURCE LOCATION METHOD
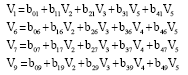
For estimating the unmonitored bus voltages using the Multivariable Regression (MVR) coefficients, it is assumed that a number of power quality monitoring devices are installed at specified buses in the system. After specifying the number of PQ monitoring devices, the Regression Coefficients (RC) at all the buses are calculated using Eq. 7. These RC values are obtained and are used to estimate the voltages at the unmonitored buses. The location of voltage sag source is then identified based on the maximum VD value and the minimum SD value.
The voltage deviation: When voltage sags are presented in a power system, the bus voltage waveform will deviate from their normal steady state voltage waveform. So, if a fault occurs in the bus, then the bus has the most voltage deviation. This VD is given by:
| (9) |
where, ΔV is the voltage deviation, Vss is the steady state bus voltage and Vsag is the voltage sag value.
The standard deviation: The SD of a data set is a measure of how spread out the data is. By definition, the SD is the average distance from the mean of the data set to a point and it is calculated by using the following equation.
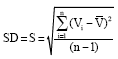 | (10) |
where, n is the number of data set, Vi is the estimated voltage set from the MVR and ![]() is the mean estimated voltage.
is the mean estimated voltage.
The regression coefficient and voltage sag source location procedure: The RC is a constant that represents the rate of change of one variable as a function of changes in the other. It is the slope of a regression line (Hines and Montgomery, 1990). Consider the estimated bus voltage which is given by:
| (11) |
where, Vi is the estimated voltage, Vjm is the measured voltage, bj is the regression coefficient, b0 is the intercept point of the regression line and the y axis, k is the number of PQ devices and n is the number of buses in a power system.
Based on the MVR model, some buses are installed with PQ devices while at the remaining buses, the voltage magnitudes are estimated by using Eq. 7. Therefore, it is necessary to first calculate the RC before estimating the unmonitored bus voltages. The steady state and faulted voltages are then used to calculate the RC based on Eq. 6. If a fault occurs at a bus, then by using the MVR model, the voltages at the unmonitored buses can be estimated. Figure 1 shows the procedures involved in determining the location of voltage sag source in terms of a flowchart. The procedures are described as follows:
| • | Step 1: Record the voltages at the monitored buses during a fault and read bus number for I = 1 and k = 1 |
| • | Step 2:Is i equal to bus number 2, 3, 4 or 5? If yes, then increment 1 to i and return to step 2, else go to step 3 |
| • | Step 3:Estimate the unmonitored bus voltages using Eq. 7 for bus i |
| • | Step 4:Is i equal to n? If yes, then go to step 5, else increase 1 to i and return to step 2 |
| • | Step 5:Calculate the VD at bus k using Eq. 9 |
| • | Step 6:Check for the maximum value of VD at bus k. If the VD value is maximum then continue to step 7, else check k = n. If k equal n, then go to step 8 else increment 1 to k, I = 1 and return to step 2 |
| • | Step 7:Save the bus number and the VD value of bus k and then check k = n. If k equal n, then continue to step 8 else increase 1 to k, I = 1 and return to step 2 |
| • | Step 8:Calculate the SD by using Eq. 10 and select the minimum value of SD |
| • | Step 9:The bus number with minimum SD value is considered as the location of voltage sag |
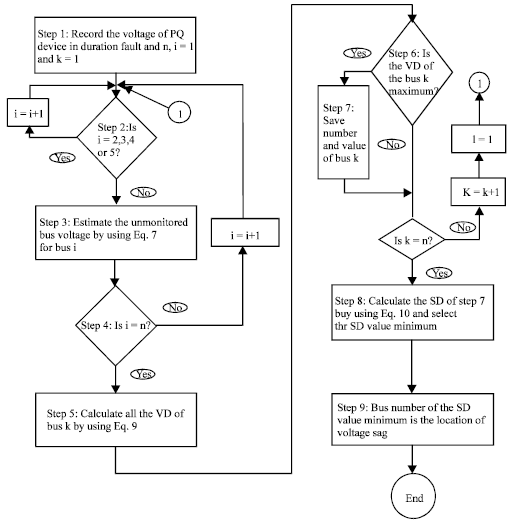 | |
| Fig. 1: | Flowchart of the voltage sag source location |
RESULTS
To demonstrate the effectiveness of the MVR model in estimating the unmonitored bus voltages for determining the voltage sag source locations, the IEEE 9 bus test system is considered as shown in Fig. 2. For the IEEE 9 bus test system, bus 1 is the slack bus, bus 2 and bus 3 are the two voltage controlled buses and the remaining buses are the 6 load buses. The Power Quality (PQ) recorders are installed at bus 2, 3, 4 and 5. Power flow and short circuit simulations were performed using the Digsilent power factory software and calculations for RC, VD and SD were done using the Matlab software.
In the simulations, six switching load tests, single line to ground fault (LG) of phase A, two phase to ground fault (LLG) of phases B and C and three phase fault (LLL) at all buses are considered to simulate the voltage sag conditions. The fault impedance considered ranges from 0.01 to 1. Fault simulation were carried out to determine the RC values given in Eq. 6.
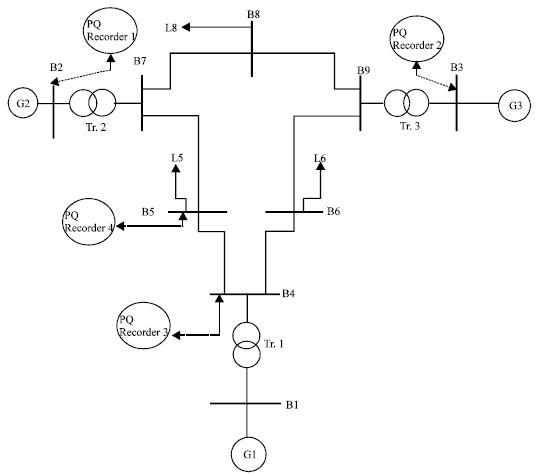 | |
| Fig. 2: | One line diagram of the IEEE 9 bus test system |
| Table 1: | Various disturbances created to estimate the unmonitored bus voltages |
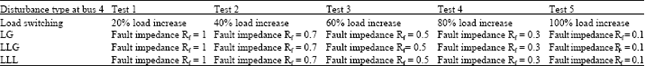 | |
At every load switching or short circuit test and using the RC values, the estimated voltages at the unmonitored buses are determined by using the relationship between the estimated and the measured voltages which is given by:
 |
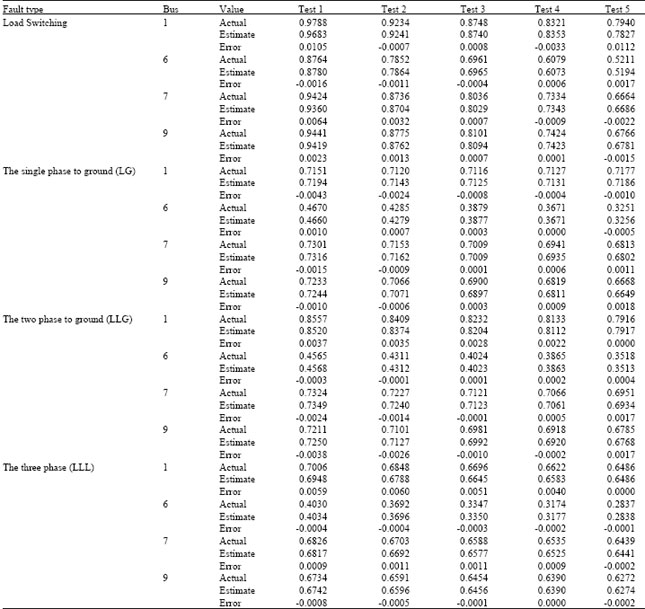
The unmonitored bus voltages at bus 1, 6, 7 and 9 are estimated from the various disturbances simulated as described in Table 1. These estimated bus voltages and then compared with the actual voltage values as shown in Table 2 for the various disturbances described in Table 1. The error values indicated in Table 2 are the differences between the actual and estimated voltage values at bus 1, 6, 7 and 9 when faults occur at bus 4. For example, if the three phase short circuit occurs at bus 4, then the error values shown in Table 2 for bus 7 for five tests shown in Table 1 are 0.0009, 0.0011, 0.0011, 0.0009 and -0.0002 respectively. These error values are considered small, approximately 0.001 and therefore the results prove that the effectiveness of the MVR model in estimating the unmonitored bus voltages.
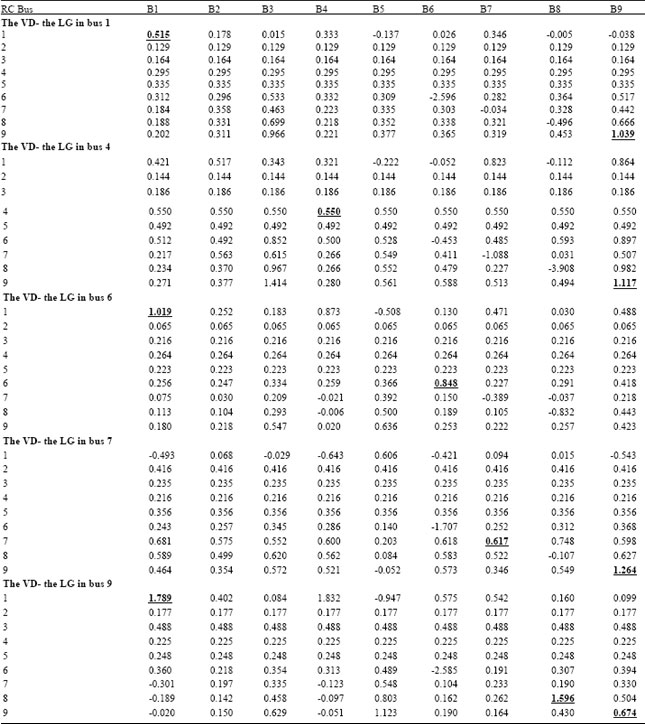
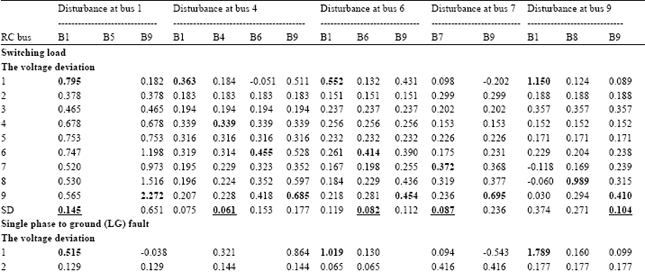
Considering the voltage outputs of LG faults at bus 1,4,6,7 and 9, the VD at all the buses are calculated as shown in Table 3 using RC matrices B1 to B9. To determine the sag source location, consider the maximum VD values at each bus obtained by B1 to B9.It is noted that the maximum VD values as underlined, appear not only at the faulted bus and but also the bus connected to the faulted bus. That means, maximum VD values gives a close estimation of voltage sag source. For example, if the LG fault occurs at bus 9, Table 3 shows that the maximum VD values at buses 1, 8 and 9 are 1.789, 1.596 and 0.674, respectively. This means that maximum VD values alone is not sufficient to find the exact location of voltage sag source.
| Table 2: | Actual and estimated voltages at buses 1,6,7 and 9 when a fault occurs at bus 4 |
 | |
| Table 3: | VD at all buses when LG faults occur at bus 1, 4, 6, 7 and 9 |
 | |
| Table 4: | The VD and the SD values when the disturbance of load switching, LG, LLG and LLL faults occur at bus 1,4,6,7 and 9 |
 | |
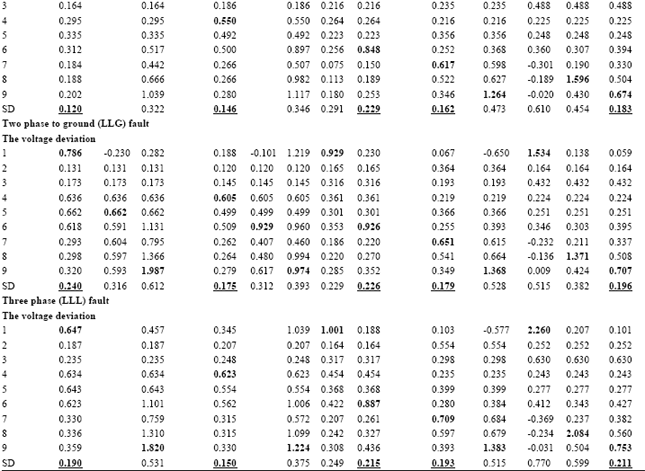 | |
Here bus 1, 8 and 9 are possible locations of the fault.
For identifying accurate voltage sag source location, the SD index is calculated using Eq. 10. Table 4 shows the VD and SD values for the cases of switching load, single line to ground fault, double line-to-ground fault and three phase (LLL) fault occurring at bus 1,4,6, 7 and 9. From the SD values shown in Table 4, it can be seen that minimum SD values as indicated by the underlined numbers appear at the fault locations which are actually the voltage sag sources. For instant, in the case of load switching, if the switching disturbance occur at bus 4 then the VD value in 1, 4, 6 and 9 calculated using RC matrix B1, B4, B6 and B9 has maximum at the corresponding row of the bus. The SD values of the estimated VD values using the same RC matrices are 0.075, 0.061, 0.153 and 0.177 respectively. Among these, the minimum SD value is 0.061 and it corresponds to VD values obtained with RC matrix B4. Therefore, bus 4 is the actual location of voltage sag source.
DISCUSSION
From the results illustrated in Section 4, it is clearly seen that the proposed method can accurately pinpoint the voltage sag source location. It uses multivariable regression coefficients, voltage deviation and the standard deviation indices for the purpose. When compared to branch current deviation index method proposed by Chang et al. (2008), it can only identify a possible areas of voltage sag unlike the exact point of the sag as proposed in this paper. Moreover, the new method did not use system impedance matrix as in (Latheef et al., 2008). Instead the proposed method utilized the regression coefficients to estimate the bus voltage deviation index. Besides, the use of only voltage deviation index to determine the voltage sag source suggested by Latheef et al. (2008) will not provide accurate results because not only the faulted bus shows the maximum voltage deviation as seen in Table 3 and 4 but it may also appear on nearest buses to the fault. Therefore, as suggested in this paper minimum standard deviation need to be obtained among the buses having the maximum voltage deviation.
Furthermore, the proposed method is not suitable to compare with single point sag source location methods such as Parsons et al. (2000), Li et al. (2003) and Hamzah et al. (2004), since they serve just like direction finders where the results only shows either upstream or downstream from the monitoring point. The single point methods are much more inaccurate compared to multipoint monitoring based methods such as the one proposed in this work. In addition, the MVR method presented in this work has the advantages over all other methods because it identifies the voltage sag source location accuracy and uses only strong statistic mathematical techniques. Finally, it is to be notes that all the conventional methods are in support with the results highlighted in this study. The main difference in the results of the proposed methods is the significant improvement in locating the sag source from very general sag source direction detection to exact point of sag location.
CONCLUSION
A new method for locating voltage sag sources in power systems is proposed. It is based on statistical methods namely, multiple regression coefficients, voltage and standard deviation index. The regression coefficients are used to determine the unmonitored bus voltages. Then using the maximum voltage deviation and minimum standard deviation index, the voltage sag source locations are identified. To validate the proposed method the IEEE 9 bus test system is utilized. The test results prove the accuracy of the proposed voltage sag source location method.
REFERENCES
- Barrera Nunez, V.A., X. Berjaga Moliner, J. Melendez Frigola, S. Herraiz Jaramillo, J. Sanchez and M. Castro, 2008. Two methods for voltage sag source location. Proceeding of the 13th International Conference Harmonics and Quality of Power, Sept. 28-Oct. 1, Australia, pp: 1-6.
CrossRefDirect Link - Bashi, S.M., 2005. Microcontroller-based fast on-load semiconductor tap changer for small power transformer. J. Applied Sci., 5: 999-1003.
CrossRefDirect Link - Chang, G.W., J.P. Chao, H.M. Huang, C.I. Chen and S.Y. Chu, 2008. On tracking the source location of voltage sags and utility shunt capacitor switching transients. IEEE Trans. Power Delivery, 23: 2124-2131.
CrossRef - Hamzah, N., A. Mohamed and A. Hussain, 2004. A new approach to locate the voltage sag source using real current component. Electric Power Syst. Res., 72: 113-123.
CrossRef - Hamzah. H., A. Mohamed and A. Hussain, 2009. Development of new algorithm for voltage sag source location. Proceedings of the International Multi Conference of Engineers and Computer Scientists, March 18-20, 2009, Hong Kong, China, pp: 1-6.
Direct Link - Hosseinpour, M., A. Yazdian, M. Mohamadian and J. Kazempour, 2008. Design and simulation of UPQC to improve power quality and transfer wind energy to grid. J. Applied Sci., 8: 3770-3782.
CrossRefDirect Link - Hosseinpour, M., Y. Mohamadrezapour and S. Torabzade, 2009. Combined operation of unified power quality conditioner and photovoltaic array. J. Applied Sci., 9: 680-688.
CrossRefDirect Link - Latheef, A., M. Negnevitsky and V. Faybisovich, 2008. Voltage sag source location identification. Proceeding of the 20th International Conference and Exhibition on Electricity Distribution, June 8-11, Prague, Czech Republic, pp: 604-604.
CrossRef - Li, C., T. Tayjasanant, W. Xu and X. Liu, 2003. Method for voltage sag source detection by investigating slope of the system trajectory. IEEE Proc. Gen. Trans. Distrib., 150: 367-372.
CrossRefDirect Link - Parsons, A.C., W.M. Grady, E.J. Powers and J.C. Soward, 2000. A direction finder for power quality disturbances based upon disturbance power and energy. Proceedings of the 8th International Conference on Harmonics and Quality of Power, Oct. 14-16, Athens, Greece, pp: 693-699.
CrossRef - Pradhan, A.K. and A. Routray, 2005. Applying distance relay for voltage sag source detection. IEEE Trans. Power Delivery, 20: 529-531.
Direct Link - Salem, M.E., A. Mohamed and S.A. Samad, 2007. Power quality disturbance detection using DSP based continuous wavelet transform. J. Applied Sci., 7: 893-902.
CrossRefDirect Link - Seon, J.A., J.W. Dong, Y.C. Ii and I.M. Seung, 2008. A new approach to determine the direction and cause of voltage sag. J. Electr. Eng. Technol., 3: 300-307.
CrossRef - Tayjasanant, T., C. Li and W. Xu, 2005. A resistance sign-based methode for voltage sag source detection. IEEE Trans. Power Delivery, 20: 2544-2551.
CrossRef - Zakaria, Z.A., B.C. Chen, M.O. Hassan and J.X. Yuan, 2008. Distribution static compensator used as custom power equipment and its simulation using PSCAD. Inform. Technol. J., 7: 1141-1148.
CrossRefDirect Link