
G. Hussain
National Center for Water Research, King Abdulaziz City for Science and Technology, P.O. Box 6086, Riyadh, 11442, Kingdom of Saudi Arabia
A. Alquwaizany
National Center for Water Research, King Abdulaziz City for Science and Technology, P.O. Box 6086, Riyadh, 11442, Kingdom of Saudi Arabia
A. Al-Zarah
National Center for Water Research, King Abdulaziz City for Science and Technology, P.O. Box 6086, Riyadh, 11442, Kingdom of Saudi Arabia
Journal of Applied Sciences
Year: 2010 | Volume: 10 | Issue: 2 | Page No.: 79-96


ABSTRACT
A comprehensive review summarized the total available water supplies, water quality evaluation and the potential management strategies for efficient utilization of the available water resources in the Kingdom of Saudi Arabia. The review discussed different water quality classifications applied elsewhere on the use of different types of surface, drainage waters and groundwater irrespective of the total salinity status and the conditions of use.
PDF Abstract XML References Citation
How to cite this article
G. Hussain, A. Alquwaizany and A. Al-Zarah, 2010. Guidelines for Irrigation Water Quality and Water Management in The Kingdom of Saudi Arabia: An Overview. Journal of Applied Sciences, 10: 79-96.
DOI: 10.3923/jas.2010.79.96
URL: https://scialert.net/abstract/?doi=jas.2010.79.96
DOI: 10.3923/jas.2010.79.96
URL: https://scialert.net/abstract/?doi=jas.2010.79.96
INTRODUCTION
Saudi Arabia is an arid country with a total land area of 2.253x10⁶ km2. The total cropped area in the Kingdom increased from 1.25 (1988) to 1.51 (1992) million hectares (Ministry of Agriculture and Water, 1992). Consequently, the demand for irrigation supplies showed manifold increases from 1.75 billion m3 in 1975 to 22.93 billion m3 in 1992 (Dabbagh and Abderrahman, 1997). According to an estimate, more than 80% of water demand in agriculture sector is currently being met from non-renewable groundwater sources. To meet the growing demand of water for domestic, industrial and agriculture sector, exploration of alternative source of water especially for use in agriculture is important. Abu-Rizaiza (1999) stated that the Saudi standards for effluent are stringent and unintentionally impose unnecessary limitations on disposal and reuse of wastewater. He presented wastewater reuse regulations and existing treatment facilities and argues the case for a more discriminating set of standards which would allow a variety of reuses for present wastewater production at different sites.
Quality of irrigation water is determined by its chemical composition and the conditions of use. Because all the waters, surface or sub-surface, contain soluble salts which increases the concentration of the soil solution upon irrigation. The main objective of this review paper is to highlight irrigation water quality criteria and the management strategies for optimizing the use of available water resources for sustainable irrigated agriculture in the Kingdom of Saudi Arabia.
Climate of Saudi Arabia: The Arabian Peninsula is located in an arid belt extending from Northern Africa through Arabian Peninsula, Iran and Mongolia. The yearly potential evaporation (Hofuf-3359 mm) is much greater than the yearly mean rainfall (Hofuf-69.6 mm). High evaporative conditions along with short irrigation supplies determine the hydrology, land development and vegetation of the area. High temperature during summer is the most significant climatic factors of Saudi Arabia. An extreme maximum air-temperature of 51.3°C was recorded at Hofuf in June 1983. However, in general, the maximum daily air-temperature often exceeds 45°C and the relative humidity is also very low in summer. The diurnal variation of the air-temperature is strikingly high and causes the apparent diurnal variations of relative humidity. Though the overall air-temperature variation have been observed from -2.6 to 51.3°C but night frosts are rare (Lin, 1984).
SOIL TYPES OF SAUDI ARABIA
According to the Land Management Department, Ministry of Agriculture and Water (1985), there are three extensive areas of sand dunes covering about 40% of the Kingdom’s land. The land has been classified as below:
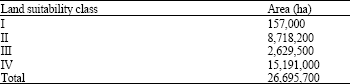 |
The land suitable for agriculture consists mainly of alluvial soil developed by the weathering of silt stone, shale and sandstone and thoroughly mixed by the action of wind and water, or deposited in layer of varying textures. Soil suitable for cultivation contains loamy sand or sandy loam textural classes with predominantly coarse soil. The soil is usually calcareous and in some cases contains gypsum. Different soil types have been developed due to the difference in soil forming processes such as high temperature, aridity and wind erosion. The chemical weathering of the soil occurs at a slow rate due to low rainfall, although some areas contain high level of soluble salts. In general, the soils are low in organic matter (less than 1%), available phosphorous and available nitrogen and adequate in potassium. The dominant soil types include Entisols, Inceptisols and Aridisols. The high level of CaCO3 and the coarse texture of soils advocate adoption of special fertility management practices for increased land productivity. The chemical characteristics of soils from some major agricultural production areas in the Kingdom are summarized below (Table 1).
| Table 1: | Chemical characteristics of soils from some agricultural areas in the Kingdom |
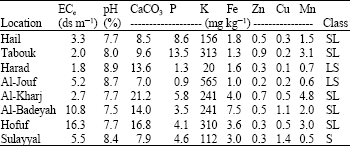 | |
| SL: Sandy loam, LS: Loamy sand, S: Sandy. Source: Water Atlas of Kingdom of Saudi Arabia (1985) | |
WATER RESOURCES
There are no perennial streams or rivers in Saudi Arabia, therefore, the main water sources are underground water aquifers, rainfall and seawater desalination. A brief detail of these is summarized below:
Groundwater: The quantity and quality of groundwater depend on the geological formation of underlying strata, the size of aquifer and the site location. The groundwater is classified into four hydro-geological zones i.e. confined aquifers, main aquifers, free flowing aquifers and the springs. Agriculture largely draws water from the main aquifers. There are in all nine main aquifers (Noory, 1983; Water Atlas of Kingdom of Saudi Arabia, 1985). The flow rate and water salinity of these aquifers are presented in Table 2.
Mean chemical composition of some selected groundwater is given in Table 3.
| Table 2: | Salient features of major aquifers in Saudi Arabia |
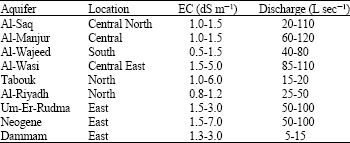 | |
| Source: Noory (1983) | |
| Table 3: | Chemical composition of some selected waters |
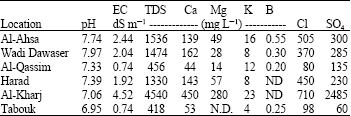 | |
| ND: Not determined.Source: Water Atlas of Kingdom of Saudi Arabia (1985) | |
Rainfall: Rainfall which occurs normally between October and April in most of the Kingdom is highly unpredictable, sporadic and the seasonal variations are also very high. The mean annual rainfall is 100 mm or less, except in the mountainous part of the northern region (Asir) where in excess of 500 mm are not uncommon over some small areas (Lin, 1984).
Desalination: Water demand for various uses increased tremendously over the last decade due to extensive rural and urban development. To meet the growing water needs, construction of desalination plants for freshwater supply was inevitable. The quantity of water produced by the sea water desalination plants in various regions of Kingdom of Saudi Arabia ranged from 989.31 million cubic meters in 2002 to 1.033 billion cubic meters in 2006 according to Saline Water Conversion Corporation, Kingdom of Saudi Arabia (2006).
Other resources: The treated and un-treated wastewater is another potential source of supplemental irrigation for expansion of irrigated agriculture, landscape development and establishment of windbreaks along the main highways, oil refineries and potential agriculture farms to minimize sand encroachment.
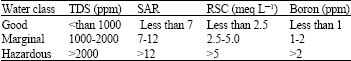
CRITERIA FOR IRRIGATION WATER QUALITY EVALUATION
Total water salinity: The total water salinity is expressed as Total Dissolved Solids (TDS) in mg L-1, or the electrical conductivity in dS m-1. It is the total water salinity which is responsible for the build up of salts in soils after irrigation. The soil salinity increases in direct proportion to the salinity of irrigation water and total depth of water applied. The reduction in plant growth and crop's yield is mainly caused by the increase in osmotic potential of soil solution which takes place due to addition of excessive salts through irrigation water. This increase in osmotic potential reduces the availability of water to plants which results in stunted growth and significant yield losses.
The reduction in plant growth and yield is almost proportional to the concentration of the salts in soil solution in and around root zone. Since 70-90% of water uptake by plants takes place in the upper active root zone (50%), hence the effect of soil salinity on plant growth and performance might be less than as predicted by earlier investigations which were carried out either in sand culture or under concept of uniform soil salinity in plant root zone. Bernstein and Francois (1963), Rhoades et al. (1973) and Rhoades (1974) stated that fairly high slat concentration in the lower root zone and with much lower salt concentration in the upper root zone did not reduce crops yield significantly. Therefore, the previous salt tolerance limits of crops (US Salinity Lab. Staff, 1954) can be revised and raised substantially for utilization of more mineralized irrigation waters.
Sodium Adsorption Ratio (SAR): The relative proportion of sodium (Na+) to calcium (Ca+2) and magnesium (Mg+2) is expressed as Sodium-Adsorption-Ratio (SAR), or the adj.SAR or the adj.RNa ratio. These criteria evaluate the sodium hazards of the irrigation water on becoming soil solution after irrigation. The effects of sodium are manifold such as specific nature of plant toxicity, impaired soil drainage and plant nutrition imbalance. The mechanism involved is that the high sodium contents of irrigation water increases the exchangeable sodium contents on soil exchange complex and disperses the soil more rapidly. The dispersed soil particles seal the soil macro-pores and reduce the soil permeability. Under these conditions, the water availability to plant is also reduced appreciably.
| • | The Sodium Adsorption Ratio (SAR) is calculated as below: |
SAR = Na/[(Ca + Mg)/2]1/2 |
| • | The Adjusted Sodium Adsorption Ratio (adj.SAR) is calculated as below (Ayers and Westcot, 1985): |
adj.SAR = SARiw [1 + (8.4-pHc] |
The adj.SAR takes into account the effect of Na and CO3+HCO3 of irrigation water on soil properties. This concept was developed by Bower and Massland (1963) and has been found very useful for predicting the effect of sodium hazard of irrigation water on soil properties.
An alternate procedure discussed in the following paragraphs, takes a new look at the older SAR equation and adjusts the calcium concentration of the irrigation water to expected equilibrium value following an irrigation and concludes the effects of carbon dioxide (CO2), bicarbonate (HCO3) and the salinity (ECw) upon the calcium initially present in the applied water but now a part of the soil water. The procedure assumes a soil source of calcium- from soil lime (CaCO3) or other soil minerals such as silicates- and no precipitation of magnesium.
The new term for this is the Adjusted Sodium Adsorption Ratio (adj.RNa) and can be used to predict more correctly potential infiltration problems due to relatively high sodium (or low calcium) in irrigation supplies (Suarez, 1981; Rhoades, 1984) and can be substituted for simple SAR. The equation for calculation of adj.RNa of surface soil is very similar to the older SAR equation and is (Suarez, 1981):
adj. RNa = Na/[(Cax + Mg)/2]1/2 |
Unlike salinity, the effect of sodium hazard of irrigation water on plant growth and yield is indirect. The concept regarding sodium hazard from irrigation waters developed by Bower and Massland (1963) is being used to predict the effect of sodium hazard on soil properties which in turn affect plant growth and yield. It has been established that if exchangeable sodium percentage (ESP) of soil exceeds 15, the soil permeability decreases correspondingly. In addition to the above, excess of soluble sodium in soil solution directly affects plant growth and yield of some sodium sensitive plants such as trees, crops and woody perennial plants.
Residual Sodium Carbonate (RSC): The residual-sodium-carbonate (Na2CO3) in waters is determined as the excess of CO3-2 and HCO3¯ over that of Ca+2 and Mg+2 concentration in the irrigation water when expressed in milli-equivalents per liter. It gives an over view of the soil permeability problems irrigated with high sodium waters than the normal irrigation waters.
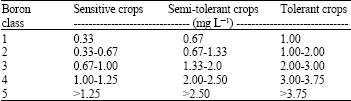
Boron concentration: The boron (B) concentration is expressed in mg L-1 in the irrigation waters to determine its toxic limits. The concentration of boron in excess of 1 mg L-1 will cause crop damage (Ayers and Westcot, 1985).
Toxic effects of specific ions: Specific ion toxicity normally results when certain ions are taken up with the soil-water and accumulate in the leaves during water transpiration to an extent that results in damage to plants. The magnitude of damage depends upon time, concentration, crop sensitivity and crop water use and if damage is severe enough, crop yield is reduced. The usual toxic ions in irrigation water are chloride, sodium and boron. The toxic symptoms appear in the form of leaf burn, scorch, dead tissues along the side of the leaf, drying of leaves, yellowing of leaf and spotting on the leaf etc.
Chloride: The most common toxicity is from chloride in the irrigation water. Chloride is not absorbed or held back by soils, therefore, it moves readily with the soil-water, is taken up by the crops, moves in the transpiration stream and accumulates in the leaves. If the chloride concentration in the leaves exceeds the tolerance of the crop, injury symptoms develop such as leaf burn or drying of the leaf tissue. The limits for chloride toxicity for some fruit crop cultivars are given by Ayers and Westcot (1985).
Sodium (Na): Sodium toxicity is not as easily diagnosed as chloride toxicity, but clear cases of the former have been recorded as a result of relatively high sodium concentrations in the water (high Na or SAR). Typical toxicity symptoms are leaf burn, scorch and dead tissue along the outside edges of leaves in contrast to symptoms of chloride toxicity which normally occur initially at the extreme leaf tip. Sensitive crops include deciduous fruits, nuts, citrus, avocados and beans, but there are many others. For tree crops, sodium in the leaf tissue in excess of 0.25-0.50 percent (dry weight basis) is often associated with sodium toxicity (Ayers and Westcot, 1985).
Boron: Boron, unlike sodium, is as essential element for plant growth. It is required in relatively small amounts. However, if present in amounts appreciably greater than needed, it becomes toxic. For example, for some crops, if the permissible limit is 0.2 mg L-1 boron in irrigation water, then the concentration of 1-2 mg L-1 may be toxic (Ayers and Westcot, 1985).
Soil salinity development (SSD) was calculated according to FAO (1985) and the ESP was predicted according to USDA, 1954 as below:
where, SAR is the SAR of the soil solution resulting from irrigation with groundwater. The salinity and sodicity hazards of the irrigation waters were determined according to the classification given by USDA Handbook No. 60, 1954.
REVIEW OF IRRIGATION WATER CLASSIFICATION SCHEMES
Irrigation water quality classification is important for optimizing the use of available water resources. The irrigation water quality depends on a number of factors for its successful application and beneficial uses. These factors include soil type, crop selection, climatic conditions, irrigation methods adopted, drainage conditions of the area, fertilizer use, farm management practices followed and irrigation supplies.
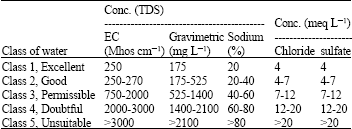
A number of irrigation water quality classification schemes have been proposed by many researchers dealing with irrigation management. Some have proposed classification schemes based on two or more factors, usually total salinity and the relative amount of sodium. In some instances boron and residual carbonate have been included. Scofield (1933) and Eaton (1942) indicated that waters with a sodium percentage of 70 or more were generally unsuitable for irrigation. Scofield (1936) published a table of permissible limits for irrigation waters which include consideration of chloride and sulfates in addition to salinity and sodium percentage (Table 4).
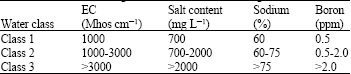
Wilcox and Magistad (1943) adopted more simplified classification as given in Table 5.
Wilcox (1948) suggested a different classification as diagramed in Fig. 1. The main difference in this scheme and previous classifications is that waters having a low salt concentration in conjunction with a high sodium percentage (60-90%) could be rated as excellent.
Wilcox (1948) also presented a table of permissible limits similar to that given by Scofield (1933) except that it did not contain limits for Cl and SO4.
| Table 4: | Permissible limits for classes of irrigation water (Scofield, 1936) |
 | |
| Table 5: | Standards for irrigation water (Wilcox and Magistad, 1943) |
 | |
Class 1: Excellent to good, suitable for most plants under most conditions. Class 2: Good to injurious, probably harmful to more sensitive crops. Class 3: Injurious to unsatisfactory, probably harmful to most crops and unsatisfactory for all the most tolerant crops. If a water falls in class 3 on any basis, i.e., electrical conductivity, salt content, it should be classed as unsuitable under most conditions. Where the salt present are mostly sulfates, the value for salt content in each class can be raised 50% | |
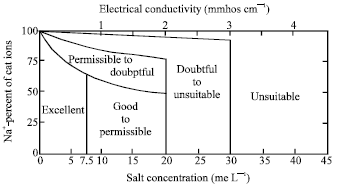 | |
| Fig. 1: | Water classification according to Wilcox (1948) [Redrawn] |
 | |
| Fig. 2: | Water classification Scheme by Thorne and Thorne (1951) |
 | |
| Fig. 3: | Water classification Scheme by USDA (1954) |
 | |
| Fig. 4: | Sodium diagram according to Wilcox (1948) |
| Table 6: | Permissible limits of boron for several classes of irrigation waters (Scofield, 1936) |
 | |
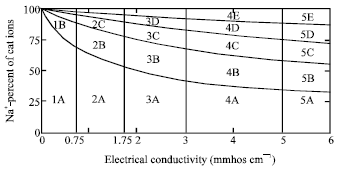
In a study of Utah waters, Thorne and Thorne (1951) presented a diagram similar to Wilcox's as given in Fig. 2. The diagram recognized two main criteria i.e., electrical conductivity with a rating number, 1 to 5 and the sodium effects with a letter, A to E. This diagram gives a rating to water having a low electrical conductivity (above 60%).
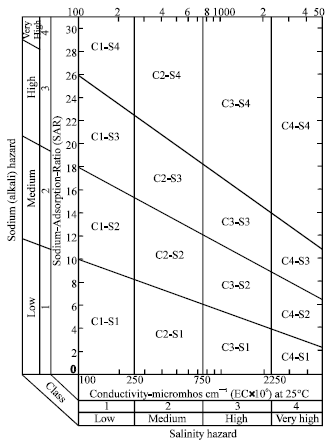
The US Salinity Laboratory (1954) published a semi-logarithmic diagram in Handbook 60, that rates waters with respect to total salinity (EC) and sodium hazard and the sodium adsorption ratio (SAR) as presented in Fig. 3. This classification scheme has been used extensively since its publication.
The permissible limits for boron are shown in Table 6 (Scofield, 1936).
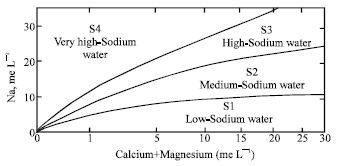
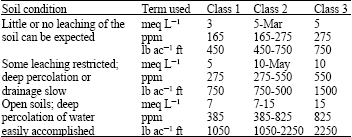
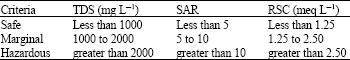
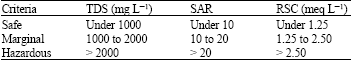
With respect to residual sodium carbonate, Eaton (1950) said that waters with more than 2.5 meq L-1 of residual sodium carbonate are not suitable for irrigation purposes. Waters containing 1.25 to 2.5 meq L-1 are marginal and those containing less than 1.25 meq L-1 are probably safe. Wilcox (1948) discussed four factors affecting irrigation water quality; salinity, sodium, boron and sodium carbonate. His limits for electrical conductivity are the same as that of the Salinity laboratory classification, but he presented another sodium diagram, Fig. 4, for classifying water with respect to the sodium hazard, S1 to S4.
Doneen (1954) presented a classification scheme based on effective salinity expressed in meq L-1. He defined effective salinity as the total salinity less that of CaCO3, Ca(HCO3)2, MgCO3, Mg(HCO3)2 and CaSO4 subtract in that order. Doneen's tentative classification of irrigation water based on effective salinity and soil conditions is given in Table 7.
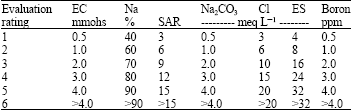
Christiansen and Olsen (1973) proposed a procedure for evaluating the quality of water for irrigation that delineated seven factors that should be considered: EC, Na%, SAR, Na2CO3, Cl, effective salinity (ES) and boron. This evaluation for irrigation water with some modification of the limiting values is given in Table 8.
| Table 7: | Tentative classification of effective salinity of irrigation water (Doneen, 1954) |
 | |
| Table 8: | Evaluation of irrigation water quality maximum values (Christiansen and Olsen, 1973) |
 | |
Ayers and Westcot (1985) suggested the following water quality standards for agriculture use (Table 9).
| Table 9: | Guidelines for Interpretation of water quality for Irrigation (FAO, 1985) |
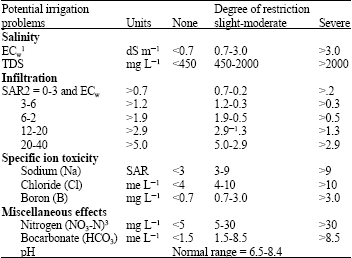 | |
1: ECw means Electrical conductivity of irrigation water at 25°C. 2: SAR means sodium adsorption ratio. 3: NO3-N means nitrate nitrogen reported in terms of elemental nitrogen | |
 |
| Table 9: | Continue |
 | |
Tipton and Kalmbach Inc. Engineers (1965) proposed the following irrigation water standards for upper Rachna Doab area in Pakistan:
 |
Tipton and Kalmbach Inc. (1969) proposed the following water quality standards for the generally permeable sandy soil of the Lower Thal Doab area in Pakistan.
 |
Hunting Technical Services and Macdonal and Partners (1964) suggested that irrigation water having total salt contents less than 750 ppm may be directly used for irrigation. Water in the range of 750 to 1500 ppm has to be mixed with canal water (TDS = 150-200 mg L-1).
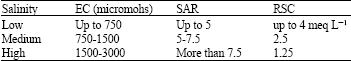
Hamid et al. (1966) reported that water with electrical conductivity less than 1500 micromhos/cm is safe for irrigation. Water having electrical conductivity between 1500 to 3000 micromhos/cm requires mixing with canal water before being used for irrigation. Water with electrical conductivity exceeding 3000 micromohs cm-1 requires corresponding higher dilution with canal water and can be used only to irrigate salt tolerant crops.
Hunting Technical Services proposed the following standards for irrigation water (1964):
They further established that if the TDS and SAR exceed the safe limits, the water still can be rendered usable by mixing with canal supplies in the following proportions:
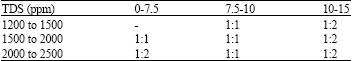 |
The Land Reclamation Directorate Lahore, Pakistan proposed the following classification scheme for irrigation water:
 |
The limit of critical values as prescribed above would eliminate most of the sodium hazards potentially present in the groups of water listed above, In case it is intended to use water of inferior quality, the judicious use of gypsum will be required constantly.
The Mona Reclamation and Experimental Project (MREP) Bhalwal Sargodha, Pakistan proposed the following scheme for the use of poor quality waters:
 |
PROBLEMS OF EFFICIENT WATER USE
Water losses: Loss of irrigation water through evaporation from irrigation systems (for example: open irrigation canals, sub-irrigation channels and drains in Al-Ahsa Oasis in particular and around the world as a whole) and the deep percolation due to over irrigation of open field crops by flood irrigation is a major problem. This water loss is defined as that portion of applied water which is not used beneficially and is also not accounted towards agricultural production. For an example, take the case of Al-Ahsa Oasis, the water losses from irrigation canals were estimated using Class A-pan evaporation data in the area and were 3.75 to 4.53x10⁶ m3 per year according to Lin (1984) (Fig. 5). If the total surface area for all the drainage canals is also considered then the total evaporation losses of water will be two times to that of irrigation canals. Correspondingly, based on the consumptive use of different crops, the total crop water requirements ranged from 26.65 to 137.82x10⁶ m3 for the period from 1974-83 (Fig. 5).
Al-Ajaji (1985) found mean actual deep percolation (ADP) losses up to 58% of the actual irrigation water applied and is the main source of excessive drainage flow in Al-Ahsa drainage canals while conducting a basin irrigation evaluation study in alfalfa field (Fig. 6).
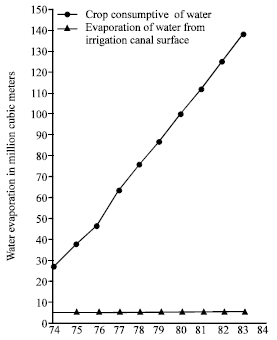 | |
| Fig. 5: | Class A-Pan Evaporation in Al-Ahsa Oasis (Lin, 1984) |
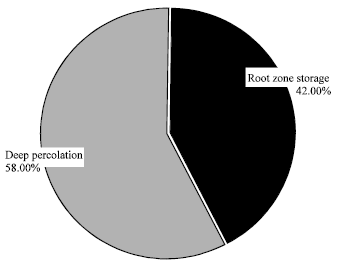 | |
| Fig. 6: | Deep percolation losses from alfalfa field in Al-Ahsa Oasis. ADP as % of total volume applied (Source: Al-Ajaji, 1985) |
This was also very well supported by the high negative correlation between Actual Deep Percolation (ADP) and application efficiency of low quarter (AELQ r = 0.86). He further concluded that ADP is related mainly to basin length (L), average depth applied (ADA) and the ratio between soil moisture deficit (SMD) and management allowed deficit (MAD) by the following equation:
ADP = 69.20-0.77 L = 7.15 ADA-78.13 SMD/MAD |
Because this equation has high statistical significance and a high coefficient of determination value of 99.9 and 0.91, respectively.
RESALINIZATION OF AGRICULTURAL LANDS
Resalinization of agricultural lands is a serious problem in an arid environment due to extremely high evaporative conditions, low rainfall and the use of marginal quality water for crop irrigation. This could be the result of many factors such as climate, geology and configuration of the terrain which determine soil properties, land drainage, soil, water and crop management practices adopted (El-Khatib, 1974). In an arid climate, where evapo-transpiration exceeds rainfall, the magnitude of soil resalinization process is of very high order. The problem of resalinization is world wide (United Nations, 1977). The countries of the Middle and the Near East suffer from this problem to a greater extent. There are signs of soil resalination in the Middle East countries but no statistics is available. However, according to Vidal (1951), the arable land in Al-Ahsa Oasis was estimated around 16,000 hectares. But during the last 15 years, this area decreased to 8,000 hectares because of resalinization due to over-irrigation and poor field drainage conditions (HIDA, 1984).
INADEQUATE LAND DRAINAGE
Poor soil permeability is a one of the major factors limiting the use of marginal quality water for agricultural expansion. Because it will reduce water infiltration rate of soil and create a temporary water ponds (a perched water table condition) below the soil surface. This will not only restrict salt leaching but also is a main source of soil resalinization. Furthermore, high evaporative conditions will increase salt movement from lower soil depths to the surface layer by capillary action (HIDA, 1984).
UNSCIENTIFIC USE OF IRRIGATION WATER
Efficient use of irrigation water depends on soil type, water quality, irrigation methods adopted, planting methods, irrigation scheduling, amount and intensity of rainfall, crop selection and crop water requirements. Inadequate information and lack of awareness among the farming community on the use of water causes over or under irrigation of crops in some cases. This has resulted in land degradation especially when the depth to hard layer (clay pan) is shallow. Such typical situation of shallow hard layer along with soil resalinization is clearly evidenced in the Al-Ahsa Oasis, Kingdom of Saudi Arabia. The once potentially irrigated agricultural land has decreased from 25 thousand hectares to around 10 thousand hectares in the whole oasis due to resalinization due to poor drainage conditions.
WATER USE EFFICIENCY AND NITROGEN REQUIREMENTS OF CROPS
Estimation of water use efficiency (WUE) and crop water requirements is a key element for efficient water management. The WUE of wheat ranged between 2.67 and 12.24 kg/ha/mm (well water) and 4.29 and 12.67 kg/ha/mm (aquaculture effluent). I t was found that application of 150-225 kg N ha-1 for well water irrigation and 75-150 kg N ha-1 for aquaculture effluent containing 40 mg N L-1 would be sufficient to obtain optimum grain yield and higher WUE of wheat in Saudi Arabia (Al-Jaloud et al., 1993a, b). However, a very little work is accomplished on consumptive use of water for different crops under the hot climatic conditions of Saudi Arabia (Aziz et al., 1983). Al-Ghamdi et al. (1991) conducted a trial on the effect of intervals of irrigation on yield, yield components and WUE of sunflower on a sandy-loam soil. The mean values for WUE were 5.19, 5.09 and 3.95 (kg seed/ha/mm) for 1986-87 crop season and 5.79, 5.33 and 3.87 (kg seed/ha/mm) for 1987-88 crop season corresponding to I-1 (40% depletion of available water), I-2 (60% depletion of available water) and I-3 (80% depletion of available water) treatments, respectively. In conclusion, an irrigation interval of 10-days (equivalent to 60% depletion of available water) is optimum for reasonable sunflower production in Al-Ahsa, Saudi Arabia.
PREVIOUS RESEARCH ON BIO-SALINE AGRICULTURE
Al-Zarah (2008) analyzed 101 well water samples from Al-Ahsa Oasis. The EC of groundwater ranged between 1.23 and 5.05 dS m-1. Sodium was the most abundant cation followed by Ca, Mg and K in descending order. Chloride was the most abundant anion followed by SO4 and HCO3 in groundwater of Al-Ahsa Oasis. A significant correlation was found between Na and Cl (R2 = 0.936). Thermodynamics calculation revealed that an appreciable amount of Ca and Mg is associated with Cl and SO4 ions. The SAR and ESP values are within the permissible limits according to US Salinity Lab. (1954). The NO3 concentration is within safe limits for drinking purpose according to WHO (1984) standards. The saturation indices (SI) indicated that groundwater is under-saturated (negative SI) with respect to certain minerals (for example: calcite, dolomite, gypsum, anhydrite, halite, pyrite, fluorite and aragonite) and oversaturated (positive SI) with respect to some other minerals (For example: goethite, siderite and hematite). The negative saturation index (SI) reveals that most of minerals are in un-saturated state and will dissolve more Ca and Mg into the soil solution after irrigation. A good relationship exists between Cl and other ions (Na, Ca and Mg) as well as between SO4 and Ca and Mg ion of groundwater. The salinity and sodicity hazards of groundwater of Al-Ahsa Oasis were classified as C3S1 and C4S2 i.e., high salinity with medium sodicity problems. The predicted soil salinity suggested that 15-20% leaching requirement should be applied to keep soil salinity within permissible limits. Also, cultivation of slight to moderate salt and sodium tolerant crops is recommended for optimal agricultural production and efficient water use.
SALINE IRRIGATION
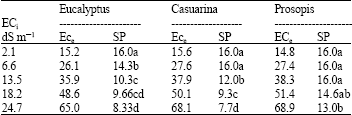
Presently, due to inadequate freshwater irrigation supplies, the use of marginal quality waters is inevitable for agricultural expansion. Hussain et al. (1994) found that the survival period of trees decreased significantly with increase in soil salinity resulting from irrigation water salinity (Table 10). The survival period of Prosopis juliflora was significantly more than Casuarina equisetifolia and Eucalyptus camaldulensis. Also, the tree biomass decreased significantly with increase in soil salinity (Table 11). Soil salinity and sodicity increased significantly with an increase in irrigation water salinity and sodicity (Table 12, 13). Prosopis juliflora tolerated soil salinity (Ece) up to 38.3 dS m-1 with irrigation water salinity of 13.5 dS m-1, Casuarina equisetifolia up to 27.6 dS m-1 with irrigation water salinity of 6.6 dS m-1 and Eucalyptus camaldulensis up to 15.2 dS m-1 with irrigation water salinity of 2.12 dS m-1 for proper establishment provided 15% extra water is applied as leaching requirement to control soil salinity. The experiment proved the sequence in salt tolerance for different trees as prosopis >casuarina >eucalyptus.
Hussain et al. (1995) reported mean greenmatter yield of 56.72 g (Hassawi), 54.29 g (Supreme) and 59.91 g (CUF-101) per pot with total water salinity of 7.8 dS m-1. Nabulsi et al. (1994) stated that drainage water salinity reduced straw yield from 666-460 g m2, plant height from 0.88-0.73 m, tillers per plant from 8.2-5.3, kernel yield from 546-201 g m-2, spikes from 336-251 m-2 and 100 kernel weight from 4.2-2.5 g. Generally, the application of 150 and 200 kg N ha-1 significantly improved crop performance and yield under salinity stress.
| Table 10: | Effect of saline water on survival period (weeks) of windbreak trees |
 | |
| Data in a column followed by the same letter do not differ significantly by LSD (p = 0.05). SP: Survival Period. Source: Hussain et al. (1994) | |
| Table 11: | Effect of saline water of tree biomass yield |
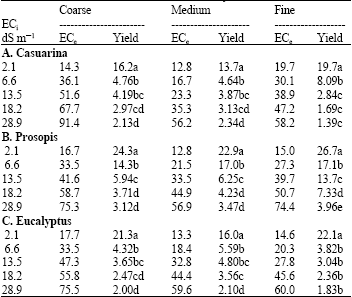 | |
| Data in a column followed by the same letter do not differ significantly by LSD (p = 0.05). Source: Hussain et al. (1994) | |
| Table 12: | Effect of water salinity on soil salinity |
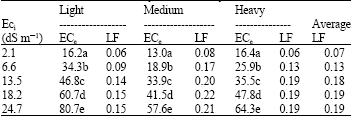 | |
| Data within a column followed by the same letter do not differ significantly by LSD (p =0.05). Source: Hussain et al. (1994) | |
| Table 13: | Effect of sar of waters on SAR of soils |
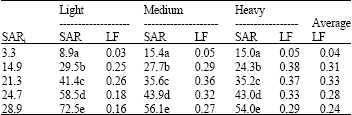 | |
| Data within a column followed by the same letter do not differ significantly by LSD (p = 0.05). Source: Hussain et al. (1994) | |
Helalia et al. (1996) found that alfalfa produced good growth and drymatter yield under both the canal (3.2-3.4 dS m-1) and mixed canal and drainage (6.4-8.6 dS m-1) irrigation waters. Whereas, irrigation with drainage water (10.2-15.6 dS m-1) reduced the yield significantly especially at biweekly irrigation frequency and at low nitrogen and phosphorus levels.
AQUACULTURE EFFLUENT
A field experiment was carried out on sandy-clay-loam soil on the use of aquaculture effluent as a supplemental source of nitrogen fertilize to wheat crop (Al-Jaloud et al., 1993a,b). The mean ranges for different crop growth parameters under various fertilizer treatments were plant height between 51.9 and 74.8 cm (well water) and between 60.7 and 79.0 cm (aquaculture effluent); greenmatter yield between 6.9 and 22.8 Mg ha-1 (well water) and 9.6 and 25.1 Mg ha-1 (aquaculture effluent); drymatter yield between 1.71 and 4.53 Mg ha-1 (well water) and 2.28 and 4.89 Mg ha-1 (aquaculture effluent); total biomass between 5.5 and 18.7 Mg ha-1 (well water) and 7.1 and 18.8 Mg ha-1 (aquaculture effluent); grain yield between 1.68 and 7.70 Mg ha-1 (well water) and 2.70 and 7.97 Mg ha-1 (aquaculture effluent), straw yield between 3.8 and 11.0 Mg ha-1 (well water) and between 4.4 and 10.9 Mg ha-1 (aquaculture effluent); and the number of tillers per plant from 2.06 to 4.63 (well water) and from 3.19 to 5.81 (aquaculture effluent). Overall, the results obtained with 25 to 50% nitrogen application under aquaculture effluent irrigation were comparable with those obtained with 75 and 100% nitrogen application under well water irrigation. In conclusion, a 50% saving in nitrogen application as an inorganic fertilizer can easily be achieved if crops are irrigated with aquaculture effluent containing around 40 mg N L-1.
Hussain and Al-Jaloud (1995) observed that water use efficiency (WUE) for grain yield in 1991-1992 was 2.67-12.24 kg/ha/mm (well water) and 4.29-12.67 kg/ha/mm (aquaculture effluent). Whereas, the WUE based on grain yield in 1992-1993 was 1.22 kg/ha/mm (well water) and 3.40-9.21 kg/ha/mm (aquaculture effluent). The WUE, obtained in T-4 and T-5 irrigated with well water and receiving 75 and 100% nitrogen requirements, respectively was comparable with T-4 and T-5 irrigated with aquaculture effluent and receiving 25 and 50% nitrogen requirements, respectively. It was, therefore, concluded that application of 150-225 kg N ha-1 for well water irrigation and 75 and 150 kg N ha-1 for aquaculture effluent containing 40 mg L-1 would be sufficient to obtain higher WUE of wheat in Saudi Arabia.
Al-Jaloud et al. (1996) in a field experiment on canola found the mean plant height range of 1.20-1.40 m (well water) and 1.40-1.57 m (aquaculture effluent) in different fertilizer treatments. Mean biomass yield for canola ranged between 14.60-17.84 Mg ha-1 (well water) and 12.70-20.74 Mg ha-1 (aquaculture effluent). The mean seed yield for canola varied from 2.65-3.44 Mg ha-1 (well water) and 3.02-3.74 Mg ha-1 (aquaculture effluent): and for rapeseed from 2.73-3.26 Mg ha-1 (well water) and from 2.62-3.29 Mg ha-1 (aquaculture effluent). The mean oil contents for canola were 30.92-34.53% (aquaculture effluent) and 32.47-35.78% (well water): and for rapeseed from 30.15-34.53% (well water) and 33.50-35.96% (aquaculture effluent). Application of 175 kg N ha-1 with 50 kg P ha-1 showed significant effect on crop yield under both types of irrigation water. Based on the results of this study, it appears that cultivars of rapeseed recently introduced from Canada have an excellent potential as oilseed crops in Saudi Arabia.
USE OF TREATED MUNICIPAL WASTEWATER
Hussain et al. (1996) investigated the yield and Nitrogen Use Efficiency (NUE) of wheat under field conditions with two types of irrigation waters with and without nitrogen application on a sandy-loam to sandy soil. Depending upon different nitrogen treatments, the mean crop yield ranges in 1992-93 were: grain yield 6.19-6.87 Mg ha-1 and biomass 15.41-16.34 Mg ha-1 receiving treated effluent. The mean crop yield ranged in 1993-94 were: grain yield 0.46-3.23 Mg ha-1 (well water) and 5.20-6.54 Mg ha-1 (treated effluent): and biomass 1.84-10.80 Mg ha-1 (well water) and 16.00-19.29 Mg ha-1 (treated effluent). The NUE for grain yield in 1992-93 was between 16.70-50.23 kg kg-1 N (well water) and 20.65-91.56 kg kg-1 N (treated effluent). Whereas, the NUE in 1993-94 varied between 10.49-32.13 kg grain kg-1 N (well water) and 21.30-72.93 kg grain kg-1 N (treated effluent). The NUE for total biomass in 192-93 varied between 46.54-130.32 kg kg-1 N (well water) and 53.66-158.77 kg kg-1 N (treated effluent). Similarly, the NUE in 1993-94 varied between 35.99-102.10 kg biomassg-1 N (well water) and 59.27-161.89 kg biomass kg-1 N (treated effluent). It was concluded that a higher grain yield and NUE of wheat crop can be achieved with low application of nitrogen if the crop is irrigated with treated effluent containing nitrogen in the range of 20 mg L-1.
Alshammary et al. (2008) conducted a field experiment to evaluate the growth response, proline and mineral content of four warm-season turfgrasses to saline water irrigation. Four salinity treatments were imposed on sandy soil by irrigation with waters at 2.0, 6.25, 12.5 and 18.8 dS m-1. The local Bermuda grass, Tifgreen Bermuda grass, Nagisa zoysia grass and salt grass experienced a 25% shoot growth reduction at 7.9, 20.5, 10.2 and 26.0 dS m-1, respectively. Although shoot Na+ and Cl¯ contents increased linearly with increasing salinity for all species, the extent of increase ranked as: local Bermuda grass >Nagisa >Tifgreen >Salt grass. Sodium and Cl exclusion likely contributed to the superior salinity tolerance of salt grass and Tifgreen.
| Table 14: | Effect of irrigation water salinity on fresh biomass and fresh root weight of plants (kg plant-1) |
 | |
| Values in a row followed by the same letter are not significantly different by LSD0.05 (p = 0.05). Source: Alshammary et al. (2008) | |
The experiment demonstrated that at 2.5 dS m-1 irrigation water salinity, Tifgreen, local Bermuda grass and Nagisa all performed very well in Saudi Arabia (Table 14). At 6.25 to 12.5 dS m-1 salinity, Tifgreen exhibited better turf quality than local Bermuda grass and Nagisa and salt grass. However, at the highest salinity (18.8 dS m-1), only salt grass and Tifgreen showed acceptable turf quality which was significantly higher than the local bermuda grass and Nagisa.
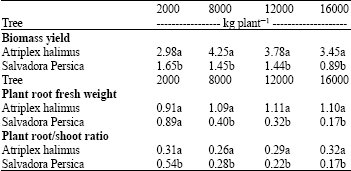
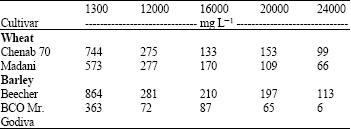
Alshammary (2008) conducted a field experiment to determine the growth characteristics and mineral composition of two local halophytes (Atriplex halimus and Salvadora persica) under saline irrigation at Kind Abdulaziz City for Science and Technology (KACST), Research Station Al-Muzahmyia, Riyadh. The experiment treatments were one soil ( sandy), four irrigation waters of different salinities (2000, 8000, 12000 and 16000 mg L-1 TDS), two halophytes (Salvadora persica and Atriplex halimus) and one irrigation level (irrigation at 50% depletion of moisture at field capacity). Mean fresh biomass yield and fresh plant root weight of A. halimus increased while that of S. persica decreased significantly with increasing irrigation water salinity in all the treatments. Soil salinity increased significantly with increasing water salinity (Table 15). A positive correlation (r = 0.987) existed between the irrigation water salinity and the soil salinity resulting from saline irrigation. The plant tissue protein contents increased in A. halimus, but decreased in S. persica with increasing irrigation water salinity. The Na ion uptake by plant roots was significantly less than K in A. halimus compared to S. persica which indicated adjustment of plants to high soil salinity and high Na ion concentration for better growth. The order of increasing salt tolerance was A. halimus >S. persica under the existing plant growing conditions.
Al-Rehaili (1997) suggested that practice of municipal wastewater treatment and reuse in the Kingdom of Saudi Arabia is in urgent need of improvement in all aspects.
| Table 15: | Effect of irrigation water salinity on soil salinity (ECe = dS m-1) |
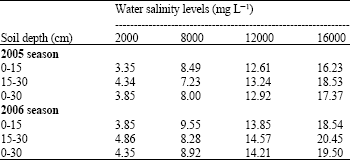 | |
| Source: Hussain and Alshmmarry (2008) | |
He recommended immediate expansion of wastewater collection, treatment capacity and reuse, establish process selection and design guidelines. Considering the Kingdom’s local requirements, establish rational and enforceable quality control criteria for effluent disposal and reuse.
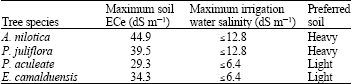
Hussain and Alshammary (2008) carried a greenhouse experiment to determine the effect of water salinity on the survival and growth of landscape trees and soil properties. The survival period of trees decreased significantly with increase in soil salinity resulted from irrigation water salinity. The survival period of Acacia nilotica and Prosopis juliflora was significantly more than Eucalyptus camaldulensis and Parkinsonia aculeate under different water salinity levels and soil types. The total biomass decreased significantly with increase in soil salinity. Soil salinity and sodicity increased significantly with increasing irrigation water salinity and sodicity. Prosopis juliflora tolerated soil salinity (Ece) up to 39.5 dS m-1 and Acacia nilotica up to 44.9 (Ece) when irrigated with water salinity of 12.80 dS m-1; Parkinsonia aculeate up to 29.26 (ECe) when irrigated with water salinity of 6.45 dS m-1 and Eucalyptus camaldulensis up to 34.3 (ECe) when irrigated with water salinity of 6.45 dS m-1. Tree survival and proper establishment is possible provided management practices such as leaching requirement (at least 15%), proper selection of trees, right irrigation water salinity and proper planting methods are followed. The salt accumulation was significantly more in light than in heavy soil. A strong correlation (r2) was observed between soil salinity and plant biomass which indicated significant decrease in biomass with increasing soil salinity resulting from saline irrigation. The experiment proved the sequence in salt tolerance for different landscape trees as Prosopis and Acacia >Parkinsonia >Eucalyptus.
The study findings were converted to an extension fact sheet for use in saline irrigation management as below:
 |
PLANT GROWTH AND SOIL PROPERTIES
Effects of wastewater on plant growth and soil properties were studied in a pot experiment (Al-Jaloud et al., 1995). Mean biomass ranged between 159 and 210 g per pot for maize and between 165 and 212 g per pot for sorghum in different eater salinity treatments. Mean drymatter yield ranged betwee n 28.9 and 38.3 g per pot for maize (corn) crop and between 34.9 and 50.4 g per pot for sorghum. The crop yield showed significant increase with increase in water salinity. This was presumably due to the nutrients present in wastewater, especially the nitrogen. Plant yield decreased slightly at water salinity level of 2330 mg L-1 (TDS), indicating that higher water salinity can neutralize the beneficial effects of nutrients in wastewater. Soil salinity and sodicity increased significantly with corresponding increase in water salinity and sodicity (r values of 0.98 for maize and 0.98 for sorghum with respect to soil salinity and 0.96 for maize and for 0.95 sorghum with respect to SAR of soils). The interaction between crop and water treatments was significant for soil salinity (LSD0.05 = 0.48) and SAR of soil (LSD0.05 = 2.55). Overall, the soil salinity and sodicity was significantly more in sorghum than maize. The results showed that wastewater can successfully be used to grow corn ad sorghum as forage crops, provided 15 to 20% excess water is applied to meet leaching requirements to maintain soil salinity within acceptable limits for optimal agricultural production.
In the second part of the above mentioned experiment, it was found that the ranges for different minerals in corn plant were 0.67-0.89% (Ca), 0.38=0.58% (Mg), 0.09-1.29 5 (Na), 0.81-1.87% (N), 1.81-2.27% (K), 0.1200.16% (P), 190-257 mg kg-1 (Fe), 3.5-5.6 mg kg-1 (Cu), 37.1-44.5 mg kg-1 (Mn), 21.6-33.6 mg kg-1 (Zn), 1.40-1.84 mg kg-1 (Mo), 11.0-45.7 mg kg-1 (Pb) and 2.5-10.8 mg kg-1 (Ni). Whereas for sorghum plants, the ranges were: 0.56-0.68% (Ca), 0.19-0.32% (Mg), 0.02-0.27% (Na), 0.69-1.53% (N), 1.40-1.89% (K), 0.10-0.14% (P), 190-320 mg kg-1 (Fe), 3.8-6.0 mg kg-1 (Cu), 29.20-37.6 mg kg-1 (Mn), 21.1-29.9 mg kg-1 (Zn), 2.2-3.7 mg kg-1 (Mo), 12.3-59.0 mg kg-1 (Pb) and 2.5-15.2 mg kg-1 (Ni). however, heavy metal such as Co and Cd were below detection limits at mg kg-1 level. The concentration of Ca, N, K, P, Cu and Mn in corn plants was in deficient range except for Mg, Fe, Zn and Al. The concentration of Ca, N, P, K, Cu, Mn, Mg and Zn in sorghum plants was in the deficient range except for Fe and Al. The analyses of regression indicated a strong interaction between Pb, Ni, Ca and Fe in corn and sorghum plants, In conclusions, wastewater irrigation did not increase mineral concentrations of either macro/micro-elements or heavy metals in corn and sorghum plants to hazardous limits according to the established standards and could safely be used for crop irrigation.
CROP IRRIGATION
Some research conducted in Saudi Arabia has shown a lot of potential for the reuse of saline water for crop irrigation without economical yield losses. Al-Tahir et al. (1989) and Fallatah and Hussain (1988). Al-Tahir et al. (1989) also observed that highly saline drainage water could be used efficiently by mixing it with normal irrigation water (Table 16, 17).
Similarly, Al-Mashhady et al. (1983) investigated on the use of highly saline water for wheat and barley irrigation. They found that yields of both wheat and barley crops decreased significantly with increase in irrigation water salinity. The yield losses were highly uneconomical (Table 18).
| Table 16: | Effect of irrigation water salinity on greenmatter and drymatter yield of faba bean (Vicia faba L.) cultivars |
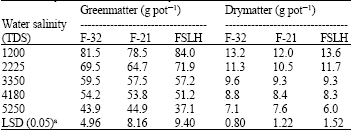 | |
| aLSD: Least significant difference F-32 and F-21(Egyptian cultivars), FSLH (local cultivar). (Source: Fallatah and Hussain, 1988) | |
| Table 17: | Effect of drainage and normal irrigation waters on dryweight (mg) of different plant parts of faba bean cultivars |
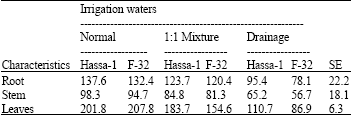 | |
| (Source: Al-Tahir et al., 1989) | |
| Table 18: | Grain yield of wheat and barley (g m-2) |
 | |
| (Source: Al-Mashhady et al., 1983) | |
| Table 19: | Estimated water consumption of crops in 1996 |
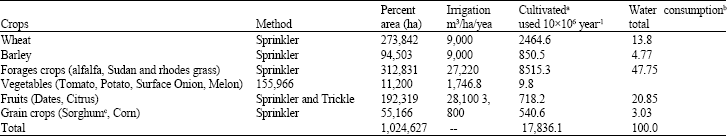 | |
| aSource, Department of Economic Studies and Statistics (1998), bAl-Zeid et al. (1988), cSorghum in Jizan not included | |
WATER USE IN SAUDI ARABIA
The total water consumed in the country was 20,406.1x106 m3 in 1996 (1415 H.). Out of this 14,481.1x106 m3 was used by agriculture, 1,925x106 m3 for domestic and industrial purposes (Ministry of Planning, 1998). It indicated that 91% of the total used accounted for agriculture and the remaining 9% was utilized for domestic and industrial purposes. Estimated water consumption in the kingdom is shown in Table 19.
SALT TOLERANT PLANTS
There are many salt tolerant plants which showed promising results. The research done on some plants is summarized below:
Atriplex: It is a salt and drought resistant plant. For example, A. hastata survived in the presence of 25.6% of NaCl (Flowers et al., 1977). Atriplex is also a drought resistant plant and is recommended as a forage crop in area where irrigation water is in short supply and the rainfall is less than 250 mm per year (Brown, 1977). Similarly, Hyder et al. (1989) studied the performance of atriplex species at different salinity levels in various locations in the Kingdom. The initial soil salinity (ECe) was 80 dS m-1 and 40 dS m-1 in Al-Hofuf anf Al-Qateef, respectively. Plant characteristics are summarized from Al-Qateef region in Table 20.
| Table 20: | Yield biomass, diameter, protein and ash contents of atriplex species grown at al-qatif for plant of 6 months age |
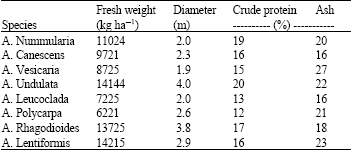 | |
| Source: Hyder et al. (1989) | |
Salicornia: Salicornia plants grow in a salty environment such as coastal marshes. The plants are succulent with fleshy stem and small leaves and have a good potential for forage and oil from the seed. A study conducted by Charnock (1988) at the Environmental Research Laboratory, University of Arizona, USA showed that salicornia can be grown in some coastal lands of the United Arab Emirates with salinity reaching up to 30% which is about 10 times more than the seawater and can be irrigated with seawater as a fodder crop. It was also calculated that one hectare of salicornia crop could feed up to 20 goats or sheep where as one hectare of forage crop irrigated with good quality can raise 35 goats or sheep (Ministry of Agriculture and Water, 1992). It was also suggested that several trials should be made to grow salicornia at different sites in the Kingdom (North of Umm Lojj).
Kochia: It is another salt tolerant and drought resistant plant. It is a bushy herb and may be used as a green or dry fodder for livestock (Zahran, 1990). A field experiment was conducted by Zahran (1986) on germination, growth and vegetative yield of Kochia in a salt affected land in the western regions of Saudi Arabia near Bahra (Site midway between Makka and Jeddah). The initial soil salinity (ECe) was 2.6 dS m-1. Saline artesian water having salinity of 8.3 dS m-1 was used for irrigation. The yield was about 55.3 ton ha-1.
MANAGEMENT STRATEGIES FOR SALINE WATER IRRIGATION
Saline irrigation management means to maximize water use and to minimize deleterious effects on crop production. Many strategies have been developed to use saline water for irrigation without considerable loss in crop yields (Rhoades, 1984; Ayers and Westcot, 1985; Stromberg, 1980). Some of the management practices to be adopted under saline irrigation are:
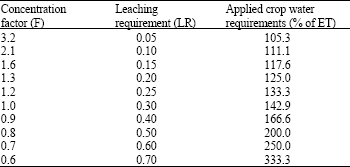
| Table 21: | Concentration factors (F) for predicting leaching requirement (LR) and crop water requirements |
 | |
| Ayers and Westcot (1985) | |
Leaching requirements: All irrigation waters, surface or sub-surface, contain salts in different amounts and proportions. Accumulation of salts in soils is a common phenomenon under long term irrigation even with less saline water. Therefore, application of leaching requirements is important for sustained irrigated agriculture. Furthermore, Ayers and Westcot (1985) proposed the method to calculate leaching requirements (LR) based on a water uptake distribution of 40:30:20:10% for the first through fourth quarters of root zone will be referred to as the tabular method (Table 21).
Provision of adequate drainage: Oftenly poor drainage is the root cause of resalinization of arable agricultural lands under irrigation and sometimes causes sizable crop yield losses. Also the presence of hard layer (clay pan) beneath the crop root zone could cause perched water table and create soil-water conditions unfavorable for normal plant growth. Therefore, provision of adequate drainage is a key factor for successful agriculture using saline water irrigation.
Adoption of improved irrigation practices: Over-irrigation, in some cases, is another source to keep soil salinity within acceptable limits for optimum production. However, depending upon many factors such as irrigation water quality, crop to be planted, initial soil salinity, water availability and the soil type, water requirements for reclamation of salt affected soil can be determined. Al-Jaloud (1994) and Hussain et al. (1988) developed leaching curves for the reclamation of salt affected soils in Al-Qasseem and Al-Ahsa regions, respectively to determine actual water requirements needs to bring soil salinity within acceptable limits. Besides this, adoption of sprinkler and semi-drip irrigation systems could minimize salt accumulation from saline irrigation.
Water requirements for land reclamation: Estimation of water requirement for reclamation of salt affected soils is important for proper planning, management and economical use of water resources. Because saline wastewater can easily be used for initial reclamation of highly salt affected soils instead of freshwater. A number of studies conducted on sandy salt affected soils showed that a 20 to 30 cm depth of water is required to reclaim the surface 0 to 30 cm depth of soil, a 60 to 90 cm depth of water is required to reclaim the subsurface 30 to 60 cm depth of soil and a 50 to 60 cm depth of water is required to reclaim the whole profile 0 to 60 cm depth of soil for a given salt affected soil and method of water application (Hussain et al. 1988). The study also provided a useful tool in the form of a leaching curve to evaluate water requirement for the reclamation of some salt affected soils in Al-Ahsa, Kingdom of Saudi Arabia. Whereas, Abdelhadi and Hussain (1987) showed that soil salinity was reduced from 75.50 to 16.75 dS m-1, SAR from 20.50 to 12.50 with 20 cm depth of water application. However, soil salinity and SAR (sodicity) of soil reached safe limits by applying 60 cm depth of water in a three month period. The gypsum contents decreased significantly with increase in irrigation water application. The study indicated that a highly salt-affected soil can be reclaimed with 60 cm depth of water for 0-30 cm surface soil and with 100 cm depth of water for 0-90 cm profile in a 3 to 5 month period.
Use of mulch and soil conditioners: Application of mulches and high moisture absorbing materials (synthetic polymers) increased significantly the water use efficiency, enhanced productivity of sandy soils and saved water up to 15 to 28% under normal irrigation practices (Hussain et al., 1986; Al-jaloud, 1988).
Crop selection: Selection of suitable crop for cultivation is important especially when saline irrigation is to be practiced. The yield reduction of crops depends on water salinity (EC) and soil salinity (ECe). The equation used is:
Y = 100 - b (ECe - a) |
Where:
| Y | = | Relative crop yield (percent) |
| a | = | Salinity threshold value |
| b | = | Yield loss per unit increase in salinity |
| ECe | = | Salinity of soil saturation extract (dS m-1) |
As an example, if barley is grown and irrigated with saline water having EC 10 = 6400 mg L-1 and a is 8 dS m-1 and b is 5%, the yield reduction will be only 10% (Maas and Hoffman, 1977).
Planting practices: Salts in soils move in the direction of waterflow and exposed evaporative surfaces. Therefore, the patron of salt accumulation is different in furrow irrigation and sloping beds plantation. salt concentration in the center of the bed regularly becomes 5 to 10 times greater than the original concentration in the plough layer (Bernstein, 1964). It is recommended that plantation should be done in the lower 2/3 of the furrow or to irrigate only alternate furrows or two rows in a wide bed. Since most of the plants are sensitive at germination stage than at later stages of growth, hence frequent irrigation should be done at germination stage.
Fertility management: All fertilizers contains salts and contribute to soil salinity. Therefore, special methods must be followed for fertilization. According to Ayers and Westcot (1985), spreading of 50 kg N ha-1 in the form of (NH4)2SO4 is not expected to cause salinity problems. For example, if the soil fertility is adequate but the soil salinity is a limiting factor, then any increase in fertilizer application will not improve crop yield or modify crop salt tolerant limits. However, correction of most limiting factors for yield reduction should be done to optimize production.
Pre-planting irrigation: There is a tendency for salts to accumulate during non cropping season on the surface of soils and the magnitude is high in arid climatic conditions. It is recommended that heavy pre-planting irrigation should be applied to leach surface salt in order to improve crop germination and stand.
Cultural practices: Leaching is the principal method of toxic ions control. The cultural practices are considered an aid in the management of irrigation water at the farm level for its success. Because cultural practices which offer better control and distribution of water include land grading, profile modification and artificial drainage if natural drainage is inadequate. These steps are complementary to those previously discussed for improved salinity and toxicity control.
The severity of a toxicity problem will increase as the crop withdraws soil-water and the soil dries between irrigations. The ions become concentrated in the smaller volume of soil water. As the upper soil dries, the crop must withdraw more and more of its water needs from the deeper soil where salinity and toxic ions are usually in greater concentration. Increasing the frequency of irrigation supplies a greater proportion of the water needs from the upper soil as well as diluting the deeper soil water and should reduce the impact of both salinity and toxic ions.
Sodium toxicity (high SAR) from applied water is generally countered by the use of a soil or water amendment such as gypsum. In general, where salinity of water is relatively low (ECw <0.5 dS m-1), the beneficial response to a water-applied amendment is much greater than if salinity is high because it is far easier to change the sodium to calcium ratio of a relatively low salinity than one of a high saline water or to a high ESP soil.
Blending of fresh and saline water supplies: If an alternative water supply is available, but not fully adequate in quantity or quality, a blend of waters may offer an overall improvement in quality and reduce the potential toxicity problem. This phenomenon of blending is specially effective for a sodium toxicity problem since proportions of monovalent (Na+) and divalent (Ca++) cations absorbed on the soil depend on the concentration, with dilution favouring adsorption of the divalent cations (calcium and magnesium) rather than the monovalent sodium.
CONCLUSION AND FUTURE STUDIES
The use of saline water as a supplemental source of irrigation is inevitable in arid and semi-arid countries due to inadequate freshwater for irrigation. In order to alleviate the use of saline water for crop production, studies in the following areas need priority.
| • | Biosaline research on field and vegetable crops for breeding and screening salt tolerant and drought resistant cultivars |
| • | Identify plant growth factors limiting production |
| • | Classification of promising crop cultivars for different regions of Saudi Arabia |
The comprehensive review has shown a lot of potential on the use of marginal quality groundwater for irrigation and reuse of wastewater after primary treatment for agricultural expansion provided certain soil, water and crop management practiced are considered under local climatic conditions.
REFERENCES
- Abdelhadi, Y.M. and G. Hussain, 1987. Leaching effects on some saline sodic gypsiferous soils in Saudi Arabia. Arid Land Res. Manage., 1: 245-251.
Direct Link - Al-Jaloud, A.A., G. Hussain, A.A. Al-Saadon, A.Q. Siddiqui and A. Al-Najada, 1993. Use of aquaculture effluent as a supplemental source of nitrogen fertilizer to wheat crop. Arid Soil Res. Rehabilitation, 7: 233-241.
Direct Link - Al-Jaloud, A.A., G. Hussain, J.A. Al-Saati and S. Karimulla, 1995. Effect of wastewater irrigation on mineral composition of corn and sorghum plants in a pot experiment. J. Plant Nutr., 18: 1677-1692.
Direct Link - Al-Jaloud, A.A., 1994. Water requirements for reclamation of salt affected soils in Al-Qasseem, Saudi Arabia. Arid Soil Res. Rehabilitation, 8: 187-197.
Direct Link - Al-Jaloud, A.A., G. Hussain, S. Karimulla and A.H. Al-Hamidi, 1996. Effect of irrigation and nitrogen on yield and yield components of two rapeseed cultivars. Agric. Water Manage., 30: 57-68.
Direct Link - Alshammary, S.F., G. Hussain and Y.L. Qian, 2008. Response of four warm-season grasses to saline irrigation water under arid climate. Asian J. Plant Sci., 7: 619-627.
CrossRefDirect Link - Alshammary, S.F., 2008. Effect of saline irrigation on growth characteristics and mineral composition of two local halophytes under Saudi environmental conditions. Pak. J. Biol. Sci., 11: 2116-2121.
CrossRefPubMedDirect Link - Al-Zarah, A.I., 2008. Chemistry of groundwater of Al-Ahsa Oasis Eastern region saudi arabia and its predictive effects on soil properties. Pak. J. Biol. Sci., 11: 332-341.
CrossRefPubMedDirect Link - Dabbagh, A.E. and W.A. Abderrahman, 1997. Management of groundwater resources under various irrigation water use scenarios in Saudi Arabia. Arab J. Sci. Eng., 22: 47-64.
Direct Link - Flowers, T.J., P.F. Troke and A.R. Yeo, 1977. The mechanism of salt tolerance in halophytes. Ann. Rev. Plant Physiol., 28: 89-121.
CrossRefDirect Link - Hamid, A., Z.A. Khan, M.S. Randhawa and K.D. Gowans, 1966. Appraisal of quality of tubewell water of SCARP-I soil and water chemistr. Complication of Studies for the Indus Plains, Technical Report by M/S Harza and, Water and Salinity Investigation Division (WASID), Water and Power Development Authority (WAPDA), Lahore, Pakistan, pp: 200.
- Hussain, G., A.A. Al-Jaloud, S. F. Al-Shammary and S. Karimulla, 1995. Effect of saline irrigation on the biomass yield and the protein, nitrogen, phosphorus and potassium composition of alfalfa in a pot experiment. J. Plant Nutr., 18: 2389-2408.
Direct Link - Hussain, G., M. Sadiq, Y.A. Nabulsi and O.J. Helweg, 1994. Effect of saline water on establishment of windbreak trees. Agric. Water Mange., 25: 35-43.
CrossRefDirect Link - Hussain, G. and A.A. Al-Jaloud, 1995. Effect of irrigation and nitrogen on water use efficiency of wheat in Saudi Arabia. Agric. Water Manage., 27: 143-153.
CrossRefDirect Link - Hussain, G., A.A. Al-Jaloud and S. Karimulla, 1996. Effect of treated effluent irrigation and nitrogen on yield and nitrogen use efficiency of wheat. Agric. Water Manage., 30: 175-184.
CrossRef - Hussain, G., M.H. Badawi and Y.A. Nabulsi, 1988. Water requirements for reclamation of salt affected soils in Al-ahsa, Saudi Arabia. Arid Soil Res. Rehabilitation, 3: 327-335.
Direct Link - Hussain, G. and S.F. Alshammary, 2008. Effect of water salinity on survival and growth of landscape trees in Saudi Arabia. Arid Land Res. Manage., 22: 320-333.
CrossRefDirect Link - Maas, E.V. and G.J. Hoffman, 1977. Crop salt tolerance-current assessment. J. Irrig. Drainage Div., 103: 115-134.
Direct Link - Nabulsi, Y.A., A.A. Al-Jasim and O.A. Al-Tahir, 1994. Effect of saline drainage water and nitrogen fertilization on kernel yield, vegetative growth and nitrogen and chlorophyll contents of Hassawi rice. Arid Soil Res. Rehabilitation, 8: 207-215.
Direct Link - Rhoades, J.D., R.D. Ingvalson, J.M. Tucker and M. Clark, 1973. Salt in irrigation water drainage water. I. Effect of irrigation water composition, leaching fraction and time of year on the salt composition of irrigation drainage waters. Soil Sci. Soc. Am. J., 37: 770-774.
Direct Link - Suarez, D.L., 1981. Relation between pHc and Sodium Adsorption Ratio (SAR) and an alternative method of estimating SAR of soil or drainage waters. Soil Sci. Soc. Am. J., 45: 469-475.
CrossRefDirect Link - Abu-Rizaiza, O.S., 1999. Modification of the standards of wastewater reuse in Saudi Arabia. Water Res., 33: 2601-2608.
CrossRef